5109 Avenue J · Houston, TX
Flood risk No data
- FEMA flood zone
- —
- Chance of flooding over 30 yrs
- —
- Est. flood insurance / yr
- —
Fire risk No data
- Est. fire insurance / yr
- —
Heat risk No data
- Hot days now (above threshold)
- —
- Hot days in 30 yrs
- —
Wind risk No data
- Chance of severe wind over 30 yrs
- —
Air-quality risk No data
- Unhealthy air days now
- —
- Unhealthy air days in 30 yrs
- —
Risk factors via First Street. Map © Google.
Why this score? — see what drove the D grade
The composite is a weighted blend of 9 inputs, each scored 0–100. Each bar is that input's sub-score; the figure is the points it added to the 100-point composite (weight × sub-score).
- Appreciation +10.0/10.0
- ARV discount +8.8/15.0
- Cash flow +6.7/30.0
- Condition / age +4.8/5.0
- Livability +3.7/5.0
- Schools +2.7/10.0
- Rent growth +1.8/5.0
- 1% rule +1.7/10.0
- DSCR +0.9/10.0
$369,900
🖨 Deal sheet 📄 Offer letter ✓ Due diligence
Listing remarks MLS
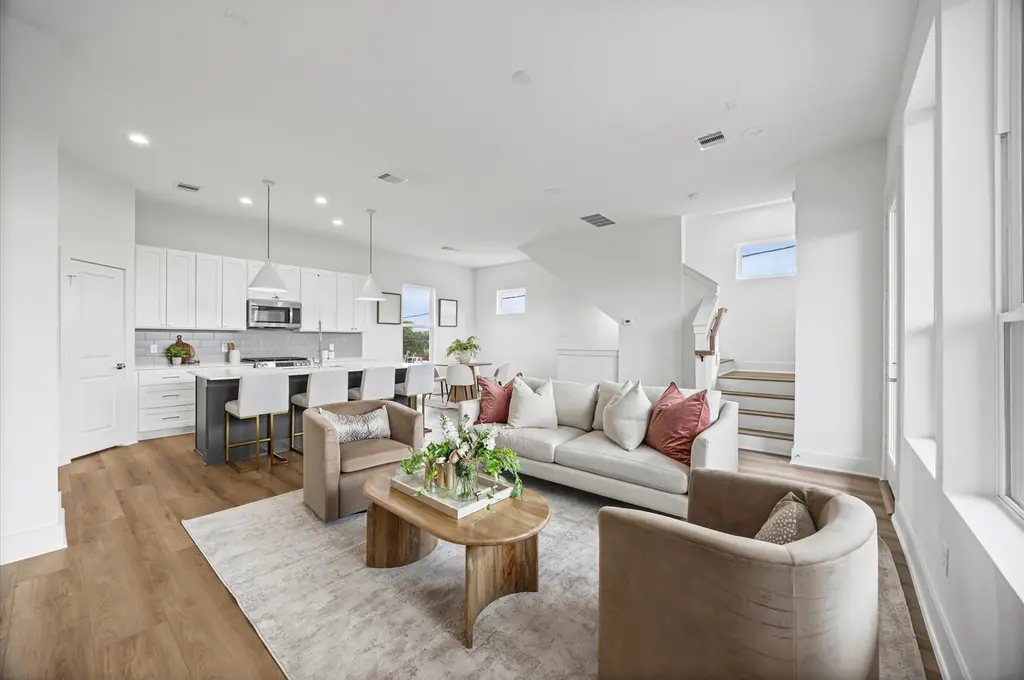
Experience modern city living in this stunning three-story new construction home located in the heart of vibrant EaDo. This 3-bedroom, 3-bath residence offers an open-concept layout with soaring ceilings, abundant natural light, and designer finishes throughout. The sleek kitchen features quartz countertops, and stainless steel appliances, perfect for entertaining. Each bedroom includes its own full bathroom, offering ultimate privacy and comfort—ideal for guests or roommates. The home also includes a two-car garage and no HOA. Located just minutes from Downtown, the East River Project, and local dining hotspots, this home blends urban convenience with upscale style. Don’t miss the opportunity to own in one of Houston’s fastest-growing neighborhoods!
Key facts
- Quartz countertops
- Full bathroom
- Two-car garage
Tags
Neighborhood map
What this means for you Summary
Snapshot
- This is a 3-bed/3.5-bath single-family listed at $370k. Condition is rated excellent.
Deal economics
- At list price, monthly cash flow is $-597 ($-7k/yr) — negative.
- To cash-flow at today's rent, offer at most $283k (23.4% below list).
- To meet the 1% rule (rent ≥ 1% of price), the offer needs to be $248k (33.0% below list).
- Recommended offer: $248k (33.0% below list) — sets the bar for 1% rule.
- Cap rate 4.4% vs local median 3.2% in Houston — top-decile yield for the area; either an underpriced asset or a hidden risk that comps aren't pricing in. Stress-test before assuming the spread holds.
Location & tenants
- Location reads 74/100 on livability (#184 in TX, #4,771 nationally) — a middle-class / working-renter tenant base. Strengths: amenities A+, cost of living A+, housing A+; Watch: schools D, crime F.
- Houston ISD (urban): math 27% / reading 35% proficiency, ranked #593 of 826 in TX (top 72%) — families likely to look elsewhere, expect single-tenant / working-renter base with shorter leases; 71% free/reduced lunch — lower-income household profile, screen leases tightly.
- Market conditions: Rents soft (-2.9%/yr); 161 active listings in the ZIP; 10 comparable units currently listed for rent nearby; rentals leasing fast (median 8d on market — plan ~1-2 weeks tenant-placement turnaround); 29,883 units permitted in Harris County in 2024 (8,621 in 5+ unit buildings).
- At $2,480/mo this rent would consume 59% of the median local household income ($50k/yr) (locally 655% of renters already pay >50% of income on rent) — very limited rent-growth headroom before tenants either downsize or default.
Forward outlook
- In year one you build about $40k of equity ($3k loan paydown + $37k appreciation (10.0% local appreciation)).
- Harris County population projected at +47% by 2050 — long-run rental-demand tailwind backs the buy-and-hold thesis.
- By year 2, paydown + projected appreciation supports a ~$64k cash-out refi (75% LTV) — recoverable capital for the next deal without selling this one.
Negotiation context
- It's been on market 88 days — a 6% lower offer ($348k) is reasonable based on typical stale-listing flexibility.
- 4 sale attempts with the ask held roughly flat each time — persistent listings suggest the price (not the market) is what's stuck; bring a comps-based counter.
Questions for the listing agent
- What do current leases actually rent for vs. the listed asking? Can we see a recent rent roll and the last 12 months of T-12 income?
- It's been on market 88 days. Have you received any prior offers? Is the seller open to a 33% concession, seller financing, or rate buy-down credit?
- Why hasn't it sold? Are there any deal-killer items the seller is aware of (foundation, flood, title, zoning, code violations)?
- Is there a deadline driving the sale (1031 exchange, divorce, estate, relocation)? That informs how much negotiation room exists.
- Schools are D-rated, which usually means shorter tenancies and higher turnover. Who's the typical renter profile here, and what's been the actual vacancy rate?
- Crime grade is F in this area — have there been break-ins, vandalism, or insurance claims at this property in the last 3 years? What carrier currently insures it and at what premium?
- The area grade is low — what's the realistic commute time and amenity access for the typical tenant pool here? Any planned neighborhood developments (good or bad) we should know about?
- What's the average days-on-market for RENTAL listings here right now (not sales)? A rising rental-DOM trend means longer vacancies and softer asking-rent achievability than the comps imply.
- What's the recent tenant-quality profile in this submarket — average credit score on applications, eviction rate, late-payment / NSF rate, and stable-employment percentage? A property-management company in the area should have these aggregated.
- How much new for-sale + rental construction is in the pipeline within 1–3 miles? Heavy new supply typically softens prices + rents 12–24 months out; constrained supply supports both.
Investment metrics
- 1% rule
- 0.67% ✗
- Cap rate
- 4.35%
- Cash-on-cash
- -6.92%
- DSCR
- 0.69
- GRM
- 12.4
CMA / ARV
- ARV (median comp)
- $381,301
- List price
- $369,900
- Delta
- -2.99%
- Verdict
- FAIR
- Comps
- 20 within 1.0 mi
Show comp detail 12 sales within ~0.75 mi
| Address | Dist | Beds/Ba | Sqft | Sold | Price | $/sf | Match |
|---|---|---|---|---|---|---|---|
| 5103 Avenue J | 0.00mi | 3/3.5 | 1,816 (0%) | 3mo | $399,900 | $220 | 97 |
| 5107 Avenue J | 0.00mi | 3/3.5 | 1,816 (0%) | 3mo | $369,900 | $204 | 97 |
| 5311 Avenue J | 0.07mi | 3/2.5 | 1,831 (+1%) | 4mo | $279,000 | $152 | 88 |
| 5005 Brady St | 0.28mi | 4/3.0 (+1) | 1,776 (-2%) | 0mo | $375,000 | $211 | 76 |
| 125 Eastwood St | 0.51mi | 3/3.5 | 1,856 (+2%) | 6mo | $399,700 | $215 | 67 |
| 137 Eastwood St | 0.58mi | 3/3.5 | 1,912 (+5%) | 1mo | $369,900 | $193 | 63 |
| 747 Dumble St | 0.73mi | 3/3.5 | 1,744 (-4%) | 2mo | $369,990 | $212 | 58 |
| 135 Eastwood St | 0.58mi | 3/3.5 | 1,914 (+5%) | 9mo | $389,700 | $204 | 57 |
| 703 Dumble St | 0.71mi | 3/2.0 | 1,801 (-1%) | 8mo | $500,000 | $278 | 52 |
| 127 Eastwood St | 0.56mi | 3/3.5 | 1,981 (+9%) | 8mo | $444,700 | $224 | 52 |
| 5258 Texas St | 0.59mi | 3/2.5 | 1,598 (-12%) | 8mo | $360,000 | $225 | 42 |
| 5011 Walker St | 0.75mi | 2/1.0 (-1) | 1,720 (-5%) | 2mo | $299,000 | $174 | 40 |
Match score weights: distance 35% · size 25% · config 20% · recency 20%. Top-matched comps best support the ARV.
Projected returns pro-forma
10.0% appreciation · 0.0% rent growth · sell at horizon
- IRR
- 18.6%
- Equity multiple
- 2.51×
- Total profit
- $156,180
- Equity at exit
- $333,235
- IRR
- 16.8%
- Equity multiple
- 5.60×
- Total profit
- $476,908
- Equity at exit
- $718,634
Cash invested: $103,572 (down + closing). Projections, not guarantees.
Landlord ↔ Tenant lean methodology
- Overall (STATE)
- 87 Strongly Landlord-Friendly
- State Texas
- 87 Strongly Landlord-Friendly · R+5
- County
- — inherits STATE
- City
- — inherits STATE
ZIP-level market 77011
- Home prices YoY
- 30.1%
- Rents YoY
- -2.9%
- Active inventory
- 161
- Price-to-rent
- 12.4×
Monthly cashflow live
- Estimated rent
- $2,480 high interval (Pro) →
- Mortgage (P&I)
- −$1,940
- Tax est. 1.5%
- −$462 /mo · $5,548/yr
- Insurance
- −$154
- HOA
- −$0
- Vacancy / Maint / Mgmt
- −$521
- Net cashflow
- $-597
Break-even live
UW: 25.0% down · 7.5% · 30yr · 1.5% tax · 5.0% vac · 8.0% maint · 8.0% mgmt
Financing live
Cash to close
- Down payment
- $92,475
- Closing costs
- $11,097
- Reserves months
- —
- Total cash needed
- —
Loan-product check · same deal, 3 products live
Conventional
25% down · 7.5% · 30yr
- Down + closing
- —
- Monthly P&I
- —
- Monthly cashflow
- —
- DSCR
- —
- Eligible?
- —
Personal DTI + credit; lowest rate.
DSCR
20% down · 8.5% · 30yr
- Down + closing
- —
- Monthly P&I
- —
- Monthly cashflow
- —
- DSCR
- —
- Eligible?
- —
No personal income docs; deal must DSCR.
Hard money
10% down · 12.0% · 12mo
- Down + closing
- —
- Monthly P&I
- —
- Monthly cashflow
- —
- DSCR
- —
- Eligible?
- —
Short-term bridge; refi at stabilization.
Rent comps 10 comps
| Address | Beds | Baths | Sqft | Rent | $/sqft | DOM | Units | Dist |
|---|---|---|---|---|---|---|---|---|
| 207 Edgewood St Houston, TX | 3.0 | 4.0 | 2577 | $3,250 | $1.26 | 43d | 1 | 0.36mi |
| 2 Jenkins St Houston, TX | 3.0 | 2.0 | 1242 | $2,250 | $1.81 | 43d | 1 | 0.59mi |
| 5502 Texas St Unit 1514806P Houston, TX | 3.0 | 2.5 | 1808 | $7,216 | $3.99 | 7d | 1 | 0.59mi |
| 5504 Texas St Unit 1514810P Houston, TX | 3.0 | 2.5 | 1808 | $7,026 | $3.89 | 3d | 1 | 0.60mi |
| 6403 Avenue C Unit 1019625P Houston, TX | 2.0–8.0 | 1.0–4.0 | 1232 | $3,466 | $2.81 | 2d | 2 | 0.80mi |
| 5121 Polk St Unit 1 Houston, TX | 2.0 | 1.0 | 1300 | $1,600 | $1.23 | 24d | 1 | 0.94mi |
| 4952 Polk St Unit 1531107P Houston, TX | 2.0 | 2.0 | 1980 | $2,327 | $1.18 | 7d | 1 | 0.96mi |
| 4001 Dallas St Unit 1029264P Houston, TX | 3.0 | 3.0 | 2174 | $5,077 | $2.34 | 5d | 1 | 1.23mi |
| 800 Middle St Houston, TX | 1.0–4.0 | 1.0–2.0 | 1003 | $1,593 | $1.59 | 5d | 1 | 1.26mi |
| 308 Grove St Houston, TX | 3.0 | 3.0 | 1701 | $2,350 | $1.38 | 7d | 1 | 1.48mi |
Listing history 18 events
-
2026-06-18days on market $369,900 Active 88 DOM
-
2026-06-17days on market $369,900 Active 87 DOM
-
2026-06-16days on market $369,900 Active 86 DOM
-
2026-06-15days on market $369,900 Active 85 DOM
-
2026-06-13days on market $369,900 Active 83 DOM
-
2026-06-10days on market $369,900 Active 79 DOM
-
2026-06-08days on market $369,900 Active 78 DOM
-
2026-06-07days on market $369,900 Active 77 DOM
-
2026-06-04days on market $369,900 Active 74 DOM
-
2026-06-01days on market $369,900 Active 71 DOM
-
2026-05-31days on market $369,900 Active 70 DOM
-
2026-04-19status Active 778-char remark
Show marketing remark (778 chars)
Experience modern city living in this stunning three-story new construction home located in the heart of vibrant EaDo. This 3-bedroom, 3-bath residence offers an open-concept layout with soaring ceilings, abundant natural light, and designer finishes throughout. The sleek kitchen features quartz countertops, and stainless steel appliances, perfect for entertaining. Each bedroom includes its own full bathroom, offering ultimate privacy and comfort—ideal for guests or roommates. The home also includes a two-car garage and no HOA. Located just minutes from Downtown, the East River Project, and local dining hotspots, this home blends urban convenience with upscale style. Don’t miss the opportunity to own in one of Houston’s fastest-growing neighborhoods!
-
2026-04-14status Pending 778-char remark
Show marketing remark (778 chars)
Experience modern city living in this stunning three-story new construction home located in the heart of vibrant EaDo. This 3-bedroom, 3-bath residence offers an open-concept layout with soaring ceilings, abundant natural light, and designer finishes throughout. The sleek kitchen features quartz countertops, and stainless steel appliances, perfect for entertaining. Each bedroom includes its own full bathroom, offering ultimate privacy and comfort—ideal for guests or roommates. The home also includes a two-car garage and no HOA. Located just minutes from Downtown, the East River Project, and local dining hotspots, this home blends urban convenience with upscale style. Don’t miss the opportunity to own in one of Houston’s fastest-growing neighborhoods!
-
2026-03-17$369,900 Active 778-char remark
Show marketing remark (778 chars)
Experience modern city living in this stunning three-story new construction home located in the heart of vibrant EaDo. This 3-bedroom, 3-bath residence offers an open-concept layout with soaring ceilings, abundant natural light, and designer finishes throughout. The sleek kitchen features quartz countertops, and stainless steel appliances, perfect for entertaining. Each bedroom includes its own full bathroom, offering ultimate privacy and comfort—ideal for guests or roommates. The home also includes a two-car garage and no HOA. Located just minutes from Downtown, the East River Project, and local dining hotspots, this home blends urban convenience with upscale style. Don’t miss the opportunity to own in one of Houston’s fastest-growing neighborhoods!
-
2026-01-12historical
-
2025-12-17historical $2,850
-
2025-11-14$2,850
-
2025-11-03$379,900 Active
ⓘ Source: listings_history table (triggers on properties + properties_extension) + one-shot
backfill from property_details.listing_events for pre-trigger history.
Nearby sold comps map
Loading sold comps map…
Walkable amenities ~0.75 mi
Loading nearby amenities…
Taxation est. · year 1
- Rental income
- $29,756
- − Mortgage interest
- −$20,720
- − Property taxes
- −$5,548
- − Insurance
- −$1,850
- − Repairs & maintenance
- −$2,380
- − Management
- −$2,380
- − Depreciation
- −$10,761
- Taxable loss
- −$13,884
- Est. tax savings @ 24.0%
- +$3,332
- After-tax cash flow
- $-3,836/yr
For passive investors: Depreciation is non-cash, so a rental often shows a tax loss while cash-flowing — sheltering income. Rental losses are passive: they offset passive income freely, and up to $25,000/yr can offset ordinary (W-2) income if you actively participate and your MAGI is under $100k (phasing out to $0 by $150k); unused losses carry forward. On sale, claimed depreciation is recaptured at up to 25%, and gains may owe capital-gains tax (a 1031 exchange can defer both). Figures are a year-1 estimate at your 24.0% rate — not tax advice; consult a CPA.
Condition & rehab AI · 12 photos
This modern, three-story new construction home in EaDo offers an open-concept layout with designer finishes and ample natural light. It is move-in ready with no visible repairs or maintenance needed, making it an excellent investment opportunity.
Value-add opportunities
- Both Landscaping improvements — Enhances curb appeal and adds value for both resale and rental.
- Both Smart home integration — Improves convenience and adds modern appeal, attracting more buyers and renters.
Renovation cost estimate screening
Value-add ROI direction
- Both Landscaping improvements — Enhances curb appeal and adds value for both resale and rental. ↑
- Both Smart home integration — Improves convenience and adds modern appeal, attracting more buyers and renters. ↑
ⓘ Cost ranges are severity-bucket heuristics (US national rule-of-thumb). Get contractor quotes + a written scope before underwriting a rehab budget.
Schools (NCES district)
- District
- Houston ISD
- NCES district ID
- 4823640
- Math proficiency
- 27% ▼ -18.00%
- Reading proficiency
- 35% ▼ -6.00%
- Median HH income
- $46,054
- Composite
- 26.63/100
- National rank
- #7173
- State rank
- #593 of 826 in TX
Livability — Houston
- Score
- 74/100
- State rank
- #184
- US rank
- #4771
Category grades
Schools grade is shown separately in the Schools card above.
Census & demographics
- Census place
- Houston, TX
- County
- Harris County · 4,702,590 people
- City population
- 3,226,434
- Metro
- Houston-The Woodlands-Sugar Land, TX
- Population (ZIP)
- 14,940
- Household income
- $50,133
- Rent vs Own
- Severe rent burden
- 655.0
Population outlook (Harris County) Hauer SSP2
- Today (2025)
- 5,571,493 people
- By 2030
- 6,089,821 · +9.3%
- By 2040
- 7,142,806 · +28.2%
- By 2050
- 8,185,864 · +46.9%
- By 2075
- 10,574,329 · +89.8%
- By 2100
- 12,109,958 · +117.4%
Race, ethnicity, and origin ACS 2023
- Neighborhood character
- Predominantly Hispanic (88%)
- Race & ethnicity
- Hispanic / Latino 88% Two or more races 29% White 7% Black 3%
- Hispanic origin (detail)
- Mexican 81%
- Foreign-born
- 33% · Canada
- Languages at home
- 24% English-only · Spanish 76%
Political lean MEDSL · Harris
- 2024 margin
- Lean D (+5.5) · D 52.0% · R 46.4% · Other 1.6%
- 2008→2024 swing
- +3.9pp toward D · 2008: 1.6pp · 2024: 5.5pp
- All cycles
- 2024: D+5.5 2020: D+13.3 2016: D+12.4 2012: D+0.1 2008: D+1.6
Not yet ingested
- Civics
- —
Market trends
- HPI YoY
- ▲ 68.18%
- Current HPI
- 295.1198
- Rent YoY
- ▼ -2.93%
- Metro
- Houston-The Woodlands-Sugar Land, TX
- State GDP YoY
- ▲ 3.95%
- F500 in state
- 110
Industry mix (Fortune 500 HQ in TX)
| Industry | F500 HQs | Revenue |
|---|---|---|
| Energy | 16 | $1,198B |
|
||
| Technology | 5 | $198B |
|
||
| Engineering / Construction | 4 | $72B |
|
||
| Energy Services | 3 | $60B |
|
||
| Utilities | 3 | $41B |
|
||
| Healthcare | 2 | $330B |
|
||
Price history
-2.6% since first listed7 events — show timeline
- 2026-04-19 Relisted — HARMLS
- 2026-04-14 Pending — HARMLS
- 2026-03-17 Listed $369,900 HARMLS
- 2026-01-12 Listing Removed — HARMLS
- 2025-12-17 Rental Removed $2,850 HARMLS
- 2025-11-14 Listed for Rent $2,850 HARMLS
- 2025-11-03 Listed $379,900 HARMLS
Cash-flow waterfall
monthlySold comps — $/sqft
last 12 mo · ≤1 miLoading sold comps…