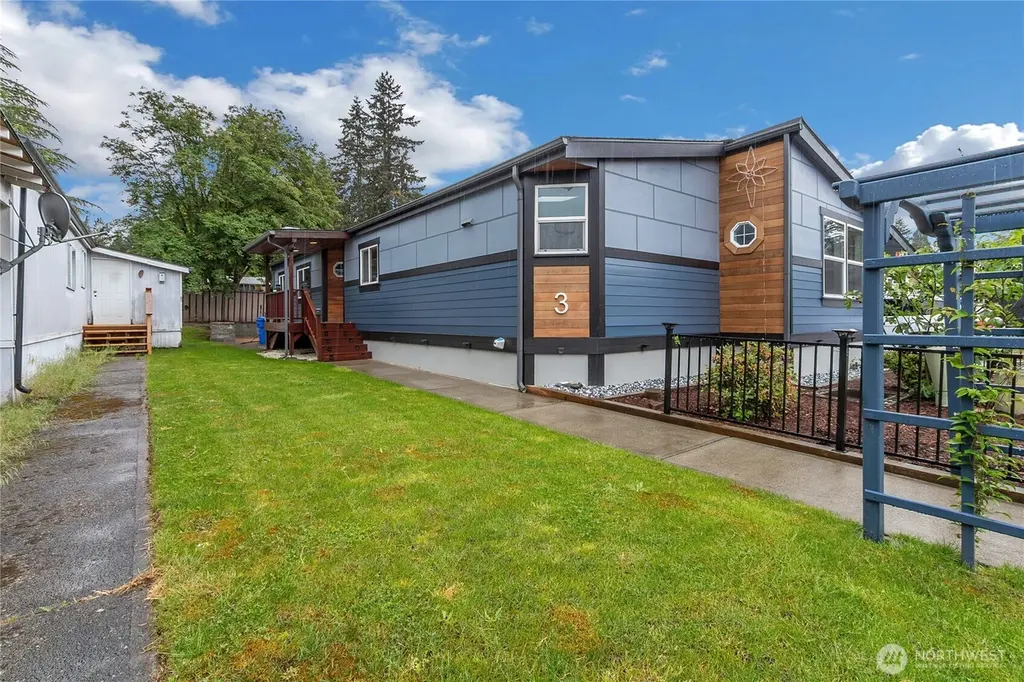
602 29th St SE #3 · Auburn, WA
Flood risk 1/10 · Minimal
- FEMA flood zone
- X (unshaded)
- Chance of flooding over 30 yrs
- 0.0%
- Est. flood insurance / yr
- $507 – $1,088
Fire risk 1/10 · Minimal
- Est. fire insurance / yr
- $604 – $1,122
Heat risk 3/10 · Minor
- Hot days now (above 87°F)
- 7 days/yr
- Hot days in 30 yrs
- 15 days/yr
Wind risk 1/10 · Minimal
- Chance of severe wind over 30 yrs
- —
Air-quality risk 7/10 · Major
- Unhealthy air days now
- 10 days/yr
- Unhealthy air days in 30 yrs
- 11 days/yr
Risk factors via First Street. Map © Google.
Why this score? — see what drove the C+ grade
The composite is a weighted blend of 9 inputs, each scored 0–100. Each bar is that input's sub-score; the figure is the points it added to the 100-point composite (weight × sub-score).
- Cash flow +25.3/30.0
- DSCR +8.3/10.0
- ARV discount +7.5/15.0
- 1% rule +6.6/10.0
- Schools +4.7/10.0
- Livability +4.0/5.0
- Condition / age +4.0/5.0
- Rent growth +2.9/5.0
- Appreciation +0.0/10.0
$249,900
🖨 Deal sheet 📄 Offer letter ✓ Due diligence
Listing remarks
Welcome home to Auburn Green Estates! This is ownership pride at its best. Very well-maintained manufactured home offers stunning 1680 sq/ft, 4 bedrooms, 2 bathrooms. Huge top-of-the-line quality kitchen with stainless steel appliances, 3-seems quartz countertops and backsplash, large breakfast island, and abundant cabinetry. Enjoy a bright and open floor plan with spacious living areas, ample natural light to the dining room & living room. Large main bedroom with a walk-in closet and a gorgeous bathroom with a quartz countertop vanity and shower wall tile. Built-in desk and cabinets were recently installed in the 4th bedroom, so you can choose to use it as an office or a bedroom. The
Key facts
- Quartz countertops
- Abundant cabinetry
- 2 parking spots
Tags
Property features AI
Finance
- Other: Bus line nearby
- Financial info: Accepts Cash and Conventional financing
- HOA & community: Located in Auburn Green MH Park (about 100 homes); Park amenities include common area, playground, recreational area; Pets allowed (cats and dogs); Park approved for sale; Land lease amount: $1,200
Exterior
- Parking: Carport; Uncovered parking
- Utilities: Electric power; Public water (included in park bill); Public sewer (included in park bill)
- Home design: Manufactured home (double wide); One story; North-facing; Model: 1989 60x28; Very good condition; Manufactured after 6/15/1976; Mobile home remains
- Construction: Cement construction materials; Composition roof; Concrete skirting; Tie-down foundation
- Exterior features: Cement/concrete exterior; Patio/porch/deck; Open space lot; Paved areas
Interior
- Kitchen: Refrigerator; Stove/Range; Garbage disposal
- Bedrooms: 4 bedrooms
- Flooring: Laminate; Vinyl plank; Carpet
- Bathrooms: 2 full bathrooms (2 tubs, 2 showers); Primary bath access
- Heating & cooling: Forced air heating; No central air
- Interior features: Water heater (tank) located in closet; Skylights; Ceiling fans; Double pane windows; Walk-in closet; Den/office, entry, family room, living room, kitchen with eating space, utility room
- Laundry & utility: Washer; Dryer; Utility room
Neighborhood map
What this means for you Summary
Snapshot
- This is a 4-bed/2.0-bath manufactured listed at $250k. Condition is rated good.
Deal economics
- At list price, monthly cash flow is $566 ($7k/yr) — positive.
- The deal already cash-flows at list — no discount required.
- Meets the 1% rule at list price ($3k rent vs $250k).
- Recommended offer: $246k (1.5% below list) — sets the bar for market timing.
- Cap rate 9.0% vs local median 2.7% in Auburn — top-decile yield for the area; either an underpriced asset or a hidden risk that comps aren't pricing in. Stress-test before assuming the spread holds.
Location & tenants
- Location reads 81/100 on livability (#75 in WA, #1,371 nationally) — a professional / high-income tenant draw. Strengths: amenities A+, commute A+, employment A+; Watch: crime F, cost of living F.
- Auburn School District (urban): math 47% / reading 56% proficiency, ranked #125 of 291 in WA (top 43%) — acceptable for families but not a draw, mixed tenant base, ~2y average lease.
- Market conditions: Rents rising (+1.5%/yr); 171 active listings in the ZIP; 3 comparable units currently listed for rent nearby; rentals leasing fast (median 11d on market — plan ~1-2 weeks tenant-placement turnaround); solid renter incomes; 10,555 units permitted in King County in 2024 (7,119 in 5+ unit buildings).
- This rent runs 44% of the median local income ($79k/yr) — at the standard rent-burdened threshold; future hikes will face affordability resistance.
Forward outlook
- Local home prices are declining (-3.0%/yr); year-one equity from $2k of loan paydown is wiped out by about $7k of value loss. Plan a longer hold.
- King County population projected at +44% by 2050 — long-run rental-demand tailwind backs the buy-and-hold thesis.
Negotiation context
- It's been on market 18 days — a 2% lower offer ($246k) is reasonable based on typical stale-listing flexibility.
Questions for the listing agent
- Is there a deadline driving the sale (1031 exchange, divorce, estate, relocation)? That informs how much negotiation room exists.
- Crime grade is F in this area — have there been break-ins, vandalism, or insurance claims at this property in the last 3 years? What carrier currently insures it and at what premium?
- What's the average days-on-market for RENTAL listings here right now (not sales)? A rising rental-DOM trend means longer vacancies and softer asking-rent achievability than the comps imply.
- What's the recent tenant-quality profile in this submarket — average credit score on applications, eviction rate, late-payment / NSF rate, and stable-employment percentage? A property-management company in the area should have these aggregated.
- How much new for-sale + rental construction is in the pipeline within 1–3 miles? Heavy new supply typically softens prices + rents 12–24 months out; constrained supply supports both.
Investment metrics
- 1% rule
- 1.16% ✓
- Cap rate
- 9.01%
- Cash-on-cash
- 9.71%
- DSCR
- 1.43
- GRM
- 7.2
CMA / ARV
- ARV (on-the-fly)
- $164,640
- Comps found
- 9
Show comp detail 9 sales within ~0.75 mi
| Address | Dist | Beds/Ba | Sqft | Sold | Price | $/sf | Match |
|---|---|---|---|---|---|---|---|
| 602 29th St SE #3 | 0.00mi | 4/2.0 | 1,680 (0%) | 0mo | $225,000 | $134 | 100 |
| 602 29th St SE #20 | 0.06mi | 4/2.0 | 1,512 (-10%) | 10mo | $183,000 | $121 | 73 |
| 900 29th St SE Unit E-1 | 0.16mi | 3/2.0 (-1) | 1,848 (+10%) | 3mo | $100,000 | $54 | 68 |
| 900 29th St SE Unit E-22 | 0.12mi | 3/2.0 (-1) | 1,440 (-14%) | 8mo | $50,000 | $35 | 59 |
| 707 37th St SE #17 | 0.35mi | 3/2.0 (-1) | 1,500 (-11%) | 4mo | $147,500 | $98 | 58 |
| 1106 29th St SE | 0.27mi | 3/2.0 (-1) | 1,848 (+10%) | 10mo | $502,000 | $272 | 57 |
| 707 37th St SE #71 | 0.35mi | 4/2.0 | 1,440 (-14%) | 6mo | $160,000 | $111 | 55 |
| 800 29th St SE Unit G16 | 0.13mi | 3/2.0 (-1) | 1,440 (-14%) | 23mo | $78,000 | $54 | 46 |
| 210 37th St SE #81 | 0.56mi | 3/2.0 (-1) | 1,848 (+10%) | 17mo | $116,000 | $63 | 38 |
Match score weights: distance 35% · size 25% · config 20% · recency 20%. Top-matched comps best support the ARV.
Projected returns pro-forma
-3.0% appreciation · 1.51% rent growth · sell at horizon
- IRR
- -3.4%
- Equity multiple
- 0.88×
- Total profit
- $-8,671
- Equity at exit
- $37,261
- IRR
- 4.6%
- Equity multiple
- 1.31×
- Total profit
- $21,993
- Equity at exit
- $21,607
Cash invested: $69,972 (down + closing). Projections, not guarantees.
Landlord ↔ Tenant lean methodology
- Overall (STATE)
- 28 Tenant-Leaning
- State Washington
- 28 Tenant-Leaning · D+8
- County
- — inherits STATE
- City
- — inherits STATE
ZIP-level market 98002
- Rents YoY
- 1.5%
- Active inventory
- 171
- Price-to-rent
- 7.2×
Monthly cashflow live
- Estimated rent
- $2,903 medium interval (Pro) →
- Mortgage (P&I)
- −$1,311
- Tax est. 1.5%
- −$312 /mo · $3,748/yr
- Insurance
- −$104
- HOA
- −$0
- Vacancy / Maint / Mgmt
- −$610
- Net cashflow
- $566
Break-even live
UW: 25.0% down · 7.5% · 30yr · 1.5% tax · 5.0% vac · 8.0% maint · 8.0% mgmt
Financing live
Cash to close
- Down payment
- $62,475
- Closing costs
- $7,497
- Reserves months
- —
- Total cash needed
- —
Loan-product check · same deal, 3 products live
Conventional
25% down · 7.5% · 30yr
- Down + closing
- —
- Monthly P&I
- —
- Monthly cashflow
- —
- DSCR
- —
- Eligible?
- —
Personal DTI + credit; lowest rate.
DSCR
20% down · 8.5% · 30yr
- Down + closing
- —
- Monthly P&I
- —
- Monthly cashflow
- —
- DSCR
- —
- Eligible?
- —
No personal income docs; deal must DSCR.
Hard money
10% down · 12.0% · 12mo
- Down + closing
- —
- Monthly P&I
- —
- Monthly cashflow
- —
- DSCR
- —
- Eligible?
- —
Short-term bridge; refi at stabilization.
Rent comps 3 comps
| Address | Beds | Baths | Sqft | Rent | $/sqft | DOM | Units | Dist |
|---|---|---|---|---|---|---|---|---|
| 1910 N Ct SE Auburn, WA | 3.0 | 2.0 | 1570 | $2,900 | $1.85 | 11d | 1 | 0.83mi |
| 4716 Mill Pond Dr SE Apt 1001 Auburn, WA | 3.0 | 2.5 | 1673 | $2,900 | $1.73 | 11d | 1 | 0.95mi |
| 102 Hawthorne Ave S Pacific, WA | 3.0 | 1.0 | 1285 | $2,950 | $2.30 | 2d | 1 | 1.39mi |
Listing history 4 events
-
2026-06-02status $249,900 Pending 18 DOM
-
2026-06-01days on market $249,900 Active 18 DOM
-
2026-05-31days on market $249,900 Active 17 DOM
-
2026-05-14$249,900 Active
ⓘ Source: listings_history table (triggers on properties + properties_extension) + one-shot
backfill from property_details.listing_events for pre-trigger history.
Climate risk First Street
- Flood 1/10 Low FEMA zone X (unshaded) · 0% chance over 30 yrs
- Wildfire 1/10 Low
- Heat 3/10 Moderate 7 d/yr ≥87°F today · 15 d/yr by 30 yrs out
- Wind 1/10 Low
- Air quality 7/10 Severe 10 unhealthy d/yr today · 11 by 30 yrs out
Nearby sold comps map
Loading sold comps map…
Walkable amenities ~0.75 mi
Loading nearby amenities…
Taxation est. · year 1
- Rental income
- $34,835
- − Mortgage interest
- −$13,998
- − Property taxes
- −$3,748
- − Insurance
- −$1,250
- − Repairs & maintenance
- −$2,787
- − Management
- −$2,787
- − Depreciation
- −$7,270
- Taxable income
- $2,995
- Est. tax owed @ 24.0%
- −$719
- After-tax cash flow
- $6,077/yr
For passive investors: Depreciation is non-cash, so a rental often shows a tax loss while cash-flowing — sheltering income. Rental losses are passive: they offset passive income freely, and up to $25,000/yr can offset ordinary (W-2) income if you actively participate and your MAGI is under $100k (phasing out to $0 by $150k); unused losses carry forward. On sale, claimed depreciation is recaptured at up to 25%, and gains may owe capital-gains tax (a 1031 exchange can defer both). Figures are a year-1 estimate at your 24.0% rate — not tax advice; consult a CPA.
Condition & rehab AI · 12 photos
This well-maintained, modern manufactured home in Auburn Green Estates is move-in ready with a good condition score and minimal repairs needed.
Value-add opportunities
- Both landscaping — enhances curb appeal and adds value
- Both exterior lighting — improves safety and enhances curb appeal
- Both smart home integration — increases home's marketability and convenience
Renovation cost estimate screening
Value-add ROI direction
- Both landscaping — enhances curb appeal and adds value ↑
- Both exterior lighting — improves safety and enhances curb appeal ↑
- Both smart home integration — increases home's marketability and convenience ↑
ⓘ Cost ranges are severity-bucket heuristics (US national rule-of-thumb). Get contractor quotes + a written scope before underwriting a rehab budget.
Schools (NCES district)
- District
- Auburn School District
- NCES district ID
- 5300300
- Math proficiency
- 47% ▼ -3.00%
- Reading proficiency
- 56% ▼ -1.00%
- Median HH income
- $58,048
- Composite
- 46.73/100
- National rank
- #5240
- State rank
- #125 of 291 in WA
Livability — Auburn
- Score
- 81/100
- State rank
- #75
- US rank
- #1371
Category grades
Schools grade is shown separately in the Schools card above.
Census & demographics
- Census place
- Auburn, WA
- County
- King County · 2,251,916 people
- City population
- 74,969
- Metro
- Seattle-Tacoma-Bellevue, WA
- Population (ZIP)
- 37,509
- Household income
- $78,684
- Rent vs Own
- Severe rent burden
- 2202.0
Population outlook (King County) Hauer SSP2
- Today (2025)
- 2,576,485 people
- By 2030
- 2,803,316 · +8.8%
- By 2040
- 3,255,921 · +26.4%
- By 2050
- 3,706,444 · +43.9%
- By 2075
- 4,746,063 · +84.2%
- By 2100
- 5,407,730 · +109.9%
Race, ethnicity, and origin ACS 2023
- Neighborhood character
- Highly diverse neighborhood (Simpson 0.72)
- Race & ethnicity
- White 46% Hispanic / Latino 24% Two or more races 13% Black 12% Asian 6% Pacific Islander 4% Native American 2%
- Hispanic origin (detail)
- Mexican 20%
- Common ancestry
- Portuguese 4% Subsaharan African 4% Lithuanian 3%
- Foreign-born
- 24% · Canada, Vietnam
- Languages at home
- 63% English-only · Spanish 19% Russian/Polish/Slavic 6% Other Asian/Pacific 3%
Political lean MEDSL · King
- 2024 margin
- Solid D (+51.7) · D 74.2% · R 22.5% · Other 3.4%
- 2008→2024 swing
- +9.6pp toward D · 2008: 42.1pp · 2024: 51.7pp
- All cycles
- 2024: D+51.7 2020: D+52.7 2016: D+50.4 2012: D+39.9 2008: D+42.1
Not yet ingested
- Civics
- —
Market trends
- HPI YoY
- ▼ -677.96%
- Current HPI
- 298.0849
- Rent YoY
- ▲ 1.51%
- Metro
- Seattle-Tacoma-Bellevue, WA
- State GDP YoY
- ▲ 4.65%
- F500 in state
- 22
Industry mix (Fortune 500 HQ in WA)
| Industry | F500 HQs | Revenue |
|---|---|---|
| Retail | 2 | $269B |
|
||
| Technology / Retail | 1 | $638B |
|
||
| Technology | 1 | $245B |
|
||
| Telecommunications | 1 | $38B |
|
||
| Food / Beverage | 1 | $36B |
|
||
| Automotive / Trucks | 1 | $34B |
|
||
Price history
1 event — show timeline
- 2026-05-14 Listed $249,900 NWMLS as Distributed by MLS Grid
Cash-flow waterfall
monthlySold comps — $/sqft
last 12 mo · ≤1 miLoading sold comps…