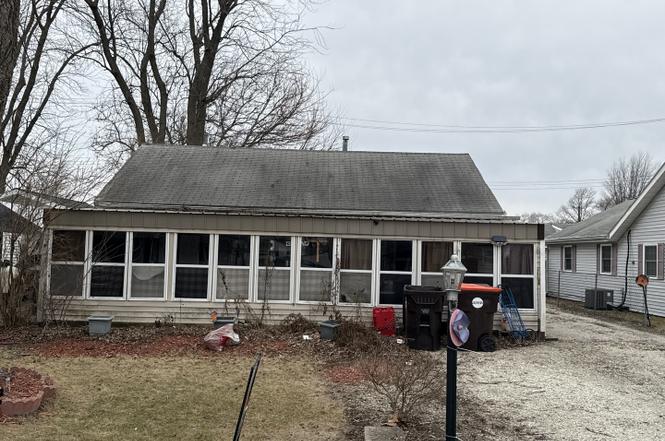
412 Sherwood Dr · Rantoul, IL
Flood risk 6/10 · Moderate
- FEMA flood zone
- X (unshaded)
- Chance of flooding over 30 yrs
- 0.73%
- Est. flood insurance / yr
- $507 – $1,088
Fire risk 1/10 · Minimal
- Est. fire insurance / yr
- $804 – $1,492
Heat risk 3/10 · Minor
- Hot days now (above 104°F)
- 7 days/yr
- Hot days in 30 yrs
- 18 days/yr
Wind risk 2/10 · Minimal
- Chance of severe wind over 30 yrs
- 1.0%
Air-quality risk 2/10 · Minimal
- Unhealthy air days now
- 0 days/yr
- Unhealthy air days in 30 yrs
- 1 days/yr
Risk factors via First Street. Map © Google.
Why this score? — see what drove the B+ grade
The composite is a weighted blend of 9 inputs, each scored 0–100. Each bar is that input's sub-score; the figure is the points it added to the 100-point composite (weight × sub-score).
- Cash flow +30.0/30.0
- 1% rule +10.0/10.0
- DSCR +10.0/10.0
- Appreciation +10.0/10.0
- ARV discount +7.5/15.0
- Rent growth +4.1/5.0
- Livability +3.4/5.0
- Condition / age +2.5/5.0
- Schools +1.2/10.0
$49,900
🖨 Deal sheet 📄 Offer letter ✓ Due diligence
Key facts
- Garage
- Built 1950
Neighborhood map
What this means for you Summary
Snapshot
- This is a 2-bed/1.0-bath other listed at $50k.
Deal economics
- At list price, monthly cash flow is $200 ($2k/yr) — positive.
- The deal already cash-flows at list — no discount required.
- Meets the 1% rule at list price ($773 rent vs $50k).
- Cap rate 11.1% vs local median 4.3% in Rantoul — top-decile yield for the area; either an underpriced asset or a hidden risk that comps aren't pricing in. Stress-test before assuming the spread holds.
Location & tenants
- Location reads 67/100 on livability (#533 in IL) — a middle-class / working-renter tenant base. Strengths: cost of living A+, housing A+, health & safety B; Watch: employment D, schools F, crime F.
- Rantoul Township Hsd 193 (town): math 10% / reading 10% proficiency, ranked #824 of 919 in IL (top 90%) — low school quality limits family demand, transient renter base, plan for 1-2y turnover.
- Market conditions: Rents rising fast (+6.6%/yr); 53 active listings in the ZIP; 10 comparable units currently listed for rent nearby; rentals leasing fast (median 14d on market — plan ~1-2 weeks tenant-placement turnaround); 573 units permitted in Champaign County in 2024 (359 in 5+ unit buildings).
Forward outlook
- In year one you build about $5k of equity ($345 loan paydown + $5k appreciation (10.0% local appreciation)).
- Champaign County population projected at +15% by 2050 — modest demand growth; plan on rents tracking national, not racing it.
- At projected returns (10.0% appreciation + 6.6% rent growth), your $14k cash investment doubles in ~2 years — after that, you're playing with house money.
- By year 6, paydown + projected appreciation supports a ~$31k cash-out refi (75% LTV) — recoverable capital for the next deal without selling this one.
Negotiation context
- Only 1 days on market — expect competitive offers; lowballing is unlikely to land.
Risks & watch-outs
- Watch-outs: property tax is 3.1% of price; built in 1950 — expect roof / HVAC / electrical / plumbing capex.
- Climate carrying-cost: major flood risk — expect insurance premiums to compound above CPI over the hold.
Questions for the listing agent
- Built in 1950 — when were the roof, HVAC, electrical panel, plumbing, and water heater last replaced?
- Property tax is high relative to price — has the assessment been appealed recently, and will the sale trigger a re-assessment?
- Is there a deadline driving the sale (1031 exchange, divorce, estate, relocation)? That informs how much negotiation room exists.
- Schools are F-rated, which usually means shorter tenancies and higher turnover. Who's the typical renter profile here, and what's been the actual vacancy rate?
- Crime grade is F in this area — have there been break-ins, vandalism, or insurance claims at this property in the last 3 years? What carrier currently insures it and at what premium?
- What's the average days-on-market for RENTAL listings here right now (not sales)? A rising rental-DOM trend means longer vacancies and softer asking-rent achievability than the comps imply.
- What's the recent tenant-quality profile in this submarket — average credit score on applications, eviction rate, late-payment / NSF rate, and stable-employment percentage? A property-management company in the area should have these aggregated.
- How much new for-sale + rental construction is in the pipeline within 1–3 miles? Heavy new supply typically softens prices + rents 12–24 months out; constrained supply supports both.
Investment metrics
- 1% rule
- 1.55% ✓
- Cap rate
- 11.10%
- Cash-on-cash
- 17.15%
- DSCR
- 1.76
- GRM
- 5.4
CMA / ARV
No comps found within radius.
Projected returns pro-forma
10.0% appreciation · 6.56% rent growth · sell at horizon
- IRR
- 39.1%
- Equity multiple
- 4.06×
- Total profit
- $42,817
- Equity at exit
- $44,954
- IRR
- 35.2%
- Equity multiple
- 9.80×
- Total profit
- $122,903
- Equity at exit
- $96,945
Cash invested: $13,972 (down + closing). Projections, not guarantees.
Landlord ↔ Tenant lean methodology
- Overall (STATE)
- 43 Moderately Tenant-Leaning
- State Illinois
- 43 Moderately Tenant-Leaning · D+7
- County
- — inherits STATE
- City
- — inherits STATE
ZIP-level market 61866
- Home prices YoY
- 10.8%
- Rents YoY
- 6.6%
- Active inventory
- 53
- Price-to-rent
- 5.4×
Monthly cashflow live
- Estimated rent
- $773 high interval (Pro) →
- Mortgage (P&I)
- −$262
- Tax from tax record
- −$128 /mo · $1,541/yr
- Insurance
- −$21
- HOA
- −$0
- Vacancy / Maint / Mgmt
- −$162
- Net cashflow
- $200
Break-even live
UW: 25.0% down · 7.5% · 30yr · 1.5% tax · 5.0% vac · 8.0% maint · 8.0% mgmt
Financing live
Cash to close
- Down payment
- $12,475
- Closing costs
- $1,497
- Reserves months
- —
- Total cash needed
- —
Loan-product check · same deal, 3 products live
Conventional
25% down · 7.5% · 30yr
- Down + closing
- —
- Monthly P&I
- —
- Monthly cashflow
- —
- DSCR
- —
- Eligible?
- —
Personal DTI + credit; lowest rate.
DSCR
20% down · 8.5% · 30yr
- Down + closing
- —
- Monthly P&I
- —
- Monthly cashflow
- —
- DSCR
- —
- Eligible?
- —
No personal income docs; deal must DSCR.
Hard money
10% down · 12.0% · 12mo
- Down + closing
- —
- Monthly P&I
- —
- Monthly cashflow
- —
- DSCR
- —
- Eligible?
- —
Short-term bridge; refi at stabilization.
Rent comps 10 comps
| Address | Beds | Baths | Sqft | Rent | $/sqft | DOM | Units | Dist |
|---|---|---|---|---|---|---|---|---|
| 603 S Maplewood Dr Unit 6031-MW Rantoul, IL | 2.0 | 1.0 | 675 | $785 | $1.16 | 21d | 1 | 0.19mi |
| 620 Willow Pond Rd Rantoul, IL | 2.0–4.0 | 1.5–2.5 | 1320 | $765 | $0.58 | 2d | 7 | 0.47mi |
| 909 N Maplewood Dr Rantoul, IL | 2.0–3.0 | 1.0 | 950 | $718 | $0.76 | 2d | 8 | 0.81mi |
| 54 Mahoning Ave Unit 54 Rantoul, IL | 3.0 | 1.0 | 960 | $1,100 | $1.15 | 13d | 1 | 0.81mi |
| 40 Mahoning Ave Rantoul, IL | 2.0 | 1.0 | 700 | $425 | $0.61 | 2d | 1 | 0.84mi |
| 418 N High St Rantoul, IL | 2.0 | 1.0 | 650 | $775 | $1.19 | 13d | 1 | 0.92mi |
| 335 E Campbell Ave Unit C Rantoul, IL | 1.0 | 1.0 | 1100 | $650 | $0.59 | 21d | 1 | 0.97mi |
| 1505 Hobson Dr Rantoul, IL | 1.0–3.0 | 1.0–1.5 | 925 | $845 | $0.91 | 2d | 7 | 1.20mi |
| 113 W Campbell Ave Unit C Rantoul, IL | 1.0 | 1.0 | 600 | $615 | $1.02 | 13d | 1 | 1.21mi |
| 355 North Dr Unit 355-06 Rantoul, IL | 2.0 | 1.0 | 600 | $750 | $1.25 | 13d | 1 | 1.23mi |
Listing history 2 events
-
2026-05-08status Pending
-
2026-04-09historical
ⓘ Source: listings_history table (triggers on properties + properties_extension) + one-shot
backfill from property_details.listing_events for pre-trigger history.
Tax reassessment forecast IL · Partial reset (capped growth)
- Current annual tax
- $1,541 · $128/mo
- Projected year-2 tax
- $1,541 · $128/mo
- Expected delta
- $0/yr ($0/mo · 0.0%)
ⓘ Screening estimate from a state-policy table — verify with the county assessor before closing.
Climate risk First Street
- Flood 6/10 Major FEMA zone X (unshaded) · 73% chance over 30 yrs
- Wildfire 1/10 Low
- Heat 3/10 Moderate 7 d/yr ≥104°F today · 18 d/yr by 30 yrs out
- Wind 2/10 Low 100% chance of damaging wind over 30 yrs
- Air quality 2/10 Low 0 unhealthy d/yr today · 1 by 30 yrs out
Nearby sold comps map
Loading sold comps map…
Walkable amenities ~0.75 mi
Loading nearby amenities…
Taxation est. · year 1
- Rental income
- $9,275
- − Mortgage interest
- −$2,795
- − Property taxes
- −$1,541
- − Insurance
- −$250
- − Repairs & maintenance
- −$742
- − Management
- −$742
- − Depreciation
- −$1,452
- Taxable income
- $1,754
- Est. tax owed @ 24.0%
- −$421
- After-tax cash flow
- $1,976/yr
For passive investors: Depreciation is non-cash, so a rental often shows a tax loss while cash-flowing — sheltering income. Rental losses are passive: they offset passive income freely, and up to $25,000/yr can offset ordinary (W-2) income if you actively participate and your MAGI is under $100k (phasing out to $0 by $150k); unused losses carry forward. On sale, claimed depreciation is recaptured at up to 25%, and gains may owe capital-gains tax (a 1031 exchange can defer both). Figures are a year-1 estimate at your 24.0% rate — not tax advice; consult a CPA.
Schools (NCES district)
- District
- Rantoul Township Hsd 193
- NCES district ID
- 1733240
- Math proficiency
- 10% ▼ -5.00%
- Reading proficiency
- 10% ▬ 0.00%
- Median HH income
- $38,128
- Composite
- 12.14/100
- National rank
- #14582
- State rank
- #824 of 919 in IL
Livability — Rantoul
- Score
- 67/100
- State rank
- #533
- US rank
- #11081
Category grades
Schools grade is shown separately in the Schools card above.
Census & demographics
- Census place
- Rantoul, IL
- County
- Champaign County · 182,148 people
- City population
- 13,470
- Metro
- Champaign-Urbana, IL
- Population (ZIP)
- 13,470
- Household income
- $50,686
- Rent vs Own
- Severe rent burden
- 281.0
Population outlook (Champaign County) Hauer SSP2
- Today (2025)
- 223,848 people
- By 2030
- 231,416 · +3.4%
- By 2040
- 244,321 · +9.1%
- By 2050
- 256,432 · +14.6%
- By 2075
- 285,823 · +27.7%
- By 2100
- 296,406 · +32.4%
Race, ethnicity, and origin ACS 2023
- Neighborhood character
- Diverse neighborhood (Simpson 0.69)
- Race & ethnicity
- White 48% Two or more races 23% Hispanic / Latino 21% Black 20%
- Hispanic origin (detail)
- Mexican 16% Puerto Rican 3%
- Common ancestry
- Romanian 1% Iranian 1% Slovak 1%
- Foreign-born
- 9% · Canada, Jamaica
- Languages at home
- 84% English-only · Spanish 14% Russian/Polish/Slavic 1%
Political lean MEDSL · Champaign
- 2024 margin
- Strong D (+24.1) · D 61.3% · R 37.2% · Other 1.5%
- 2008→2024 swing
- +6.6pp toward D · 2008: 17.5pp · 2024: 24.1pp
- All cycles
- 2024: D+24.1 2020: D+22.8 2016: D+18.4 2012: D+6.8 2008: D+17.5
Not yet ingested
- Civics
- —
Market trends
- HPI YoY
- ▲ 26.49%
- Current HPI
- 272.2527
- Rent YoY
- ▲ 6.56%
- Metro
- Champaign-Urbana, IL
- State GDP YoY
- ▲ 1.59%
- F500 in state
- 60
Industry mix (Fortune 500 HQ in IL)
| Industry | F500 HQs | Revenue |
|---|---|---|
| Insurance | 4 | $201B |
|
||
| Consumer Goods | 4 | $87B |
|
||
| Industrial Machinery | 3 | $64B |
|
||
| Healthcare | 2 | $55B |
|
||
| Retail / Pharmacy | 1 | $148B |
|
||
| Agriculture / Food | 1 | $86B |
|
||
Property tax history
-0.4%/yrLatest (2024): $1,541 · +10.5% YoY. Source: county tax records.
Cash-flow waterfall
monthlySold comps — $/sqft
last 12 mo · ≤1 miLoading sold comps…