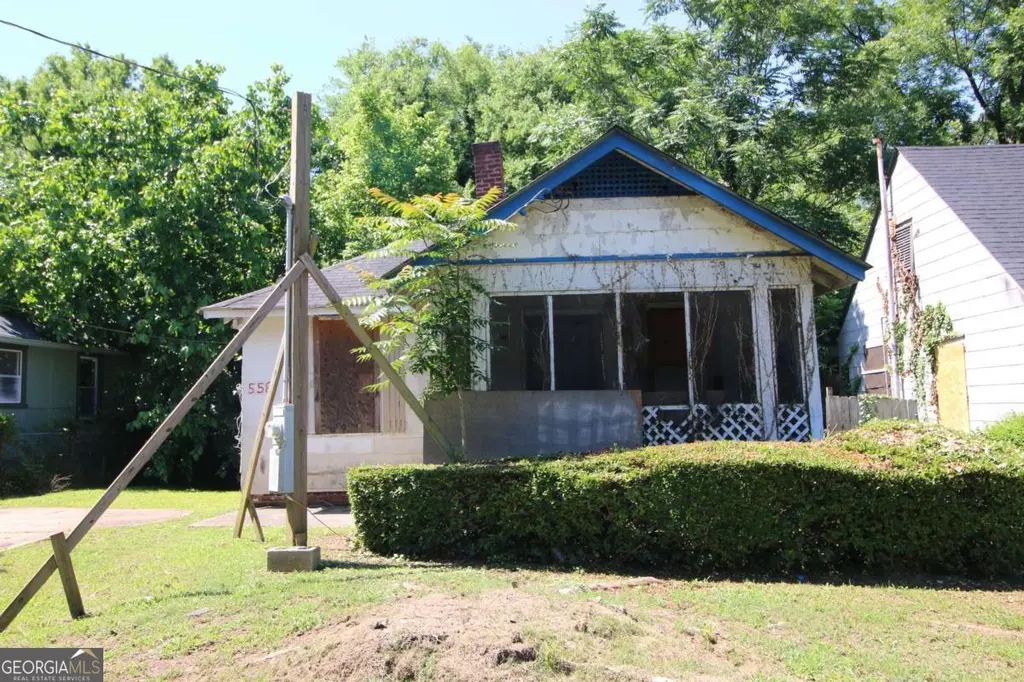
558 Fletcher St SW · Atlanta, GA
Flood risk 1/10 · Minimal
- FEMA flood zone
- X (unshaded)
- Chance of flooding over 30 yrs
- 0.0%
- Est. flood insurance / yr
- $473 – $860
Fire risk 1/10 · Minimal
- Est. fire insurance / yr
- $963 – $1,789
Heat risk 5/10 · Moderate
- Hot days now (above 104°F)
- 7 days/yr
- Hot days in 30 yrs
- 16 days/yr
Wind risk 4/10 · Minor
- Chance of severe wind over 30 yrs
- 22.0%
Air-quality risk 4/10 · Minor
- Unhealthy air days now
- 4 days/yr
- Unhealthy air days in 30 yrs
- 6 days/yr
Risk factors via First Street. Map © Google.
Why this score? — see what drove the B grade
The composite is a weighted blend of 9 inputs, each scored 0–100. Each bar is that input's sub-score; the figure is the points it added to the 100-point composite (weight × sub-score).
- Cash flow +30.0/30.0
- 1% rule +10.0/10.0
- DSCR +10.0/10.0
- ARV discount +7.5/15.0
- Livability +4.2/5.0
- Rent growth +3.2/5.0
- Schools +2.7/10.0
- Condition / age +2.5/5.0
- Appreciation +0.0/10.0
$99,000
🖨 Deal sheet 📄 Offer letter ✓ Due diligence
Listing remarks MLS
Investor opportunity!!!! This classic bungalow is ready for a full renovation and offers strong potential for a fix and flip, rental, or long term hold. The home features a covered front porch, original hardwood floors, fireplace, and tons of character throughout. Located in a growing Pittsburgh, this property is within walking distance to Pittsburgh Yards, the Atlanta BeltLine Southside Trail, Lee + White, Adair Park, and other nearby redevelopment. It is also just a short drive to Summerhill, Downtown Atlanta, Mercedes Benz Stadium, Georgia State, Hartsfield Jackson Atlanta International Airport, I 75/85, and I 20. Property needs a full renovation and is being sold as is.
Key facts
- Covered front porch
- Fireplace
- 6,372 sq ft lot
Tags
Property features AI
Exterior
- Parking: Driveway with open parking
- Utilities: Public water; Public sewer
- Home design: One-level home; Fixer condition
- Construction: Composition roof; Block foundation; Construction materials: Other; Built with above-grade finished area reported
- Exterior features: Enclosed patio/porch; Front porch; Paved city street frontage; Near Beltline, public transport, schools, and trails/greenway
Interior
- Kitchen: Kitchen appliances: Other
- Bedrooms: Two main-level bedrooms
- Flooring: Hardwood floors
- Bathrooms: One full bathroom (main level)
- Interior features: Crown molding; Double-sided fireplace (1)
- Laundry & utility: Laundry located in the kitchen
Neighborhood map
What this means for you Summary
Snapshot
- This is a 3-bed/1.0-bath single-family listed at $99k.
Deal economics
- At list price, monthly cash flow is $1k ($12k/yr) — positive.
- The deal already cash-flows at list — no discount required.
- Meets the 1% rule at list price ($2k rent vs $99k).
- Cap rate 18.8% vs local median 3.1% in Atlanta — top-decile yield for the area; either an underpriced asset or a hidden risk that comps aren't pricing in. Stress-test before assuming the spread holds.
Location & tenants
- Location reads 83/100 on livability (#6 in GA, #919 nationally) — a professional / high-income tenant draw. Strengths: amenities A+, commute A+, housing A+; Watch: cost of living C-.
- Atlanta Public Schools (urban): math 28% / reading 35% proficiency, ranked #80 of 174 in GA (top 46%) — families likely to look elsewhere, expect single-tenant / working-renter base with shorter leases; 71% free/reduced lunch — lower-income household profile, screen leases tightly.
- Zoned schools: Charles L. Gideons Elementary School (math 2% / reading 8%, grade F, #1,160 of 1,228 statewide, top 98%, 343 students, 100% FRL); Sylvan Hills Middle School (math 5% / reading 12%, grade F, #439 of 470 statewide, top 94%, 445 students, 100% FRL) — zoned schools average 100% FRL vs 71% district-wide (29 pts higher); higher-poverty schools than district average — tighter screening recommended.
- Zoned-school proficiency averages 7% at this address vs 32% district-wide (-25 pts) — the specific schools serving this property underperform the Atlanta Public Schools average; the district grade overstates school quality for this exact location.
- Market conditions: Rents rising (+2.8%/yr); 452 active listings in the ZIP; 40 comparable units currently listed for rent nearby; rentals at typical pace (median 24d on market — plan ~3-4 weeks tenant-placement turnaround); 11,565 units permitted in Fulton County in 2024 (8,159 in 5+ unit buildings).
Forward outlook
- Local home prices are declining (-3.0%/yr); year-one equity from $684 of loan paydown is wiped out by about $3k of value loss. Plan a longer hold.
- Fulton County population projected at +38% by 2050 — long-run rental-demand tailwind backs the buy-and-hold thesis.
- At projected returns (-3.0% appreciation + 2.8% rent growth), your $28k cash investment doubles in ~3 years — after that, you're playing with house money.
Negotiation context
- Only 14 days on market — expect competitive offers; lowballing is unlikely to land.
- 3 sale attempts since 16y ago with the ask held roughly flat each time — persistent listings suggest the price (not the market) is what's stuck; bring a comps-based counter.
- Current owner paid $12k; list at $99k implies a 732% gain — meaningful room to come down on a strong offer.
Risks & watch-outs
- Watch-outs: built in 1930 — expect roof / HVAC / electrical / plumbing capex.
- Climate carrying-cost: extreme-heat days projected 7→16/yr by 2055 (HVAC capex compounding) — expect insurance premiums to compound above CPI over the hold.
Questions for the listing agent
- Built in 1930 — when were the roof, HVAC, electrical panel, plumbing, and water heater last replaced?
- Is there a deadline driving the sale (1031 exchange, divorce, estate, relocation)? That informs how much negotiation room exists.
- What's the average days-on-market for RENTAL listings here right now (not sales)? A rising rental-DOM trend means longer vacancies and softer asking-rent achievability than the comps imply.
- What's the recent tenant-quality profile in this submarket — average credit score on applications, eviction rate, late-payment / NSF rate, and stable-employment percentage? A property-management company in the area should have these aggregated.
- How much new for-sale + rental construction is in the pipeline within 1–3 miles? Heavy new supply typically softens prices + rents 12–24 months out; constrained supply supports both.
Investment metrics
- 1% rule
- 2.28% ✓
- Cap rate
- 18.80%
- Cash-on-cash
- 44.68%
- DSCR
- 2.99
- GRM
- 3.7
CMA / ARV
- ARV (on-the-fly)
- $204,880
- Comps found
- 12
Show comp detail 12 sales within ~0.75 mi
| Address | Dist | Beds/Ba | Sqft | Sold | Price | $/sf | Match |
|---|---|---|---|---|---|---|---|
| 505 Dunbar St SW | 0.20mi | 3/2.0 | 1,055 (+1%) | 8mo | $208,000 | $197 | 77 |
| 1143 Windsor St SW | 0.44mi | 3/1.0 | 1,008 (-3%) | 2mo | $99,000 | $98 | 73 |
| 997 Ira St SW | 0.36mi | 3/2.0 | 1,014 (-2%) | 4mo | $109,000 | $107 | 72 |
| 1090 Ira St SW | 0.36mi | 2/1.0 (-1) | 1,008 (-3%) | 8mo | $99,999 | $99 | 66 |
| 530 Erin Ave SW | 0.42mi | 3/2.0 | 1,010 (-3%) | 7mo | $299,900 | $297 | 66 |
| 1180 Garibaldi St SW | 0.45mi | 3/2.0 | 1,085 (+4%) | 6mo | $243,000 | $224 | 63 |
| 953 Garibaldi St SW | 0.44mi | 3/2.0 | 1,003 (-4%) | 8mo | $265,000 | $264 | 63 |
| 519 Roy St SW | 0.11mi | 3/2.0 | 1,176 (+13%) | 10mo | $200,000 | $170 | 61 |
| 1056 Welch St SW | 0.09mi | 2/2.5 (-1) | 1,189 (+14%) | 5mo | $145,000 | $122 | 57 |
| 749 Bonnie Brae Ave SW | 0.50mi | 3/2.0 | 1,141 (+10%) | 1mo | $364,251 | $319 | 56 |
| 490 Rockwell St SW | 0.45mi | 2/2.0 (-1) | 936 (-10%) | 2mo | $179,900 | $192 | 52 |
| 400 Bass St SW | 0.74mi | 3/2.0 | 1,080 (+4%) | 11mo | $240,000 | $222 | 46 |
Match score weights: distance 35% · size 25% · config 20% · recency 20%. Top-matched comps best support the ARV.
Projected returns pro-forma
-3.0% appreciation · 2.77% rent growth · sell at horizon
- IRR
- 41.5%
- Equity multiple
- 2.78×
- Total profit
- $49,253
- Equity at exit
- $14,761
- IRR
- 47.6%
- Equity multiple
- 5.54×
- Total profit
- $125,715
- Equity at exit
- $8,560
Cash invested: $27,720 (down + closing). Projections, not guarantees.
Landlord ↔ Tenant lean methodology
- Overall (STATE)
- 90 Strongly Landlord-Friendly
- State Georgia
- 90 Strongly Landlord-Friendly · R+3
- County
- — inherits STATE
- City
- — inherits STATE
ZIP-level market 30310
- Home prices YoY
- -32.8%
- Rents YoY
- 2.8%
- Active inventory
- 452
- Price-to-rent
- 3.7×
Monthly cashflow live
- Estimated rent
- $2,254 high interval (Pro) →
- Mortgage (P&I)
- −$519
- Tax from tax record
- −$188 /mo · $2,252/yr
- Insurance
- −$41
- HOA
- −$0
- Vacancy / Maint / Mgmt
- −$473
- Net cashflow
- $1,032
Break-even live
UW: 25.0% down · 7.5% · 30yr · 1.5% tax · 5.0% vac · 8.0% maint · 8.0% mgmt
Financing live
Cash to close
- Down payment
- $24,750
- Closing costs
- $2,970
- Reserves months
- —
- Total cash needed
- —
Loan-product check · same deal, 3 products live
Conventional
25% down · 7.5% · 30yr
- Down + closing
- —
- Monthly P&I
- —
- Monthly cashflow
- —
- DSCR
- —
- Eligible?
- —
Personal DTI + credit; lowest rate.
DSCR
20% down · 8.5% · 30yr
- Down + closing
- —
- Monthly P&I
- —
- Monthly cashflow
- —
- DSCR
- —
- Eligible?
- —
No personal income docs; deal must DSCR.
Hard money
10% down · 12.0% · 12mo
- Down + closing
- —
- Monthly P&I
- —
- Monthly cashflow
- —
- DSCR
- —
- Eligible?
- —
Short-term bridge; refi at stabilization.
Rent comps 40 comps
| Address | Beds | Baths | Sqft | Rent | $/sqft | DOM | Units | Dist |
|---|---|---|---|---|---|---|---|---|
| 600 Mayland Ave SW Atlanta, GA | 3.0 | 2.0 | 1100 | $2,300 | $2.09 | 24d | 1 | 0.12mi |
| 1133 Mayland Cir SW Atlanta, GA | 3.0 | 2.0 | 1120 | $3,600 | $3.21 | 24d | 1 | 0.14mi |
| 1135 Coleman St SW Atlanta, GA | 3.0 | 2.5 | 1353 | $1,795 | $1.33 | 24d | 1 | 0.17mi |
| 706 Catherine St SW Atlanta, GA | 3.0 | 2.0 | 1352 | $2,200 | $1.63 | 7d | 1 | 0.27mi |
| 1180 Sims St SW Atlanta, GA | 2.0 | 1.0 | 772 | $1,100 | $1.42 | 24d | 1 | 0.28mi |
| 564 Hope St SW Unit A Atlanta, GA | 4.0 | 2.0 | 1188 | $2,300 | $1.94 | 24d | 1 | 0.30mi |
| 1040 Smith St SW Atlanta, GA | 3.0 | 2.5 | 1500 | $1,595 | $1.06 | 24d | 1 | 0.31mi |
| 1187 McDaniel St SW Unit B Atlanta, GA | 2.0 | 1.0 | 1038 | $1,025 | $0.99 | 11d | 1 | 0.34mi |
| 1048 Garibaldi St SW Atlanta, GA | 2.0 | 2.0 | 1280 | $2,150 | $1.68 | 24d | 1 | 0.40mi |
| 547 Erin Ave SW Atlanta, GA | 3.0 | 2.0 | 1400 | $5,000 | $3.57 | 1d | 1 | 0.43mi |
| 547 Erin Ave SW Atlanta, GA | 3.0 | 2.0 | 1394 | $2,600 | $1.87 | 24d | 1 | 0.43mi |
| 518 Erin Ave SW Atlanta, GA | 2.0 | 1.0 | 1075 | $2,500 | $2.33 | 17d | 1 | 0.46mi |
| 1246 Allene Ave SW Atlanta, GA | 2.0 | 1.0–2.0 | 896 | $2,110 | $2.35 | 1d | 23 | 0.46mi |
| 840 Smith St SW Unit A Atlanta, GA | 2.0 | 1.5 | 910 | $1,550 | $1.70 | 16d | 1 | 0.52mi |
| 906 Allene Ave SW Atlanta, GA | 3.0 | 2.0 | 1500 | $3,500 | $2.33 | 22d | 1 | 0.53mi |
| 827 Elbert St SW Atlanta, GA | 3.0 | 2.0 | 1300 | $2,900 | $2.23 | 24d | 1 | 0.53mi |
| 776 Metropolitan Pkwy SW Atlanta, GA | 2.0–3.0 | 2.0–3.0 | 1212 | $2,410 | $1.99 | 1d | 6 | 0.54mi |
| 806 Murphy Ave SW Atlanta, GA | 1.0–2.0 | 1.0 | 825 | $1,254 | $1.52 | 24d | 8 | 0.63mi |
| 549 Lynnhaven Dr SW Atlanta, GA | 4.0 | 2.0 | 1215 | $2,450 | $2.02 | 24d | 1 | 0.68mi |
| 825 Erin Ave SW Atlanta, GA | 2.0 | 1.0 | 776 | $3,000 | $3.87 | 24d | 1 | 0.69mi |
| 404 Bass St SW Atlanta, GA | 3.0 | 2.0 | 1080 | $1,850 | $1.71 | 16d | 1 | 0.71mi |
| 1264 Hartford Ave SW Atlanta, GA | 3.0 | 2.0 | 1290 | $1,989 | $1.54 | 24d | 1 | 0.72mi |
| 490 Lynnhaven Dr SW Atlanta, GA | 3.0 | 2.0 | 1289 | $2,395 | $1.86 | 4d | 1 | 0.73mi |
| 1430 Desoto Ave SW Atlanta, GA | 3.0 | 2.0 | 1224 | $2,200 | $1.80 | 24d | 1 | 0.77mi |
| 717 Lee St SW Atlanta, GA | 1.0–2.0 | 1.0 | 768 | $1,416 | $1.84 | 2d | 5 | 0.81mi |
| 903 Beecher St SW Atlanta, GA | 3.0 | 2.0 | 1500 | $7,500 | $5.00 | 24d | 1 | 0.84mi |
| 903 Beecher St SW Unit 905 Beecher Atlanta, GA | 3.0 | 2.0 | 1500 | $4,000 | $2.67 | 22d | 1 | 0.84mi |
| 1534 Beatie Ave SW Atlanta, GA | 3.0 | 2.0 | 1050 | $2,050 | $1.95 | 24d | 1 | 0.91mi |
| 818 Peeples St SW Atlanta, GA | 2.0 | 1.0 | 936 | $1,500 | $1.60 | 24d | 1 | 0.94mi |
| 1483 Arthur Langford Jr Pl SW Atlanta, GA | 1.0–2.0 | 1.0 | 825 | $900 | $1.09 | 24d | 7 | 0.95mi |
| 969 Arden Ave SW Atlanta, GA | 4.0 | 2.0 | 1380 | $1,850 | $1.34 | 24d | 1 | 1.00mi |
| 973 Lawton St SW Atlanta, GA | 3.0 | 1.0 | 912 | $1,575 | $1.73 | 7d | 1 | 1.03mi |
| 1056 Hank Aaron Dr SW Atlanta, GA | 1.0–2.0 | 1.0 | 753 | $1,139 | $1.51 | 7d | 6 | 1.06mi |
| 875 Hank Aaron Dr SW Atlanta, GA | 1.0–3.0 | 1.0–2.0 | 916 | $1,688 | $1.84 | 24d | 1 | 1.08mi |
| 561 Formwalt St SW Atlanta, GA | 2.0 | 2.0 | 1000 | $1,600 | $1.60 | 24d | 1 | 1.09mi |
| 174 Moury Ave SW Atlanta, GA | 1.0–3.0 | 1.0–2.0 | 926 | $1,728 | $1.87 | 2d | 6 | 1.11mi |
| 1645 Metropolitan Pkwy SW Unit A Atlanta, GA | 3.0 | 1.0 | 1433 | $1,795 | $1.25 | 24d | 1 | 1.12mi |
| 1084 Cordova St SW Atlanta, GA | 2.0 | 1.0 | 750 | $1,295 | $1.73 | 18d | 1 | 1.14mi |
| 1054 Atlanta, GA | 3.0–4.0 | 2.0 | 1295 | $1,974 | $1.52 | 20d | 2 | 1.16mi |
| 72 Milton Ave SE Atlanta, GA | 2.0 | 1.0–2.0 | 818 | $2,107 | $2.57 | 1d | 24 | 1.16mi |
Listing history 10 events
-
2026-06-18days on market $99,000 Active 14 DOM
-
2026-06-17days on market $99,000 Active 13 DOM
-
2026-06-16days on market $99,000 Active 12 DOM
-
2026-06-15days on market $99,000 Active 11 DOM
-
2026-06-13days on market $99,000 Active 9 DOM
-
2026-06-13days on market $99,000 Active 8 DOM
-
2026-06-09days on market $99,000 Active 5 DOM
-
2026-06-08days on market $99,000 Active 4 DOM
-
2026-06-07remarks 685-char remark
-
2026-06-07$99,000 Active 3 DOM
ⓘ Source: listings_history table (triggers on properties + properties_extension) + one-shot
backfill from property_details.listing_events for pre-trigger history.
Tax reassessment forecast GA · Resets to sale price
- Current annual tax
- $2,252 · $188/mo
- Projected year-2 tax
- $2,252 · $188/mo
- Expected delta
- $0/yr ($0/mo · 0.0%)
ⓘ Screening estimate from a state-policy table — verify with the county assessor before closing.
Climate risk First Street
- Flood 1/10 Low FEMA zone X (unshaded) · 0% chance over 30 yrs
- Wildfire 1/10 Low
- Heat 5/10 Major 7 d/yr ≥104°F today · 16 d/yr by 30 yrs out
- Wind 4/10 Moderate 22% chance of damaging wind over 30 yrs
- Air quality 4/10 Moderate 4 unhealthy d/yr today · 6 by 30 yrs out
Nearby sold comps map
Loading sold comps map…
Walkable amenities ~0.75 mi
Loading nearby amenities…
Taxation est. · year 1
- Rental income
- $27,043
- − Mortgage interest
- −$5,546
- − Property taxes
- −$2,252
- − Insurance
- −$495
- − Repairs & maintenance
- −$2,163
- − Management
- −$2,163
- − Depreciation
- −$2,880
- Taxable income
- $11,543
- Est. tax owed @ 24.0%
- −$2,770
- After-tax cash flow
- $9,616/yr
For passive investors: Depreciation is non-cash, so a rental often shows a tax loss while cash-flowing — sheltering income. Rental losses are passive: they offset passive income freely, and up to $25,000/yr can offset ordinary (W-2) income if you actively participate and your MAGI is under $100k (phasing out to $0 by $150k); unused losses carry forward. On sale, claimed depreciation is recaptured at up to 25%, and gains may owe capital-gains tax (a 1031 exchange can defer both). Figures are a year-1 estimate at your 24.0% rate — not tax advice; consult a CPA.
Schools (NCES district)
- District
- Atlanta Public Schools
- NCES district ID
- 1300120
- Math proficiency
- 28% ▼ -6.00%
- Reading proficiency
- 35% ▼ -2.00%
- Median HH income
- $48,306
- Composite
- 27.27/100
- National rank
- #7006
- State rank
- #80 of 174 in GA
Livability — Atlanta
- Score
- 83/100
- State rank
- #6
- US rank
- #919
Category grades
Schools grade is shown separately in the Schools card above.
Census & demographics
- Census place
- Atlanta, GA
- County
- Fulton County · 1,094,430 people
- City population
- 629,525
- Metro
- Atlanta-Sandy Springs-Alpharetta, GA
- Population (ZIP)
- 27,186
- Household income
- $53,037
- Rent vs Own
- Severe rent burden
- 1676.0
Population outlook (Fulton County) Hauer SSP2
- Today (2025)
- 1,203,707 people
- By 2030
- 1,299,706 · +8.0%
- By 2040
- 1,488,256 · +23.6%
- By 2050
- 1,664,580 · +38.3%
- By 2075
- 2,036,072 · +69.2%
- By 2100
- 2,222,402 · +84.6%
Race, ethnicity, and origin ACS 2023
- Neighborhood character
- Predominantly Black (76%)
- Race & ethnicity
- Black 76% White 14% Two or more races 4% Hispanic / Latino 4% Asian 2%
- Common ancestry
- Lithuanian 1% Slovak 1% Serbian 0%
- Foreign-born
- 5% · Canada, South Korea, Vietnam
- Languages at home
- 92% English-only · Spanish 4% French/Haitian/Cajun 1% Other Indo-European 1%
Political lean MEDSL · Fulton
- 2024 margin
- Solid D (+44.9) · D 71.9% · R 27.0% · Other 1.1%
- 2008→2024 swing
- +9.8pp toward D · 2008: 35.0pp · 2024: 44.9pp
- All cycles
- 2024: D+44.9 2020: D+46.4 2016: D+42.1 2012: D+29.6 2008: D+35.0
Not yet ingested
- Civics
- —
Market trends
- HPI YoY
- ▼ -204.00%
- Current HPI
- 418.7297
- Rent YoY
- ▲ 2.77%
- Metro
- Atlanta-Sandy Springs-Alpharetta, GA
- State GDP YoY
- ▲ 2.66%
- F500 in state
- 28
Industry mix (Fortune 500 HQ in GA)
| Industry | F500 HQs | Revenue |
|---|---|---|
| Paper / Packaging | 2 | $29B |
|
||
| Retail | 1 | $160B |
|
||
| Transportation / Logistics | 1 | $91B |
|
||
| Airlines | 1 | $62B |
|
||
| Consumer Goods | 1 | $47B |
|
||
| Utilities | 1 | $25B |
|
||
Price history
+200.0% since first listed9 events — show timeline
- 2026-06-04 Listed $99,000 FMLS
- 2026-06-04 Listed $99,000 GAMLS
- 2010-12-22 Listing Removed — FMLS
- 2010-12-10 Sold (MLS) $11,900 FMLS
- 2010-11-20 Pending — FMLS
- 2010-10-10 Listed $17,000 FMLS
- 1998-11-16 Sold (Public Records) $65,000 Public Records
- 1998-11-16 Sold (Public Records) $65,000 Public Records
- 1998-04-16 Sold (Public Records) $33,000 Public Records
Property tax history
+9.0%/yrLatest (2025): $2,252 · -9.6% YoY. Source: county tax records.
Cash-flow waterfall
monthlySold comps — $/sqft
last 12 mo · ≤1 miLoading sold comps…