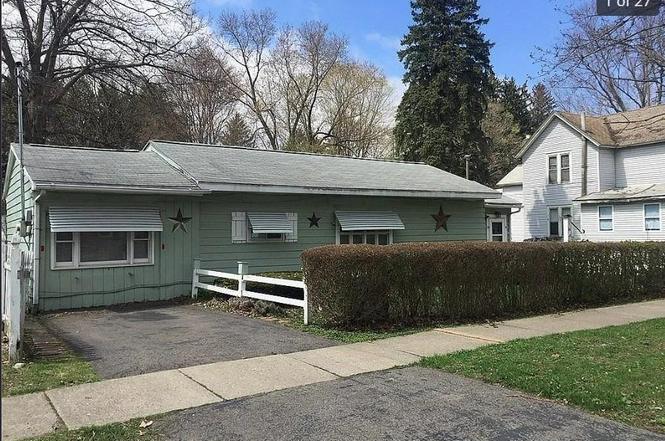
58 Cortland St · Homer, NY
Flood risk 1/10 · Minimal
- FEMA flood zone
- X (unshaded)
- Chance of flooding over 30 yrs
- 0.0%
- Est. flood insurance / yr
- $473 – $860
Fire risk 1/10 · Minimal
- Est. fire insurance / yr
- $691 – $1,283
Heat risk 2/10 · Minimal
- Hot days now (above 94°F)
- 7 days/yr
- Hot days in 30 yrs
- 15 days/yr
Wind risk 2/10 · Minimal
- Chance of severe wind over 30 yrs
- 1.0%
Air-quality risk 2/10 · Minimal
- Unhealthy air days now
- 0 days/yr
- Unhealthy air days in 30 yrs
- 1 days/yr
Risk factors via First Street. Map © Google.
Why this score? — see what drove the C- grade
The composite is a weighted blend of 9 inputs, each scored 0–100. Each bar is that input's sub-score; the figure is the points it added to the 100-point composite (weight × sub-score).
- ARV discount +15.0/15.0
- Appreciation +8.4/10.0
- Cash flow +7.8/30.0
- Schools +4.7/10.0
- Livability +3.8/5.0
- 1% rule +3.6/10.0
- Rent growth +2.5/5.0
- Condition / age +2.5/5.0
- DSCR +1.9/10.0
$160,000
🖨 Deal sheet (PDF) 📄 Offer letter ✓ Due diligence
Listing remarks MLS
New price Sept 1st. At this price it would make a great income property!! Looks are deceiving. .it has 1606 in sf. One owner built in 1947. This 3 BRs, including one large master and possible space to convert for a 4th BR. Kitchen has breakfast area and dining area. Double LR and a family room. Addition room could be office, craft room or that additional BR or family could also be converted for a 4th BR. Lot is 218 feet deep fully fenced with a couple of outbuildings for storage or a workshop. Hot water baseboard heat. Some vinyl thermal replacements. On the exterior there are metal awnings which are removal and are reinstalled for the spring-fall seasons.
Key facts
- Office
- Double lr
- Craft room
Tags
Neighborhood map
What this means for you Summary
Snapshot
- This is a 3-bed/1.0-bath single-family listed at $160k.
Deal economics
- At list price, monthly cash flow is $-179 ($-2k/yr) — negative.
- To cash-flow at today's rent, offer at most $128k (19.8% below list).
- To meet the 1% rule (rent ≥ 1% of price), the offer needs to be $138k (13.7% below list).
- Recommended offer: $128k (19.8% below list) — sets the bar for cash-flow.
- Cap rate 5.0% vs local median 3.4% in Homer — top-decile yield for the area; either an underpriced asset or a hidden risk that comps aren't pricing in. Stress-test before assuming the spread holds.
Location & tenants
- Location reads 76/100 on livability (#229 in NY, #3,609 nationally) — a middle-class / working-renter tenant base. Strengths: housing A+, health & safety A+, cost of living A; Watch: amenities F, commute F.
- Homer Central School District (town): math 49% / reading 59% proficiency, ranked #306 of 590 in NY (top 52%) — acceptable for families but not a draw, mixed tenant base, ~2y average lease.
- Market conditions: 39 active listings in the ZIP; 45 units permitted in Cortland County in 2024 (12 in 5+ unit buildings).
Forward outlook
- In year one you build about $12k of equity ($1k loan paydown + $11k appreciation (6.9% local appreciation)).
- Cortland County population projected at -15% by 2050 — secular population decline; favor cash flow + early exit over multi-decade hold.
- By year 4, paydown + projected appreciation supports a ~$41k cash-out refi (75% LTV) — recoverable capital for the next deal without selling this one.
Negotiation context
- Only 1 days on market — expect competitive offers; lowballing is unlikely to land.
- 5 sale attempts since 14y ago with the ask held roughly flat each time — persistent listings suggest the price (not the market) is what's stuck; bring a comps-based counter.
- Current owner paid $80k; list at $160k implies a 100% gain — meaningful room to come down on a strong offer.
Risks & watch-outs
- Watch-outs: property tax is 2.7% of price; built in 1947 — expect roof / HVAC / electrical / plumbing capex.
Questions for the listing agent
- What do current leases actually rent for vs. the listed asking? Can we see a recent rent roll and the last 12 months of T-12 income?
- Built in 1947 — when were the roof, HVAC, electrical panel, plumbing, and water heater last replaced?
- Property tax is high relative to price — has the assessment been appealed recently, and will the sale trigger a re-assessment?
- Is there a deadline driving the sale (1031 exchange, divorce, estate, relocation)? That informs how much negotiation room exists.
- Schools are B-rated — typically a magnet for longer-tenancy family renters. What's the average tenant stay here, and is there a school-zone premium baked into asking?
- What's the average days-on-market for RENTAL listings here right now (not sales)? A rising rental-DOM trend means longer vacancies and softer asking-rent achievability than the comps imply.
- What's the recent tenant-quality profile in this submarket — average credit score on applications, eviction rate, late-payment / NSF rate, and stable-employment percentage? A property-management company in the area should have these aggregated.
- How much new for-sale + rental construction is in the pipeline within 1–3 miles? Heavy new supply typically softens prices + rents 12–24 months out; constrained supply supports both.
Investment metrics
- 1% rule
- 0.86% ✗
- Cap rate
- 4.95%
- Cash-on-cash
- -4.79%
- DSCR
- 0.79
- GRM
- 9.7
CMA / ARV
- ARV (median comp)
- $206,016
- List price
- $160,000
- Delta
- -36.95%
- Verdict
- UNDERPRICED
- Comps
- 20 within 1.0 mi
Show comp detail 8 sales within ~0.75 mi
| Address | Dist | Beds/Ba | Sqft | Sold | Price | $/sf | Match |
|---|---|---|---|---|---|---|---|
| 57 River St | 0.43mi | 3/1.0 | 1,530 (-5%) | 6mo | $147,000 | $96 | 67 |
| 4 Copeland Ave | 0.16mi | 4/1.5 (+1) | 1,584 (-1%) | 24mo | $201,500 | $127 | 64 |
| 94 Cayuga St | 0.40mi | 3/1.0 | 1,378 (-14%) | 4mo | $188,000 | $136 | 54 |
| 44 Cortland St | 0.09mi | 2/2.0 (-1) | 1,728 (+8%) | 24mo | $215,144 | $125 | 54 |
| 11 Grove St | 0.47mi | 3/1.5 | 1,526 (-5%) | 22mo | $150,000 | $98 | 50 |
| 52 Center St | 0.38mi | 4/2.0 (+1) | 1,710 (+6%) | 20mo | $195,000 | $114 | 45 |
| 28 Warren St | 0.73mi | 3/2.0 | 1,628 (+1%) | 23mo | $179,220 | $110 | 40 |
| 7 S William St | 0.39mi | 4/1.5 (+1) | 1,840 (+15%) | 21mo | $165,000 | $90 | 33 |
Match score weights: distance 35% · size 25% · config 20% · recency 20%. Top-matched comps best support the ARV.
Projected returns pro-forma
6.86% appreciation · 3.0% rent growth · sell at horizon
- IRR
- 13.7%
- Equity multiple
- 1.96×
- Total profit
- $43,180
- Equity at exit
- $109,368
- IRR
- 13.9%
- Equity multiple
- 4.00×
- Total profit
- $134,439
- Equity at exit
- $206,397
Cash invested: $44,800 (down + closing). Projections, not guarantees.
Landlord ↔ Tenant lean methodology
- Overall (STATE)
- 15 Strongly Tenant-Friendly
- State New York
- 15 Strongly Tenant-Friendly · D+10
- County
- — inherits STATE
- City
- — inherits STATE
ZIP-level market 13077
- Home prices YoY
- 2.4%
- Active inventory
- 39
- Price-to-rent
- 9.7×
Monthly cashflow live
- Estimated rent
- $1,382 medium interval (Pro) →
- Mortgage (P&I)
- −$839
- Tax from tax record
- −$365 /mo · $4,375/yr
- Insurance
- −$67
- HOA
- −$0
- Vacancy / Maint / Mgmt
- −$290
- Net cashflow
- $-179
Break-even live
Sensitivity live
| Price | -10% $-88 | -5% $-134 | +0% $-179 | +5% $-224 | +10% $-269 |
|---|---|---|---|---|---|
| Rent | -10% $-288 | -5% $-233 | +0% $-179 | +5% $-124 | +10% $-70 |
| Rate | -1.0pp $-98 | -0.5pp $-138 | base $-179 | +0.5pp $-220 | +1.0pp $-263 |
UW: 25.0% down · 7.5% · 30yr · 1.5% tax · 5.0% vac · 8.0% maint · 8.0% mgmt
Financing live
Cash to close
- Down payment
- $40,000
- Closing costs
- $4,800
- Reserves months
- —
- Total cash needed
- —
Loan-product check · same deal, 3 products live
Conventional
25% down · 7.5% · 30yr
- Down + closing
- —
- Monthly P&I
- —
- Monthly cashflow
- —
- DSCR
- —
- Eligible?
- —
Personal DTI + credit; lowest rate.
DSCR
20% down · 8.5% · 30yr
- Down + closing
- —
- Monthly P&I
- —
- Monthly cashflow
- —
- DSCR
- —
- Eligible?
- —
No personal income docs; deal must DSCR.
Hard money
10% down · 12.0% · 12mo
- Down + closing
- —
- Monthly P&I
- —
- Monthly cashflow
- —
- DSCR
- —
- Eligible?
- —
Short-term bridge; refi at stabilization.
Listing history 13 events
-
2026-06-19pricestatusdays on market $160,000 Active 1 DOM
-
2026-05-19historical
-
2026-04-13price $129,888
-
2026-03-13price $139,888
-
2026-03-13price $159,888
-
2026-01-29$169,888 Active
-
2019-12-30soldstatus $80,000
-
2019-12-27soldstatus $80,000 664-char remark
Show marketing remark (664 chars)
New price Sept 1st. At this price it would make a great income property!! Looks are deceiving. .it has 1606 in sf. One owner built in 1947. This 3 BRs, including one large master and possible space to convert for a 4th BR. Kitchen has breakfast area and dining area. Double LR and a family room. Addition room could be office, craft room or that additional BR or family could also be converted for a 4th BR. Lot is 218 feet deep fully fenced with a couple of outbuildings for storage or a workshop. Hot water baseboard heat. Some vinyl thermal replacements. On the exterior there are metal awnings which are removal and are reinstalled for the spring-fall seasons.
-
2019-12-27soldstatus $73,000
Show marketing remark (664 chars)
New price Sept 1st. At this price it would make a great income property!! Looks are deceiving. .it has 1606 in sf. One owner built in 1947. This 3 BRs, including one large master and possible space to convert for a 4th BR. Kitchen has breakfast area and dining area. Double LR and a family room. Addition room could be office, craft room or that additional BR or family could also be converted for a 4th BR. Lot is 218 feet deep fully fenced with a couple of outbuildings for storage or a workshop. Hot water baseboard heat. Some vinyl thermal replacements. On the exterior there are metal awnings which are removal and are reinstalled for the spring-fall seasons.
-
2019-03-01$79,900 664-char remark
Show marketing remark (664 chars)
New price Sept 1st. At this price it would make a great income property!! Looks are deceiving. .it has 1606 in sf. One owner built in 1947. This 3 BRs, including one large master and possible space to convert for a 4th BR. Kitchen has breakfast area and dining area. Double LR and a family room. Addition room could be office, craft room or that additional BR or family could also be converted for a 4th BR. Lot is 218 feet deep fully fenced with a couple of outbuildings for storage or a workshop. Hot water baseboard heat. Some vinyl thermal replacements. On the exterior there are metal awnings which are removal and are reinstalled for the spring-fall seasons.
-
2019-02-27$79,900
-
2012-03-15historical
-
2012-02-24$89,900
ⓘ Source: listings_history table (triggers on properties + properties_extension) + one-shot
backfill from property_details.listing_events for pre-trigger history.
Tax reassessment forecast NY · Partial reset (capped growth)
- Current annual tax
- $4,375 · $365/mo
- Projected year-2 tax
- $4,375 · $365/mo
- Expected delta
- $0/yr ($0/mo · 0.0%)
ⓘ Screening estimate from a state-policy table — verify with the county assessor before closing.
Climate risk First Street
- Flood 1/10 Low FEMA zone X (unshaded) · 0% chance over 30 yrs
- Wildfire 1/10 Low
- Heat 2/10 Low 7 d/yr ≥94°F today · 15 d/yr by 30 yrs out
- Wind 2/10 Low 100% chance of damaging wind over 30 yrs
- Air quality 2/10 Low 0 unhealthy d/yr today · 1 by 30 yrs out
Nearby sold comps map
Loading sold comps map…
Walkable amenities ~0.75 mi
Loading nearby amenities…
Taxation est. · year 1
- Rental income
- $16,578
- − Mortgage interest
- −$8,962
- − Property taxes
- −$4,375
- − Insurance
- −$800
- − Repairs & maintenance
- −$1,326
- − Management
- −$1,326
- − Depreciation
- −$4,655
- Taxable loss
- −$4,866
- Est. tax savings @ 24.0%
- +$1,168
- After-tax cash flow
- $-979/yr
For passive investors: Depreciation is non-cash, so a rental often shows a tax loss while cash-flowing — sheltering income. Rental losses are passive: they offset passive income freely, and up to $25,000/yr can offset ordinary (W-2) income if you actively participate and your MAGI is under $100k (phasing out to $0 by $150k); unused losses carry forward. On sale, claimed depreciation is recaptured at up to 25%, and gains may owe capital-gains tax (a 1031 exchange can defer both). Figures are a year-1 estimate at your 24.0% rate — not tax advice; consult a CPA.
Schools (NCES district)
- District
- Homer Central School District
- NCES district ID
- 3614640
- Math proficiency
- 49% ▼ -1.00%
- Reading proficiency
- 59% ▲ 9.00%
- Median HH income
- $60,122
- Composite
- 47.03/100
- National rank
- #2342
- State rank
- #306 of 590 in NY
Livability — Homer
- Score
- 76/100
- State rank
- #229
- US rank
- #3609
Category grades
Schools grade is shown separately in the Schools card above.
Census & demographics
- Census place
- Homer, NY
- Population (ZIP)
- 6,567
Population outlook (Cortland County) Hauer SSP2
- Today (2025)
- 47,543 people
- By 2030
- 46,107 · -3.0%
- By 2040
- 43,122 · -9.3%
- By 2050
- 40,216 · -15.4%
- By 2075
- 34,717 · -27.0%
- By 2100
- 28,953 · -39.1%
Race, ethnicity, and origin ACS 2023
- Neighborhood character
- Predominantly White (95%)
- Race & ethnicity
- White 95% Two or more races 3% Asian 2%
- Common ancestry
- Romanian 3% Slovak 3% Serbian 2%
- Foreign-born
- 2% · China
- Languages at home
- 94% English-only · Other Indo-European 2% French/Haitian/Cajun 2% Chinese 2%
Political lean MEDSL · Cortland
- 2024 margin
- Lean R (+6.4) · D 46.8% · R 53.2%
- 2008→2024 swing
- -16.4pp toward R · 2008: 10.0pp · 2024: -6.4pp
- All cycles
- 2024: R+6.4 2020: R+1.9 2016: R+6.7 2012: D+8.8 2008: D+10.0
Not yet ingested
- Civics
- —
Market trends
- HPI YoY
- ▲ 6.86%
- Current HPI
- 298.7707
- Rent YoY
- —
- Metro
- —
- State GDP YoY
- ▲ 2.60%
- F500 in state
- 92
Industry mix (Fortune 500 HQ in NY)
| Industry | F500 HQs | Revenue |
|---|---|---|
| Financial Services | 10 | $950B |
|
||
| Consumer Goods | 9 | $162B |
|
||
| Insurance | 4 | $225B |
|
||
| Telecommunications | 2 | $144B |
|
||
| Pharmaceuticals | 2 | $112B |
|
||
| Media / Entertainment | 2 | $69B |
|
||
Price history
+78.0% since first listed13 events — show timeline
- 2026-06-19 Listed $160,000 FSBO.com
- 2026-05-19 Listing Removed — OneKey® MLS as Distributed by MLS Grid
- 2026-04-13 Price Changed $129,888 OneKey® MLS as Distributed by MLS Grid
- 2026-03-13 Price Changed $139,888 OneKey® MLS as Distributed by MLS Grid
- 2026-03-13 Price Changed $159,888 OneKey® MLS as Distributed by MLS Grid
- 2026-01-29 Listed $169,888 OneKey® MLS as Distributed by MLS Grid
- 2019-12-30 Sold (Public Records) $80,000 Public Records
- 2019-12-27 Sold (MLS) $73,000 IBRMLS
- 2019-12-27 Sold (MLS) $80,000 CNYIS
- 2019-03-01 Listed $79,900 CNYIS
- 2019-02-27 Listed $79,900 IBRMLS
- 2012-03-15 Listing Removed — CNYIS
- 2012-02-24 Listed $89,900 CNYIS
Property tax history
+5.0%/yrLatest (2025): $4,375 · +5.4% YoY. Source: county tax records.
Cash-flow waterfall
monthlySold comps — $/sqft
last 12 mo · ≤1 miLoading sold comps…