873 County Rd · Ironton, OH
Flood risk No data
- FEMA flood zone
- —
- Chance of flooding over 30 yrs
- —
- Est. flood insurance / yr
- —
Fire risk No data
- Est. fire insurance / yr
- —
Heat risk No data
- Hot days now (above threshold)
- —
- Hot days in 30 yrs
- —
Wind risk No data
- Chance of severe wind over 30 yrs
- —
Air-quality risk No data
- Unhealthy air days now
- —
- Unhealthy air days in 30 yrs
- —
Risk factors via First Street. Map © Google.
Why this score? — see what drove the B grade
The composite is a weighted blend of 9 inputs, each scored 0–100. Each bar is that input's sub-score; the figure is the points it added to the 100-point composite (weight × sub-score).
- Cash flow +30.0/30.0
- 1% rule +10.0/10.0
- DSCR +10.0/10.0
- ARV discount +7.5/15.0
- Schools +4.6/10.0
- Livability +3.6/5.0
- Rent growth +2.5/5.0
- Condition / age +2.2/5.0
- Appreciation +0.0/10.0
$49,900
🖨 Deal sheet 📄 Offer letter ✓ Due diligence
Listing remarks
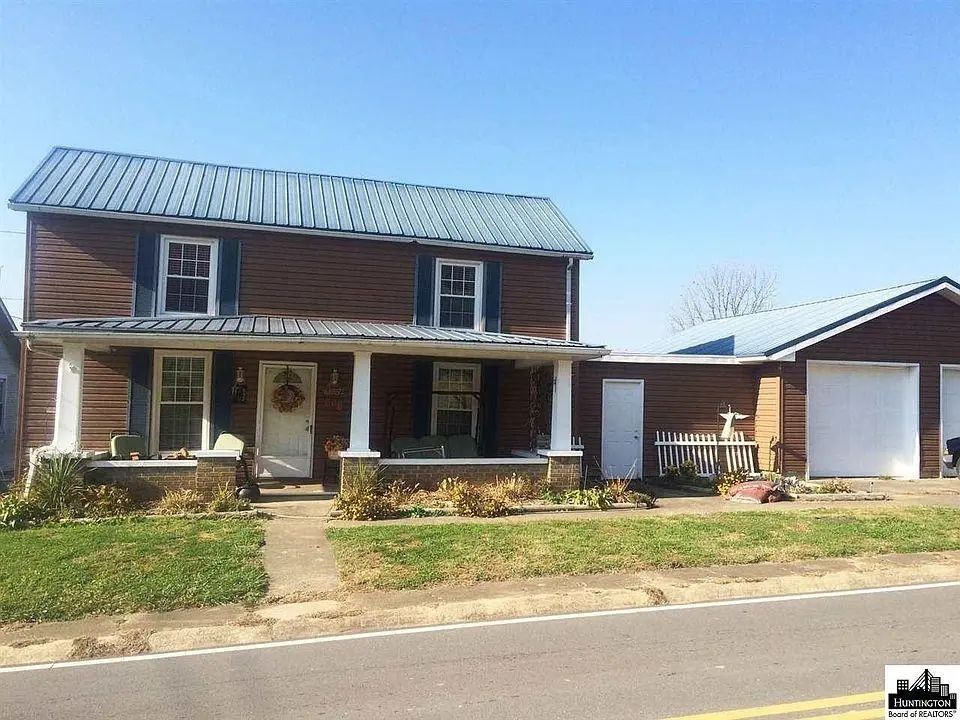
Looking for a fixer upper with lots of potential in Coal Grove? 3 bedrooms and 1 1/2 baths with a large two car garage!
Key facts
- 4,792 sq ft lot
- 2 garage spots
- Built 1910
Property features AI
Exterior
- Parking: Attached 2-car garage
- Utilities: Public water
- Home design: Single-family residence; Two-story
- Construction: Aluminum and vinyl siding; Metal roof
- Exterior features: Deck; Level to sloped lot
Interior
- Flooring: Wood
- Bathrooms: One full bathroom; One half bathroom
- Heating & cooling: Heat pump heating
- Interior features: Wood flooring; Crawl space basement
Neighborhood map
What this means for you Summary
Snapshot
- This is a 3-bed/1.5-bath single-family listed at $50k. Condition is rated fair.
Deal economics
- At list price, monthly cash flow is $576 ($7k/yr) — positive.
- The deal already cash-flows at list — no discount required.
- Meets the 1% rule at list price ($1k rent vs $50k).
- Cap rate 20.1% vs local median 5.1% in Ironton — top-decile yield for the area; either an underpriced asset or a hidden risk that comps aren't pricing in. Stress-test before assuming the spread holds.
Location & tenants
- Location reads 72/100 on livability (#354 in OH) — a middle-class / working-renter tenant base. Strengths: cost of living A+, health & safety A+, housing A-; Watch: amenities F, commute F, employment D-.
- Ironton City School District (suburban): math 54% / reading 58% proficiency, ranked #382 of 656 in OH (top 58%) — acceptable for families but not a draw, mixed tenant base, ~2y average lease.
- Zoned schools: Ironton Middle School (math 57% / reading 55%, grade B-, #316 of 654 statewide, top 49%, 302 students, 0% FRL) — zoned schools average 0% FRL vs 48% district-wide (48 pts lower); this property's tenant base skews higher-income than the district average.
- Market conditions: 84 active listings in the ZIP; 18 units permitted in Lawrence County in 2024 (0 in 5+ unit buildings).
Forward outlook
- Local home prices are declining (-3.0%/yr); year-one equity from $345 of loan paydown is wiped out by about $1k of value loss. Plan a longer hold.
- Lawrence County population projected at -22% by 2050 — secular population decline; favor cash flow + early exit over multi-decade hold.
- At projected returns (-3.0% appreciation + 3.0% rent growth), your $14k cash investment doubles in ~3 years — after that, you're playing with house money.
Negotiation context
- Only 8 days on market — expect competitive offers; lowballing is unlikely to land.
Risks & watch-outs
- Watch-outs: built in 1910 — expect roof / HVAC / electrical / plumbing capex.
Questions for the listing agent
- Have any recent inspections been done? Can we get a copy of the seller's disclosures and any deferred-maintenance estimates?
- Built in 1910 — when were the roof, HVAC, electrical panel, plumbing, and water heater last replaced?
- Is there a deadline driving the sale (1031 exchange, divorce, estate, relocation)? That informs how much negotiation room exists.
- Schools are B-rated — typically a magnet for longer-tenancy family renters. What's the average tenant stay here, and is there a school-zone premium baked into asking?
- What's the average days-on-market for RENTAL listings here right now (not sales)? A rising rental-DOM trend means longer vacancies and softer asking-rent achievability than the comps imply.
- What's the recent tenant-quality profile in this submarket — average credit score on applications, eviction rate, late-payment / NSF rate, and stable-employment percentage? A property-management company in the area should have these aggregated.
- How much new for-sale + rental construction is in the pipeline within 1–3 miles? Heavy new supply typically softens prices + rents 12–24 months out; constrained supply supports both.
Investment metrics
- 1% rule
- 2.34% ✓
- Cap rate
- 20.14%
- Cash-on-cash
- 49.44%
- DSCR
- 3.20
- GRM
- 3.6
CMA / ARV
- ARV (on-the-fly)
- $146,520
- Comps found
- 5
Show comp detail 5 sales within ~0.75 mi
| Address | Dist | Beds/Ba | Sqft | Sold | Price | $/sf | Match |
|---|---|---|---|---|---|---|---|
| 944 Co Rd 22 | 0.74mi | 3/1.0 | 1,312 (-2%) | 6mo | $240,000 | $183 | 56 |
| 228 Township Road 612 | 0.61mi | 4/2.0 (+1) | 1,384 (+4%) | 4mo | $150,000 | $108 | 54 |
| 134 Township Road 612 | 0.63mi | 3/2.0 | 1,268 (-5%) | 14mo | $139,900 | $110 | 49 |
| 617 S 9th St | 0.56mi | 2/2.0 (-1) | 1,296 (-3%) | 24mo | $24,950 | $19 | 43 |
| 625 S 9th St | 0.58mi | 3/1.0 | 1,232 (-8%) | 19mo | $149,900 | $122 | 42 |
Match score weights: distance 35% · size 25% · config 20% · recency 20%. Top-matched comps best support the ARV.
Projected returns pro-forma
-3.0% appreciation · 3.0% rent growth · sell at horizon
- IRR
- 47.1%
- Equity multiple
- 3.05×
- Total profit
- $28,595
- Equity at exit
- $7,440
- IRR
- 52.8%
- Equity multiple
- 6.17×
- Total profit
- $72,181
- Equity at exit
- $4,314
Cash invested: $13,972 (down + closing). Projections, not guarantees.
Landlord ↔ Tenant lean methodology
- Overall (STATE)
- 73 Landlord-Friendly
- State Ohio
- 73 Landlord-Friendly · R+6
- County
- — inherits STATE
- City
- — inherits STATE
ZIP-level market 45638
- Home prices YoY
- -19.6%
- Active inventory
- 84
- Price-to-rent
- 3.6×
Monthly cashflow live
- Estimated rent
- $1,165 medium interval (Pro) →
- Mortgage (P&I)
- −$262
- Tax est. 1.5%
- −$62 /mo · $748/yr
- Insurance
- −$21
- HOA
- −$0
- Vacancy / Maint / Mgmt
- −$245
- Net cashflow
- $576
Break-even live
UW: 25.0% down · 7.5% · 30yr · 1.5% tax · 5.0% vac · 8.0% maint · 8.0% mgmt
Financing live
Cash to close
- Down payment
- $12,475
- Closing costs
- $1,497
- Reserves months
- —
- Total cash needed
- —
Loan-product check · same deal, 3 products live
Conventional
25% down · 7.5% · 30yr
- Down + closing
- —
- Monthly P&I
- —
- Monthly cashflow
- —
- DSCR
- —
- Eligible?
- —
Personal DTI + credit; lowest rate.
DSCR
20% down · 8.5% · 30yr
- Down + closing
- —
- Monthly P&I
- —
- Monthly cashflow
- —
- DSCR
- —
- Eligible?
- —
No personal income docs; deal must DSCR.
Hard money
10% down · 12.0% · 12mo
- Down + closing
- —
- Monthly P&I
- —
- Monthly cashflow
- —
- DSCR
- —
- Eligible?
- —
Short-term bridge; refi at stabilization.
Listing history 7 events
-
2026-06-18days on market $49,900 Active 8 DOM
-
2026-06-17days on market $49,900 Active 7 DOM
-
2026-06-16days on market $49,900 Active 6 DOM
-
2026-06-15days on market $49,900 Active 5 DOM
-
2026-06-13days on market $49,900 Active 3 DOM
-
2026-06-12remarks 119-char remark
-
2026-06-12$49,900 Active 2 DOM
ⓘ Source: listings_history table (triggers on properties + properties_extension) + one-shot
backfill from property_details.listing_events for pre-trigger history.
Nearby sold comps map
Loading sold comps map…
Walkable amenities ~0.75 mi
Loading nearby amenities…
Taxation est. · year 1
- Rental income
- $13,982
- − Mortgage interest
- −$2,795
- − Property taxes
- −$748
- − Insurance
- −$250
- − Repairs & maintenance
- −$1,119
- − Management
- −$1,119
- − Depreciation
- −$1,452
- Taxable income
- $6,500
- Est. tax owed @ 24.0%
- −$1,560
- After-tax cash flow
- $5,348/yr
For passive investors: Depreciation is non-cash, so a rental often shows a tax loss while cash-flowing — sheltering income. Rental losses are passive: they offset passive income freely, and up to $25,000/yr can offset ordinary (W-2) income if you actively participate and your MAGI is under $100k (phasing out to $0 by $150k); unused losses carry forward. On sale, claimed depreciation is recaptured at up to 25%, and gains may owe capital-gains tax (a 1031 exchange can defer both). Figures are a year-1 estimate at your 24.0% rate — not tax advice; consult a CPA.
Condition & rehab AI · 13 photos
This home requires significant repairs and maintenance, including a new roof and exterior paint, to improve its condition and increase its value.
Repairs flagged
- Major roof — Significant wear and tear visible
- Major exterior siding — Weathered and chipped paint
- Major interior walls — Paint chipped and uneven
- Minor landscaping — Overgrown grass and plants
Value-add opportunities
- Both paint exterior — Fresh paint can improve curb appeal and value
- Both repair roof — A new roof can significantly increase the home's value
- Both replace flooring — New flooring can make the home more appealing and increase its value
- Both paint interior walls — Fresh paint can make the interior look more inviting and increase its value
Renovation cost estimate screening
| Repair item | Severity | Est. cost |
|---|---|---|
| roof · Significant wear and tear visible | Major | $15,000–50,000 |
| exterior siding · Weathered and chipped paint | Major | $15,000–50,000 |
| interior walls · Paint chipped and uneven | Major | $15,000–50,000 |
| landscaping · Overgrown grass and plants | Minor | $500–3,000 |
| Total estimated repair cost · 4 items | $45,500–153,000 |
Value-add ROI direction
- Both paint exterior — Fresh paint can improve curb appeal and value ↑
- Both repair roof — A new roof can significantly increase the home's value ↑
- Both replace flooring — New flooring can make the home more appealing and increase its value ↑
- Both paint interior walls — Fresh paint can make the interior look more inviting and increase its value ↑
ⓘ Cost ranges are severity-bucket heuristics (US national rule-of-thumb). Get contractor quotes + a written scope before underwriting a rehab budget.
Schools (NCES district)
- District
- Ironton City School District
- NCES district ID
- 3904414
- Math proficiency
- 54% ▼ -10.00%
- Reading proficiency
- 58% ▼ -7.00%
- Median HH income
- $32,999
- Composite
- 46.13/100
- National rank
- #2505
- State rank
- #382 of 656 in OH
Livability — Ironton
- Score
- 72/100
- State rank
- #354
- US rank
- #5718
Category grades
Schools grade is shown separately in the Schools card above.
Census & demographics
- Census place
- Ironton, OH
- County
- Lawrence · 57,020 people
- Metro
- Huntington-Ashland, WV-KY-OH
- Population (ZIP)
- 19,921
- Household income
- $49,544
- Rent vs Own
- Severe rent burden
- 10.7
Population outlook (Lawrence County) Hauer SSP2
- Today (2025)
- 57,915 people
- By 2030
- 55,650 · -3.9%
- By 2040
- 50,523 · -12.8%
- By 2050
- 45,103 · -22.1%
- By 2075
- 32,441 · -44.0%
- By 2100
- 21,754 · -62.4%
Race, ethnicity, and origin ACS 2023
- Neighborhood character
- Predominantly White (95%)
- Race & ethnicity
- White 95% Two or more races 3% Black 1%
- Common ancestry
- Slovak 2% Iranian 2% Lithuanian 1%
- Foreign-born
- 0%
Political lean MEDSL · Lawrence
- 2024 margin
- Solid R (+50.5) · D 24.4% · R 74.9%
- 2008→2024 swing
- -35.2pp toward R · 2008: -15.3pp · 2024: -50.5pp
- All cycles
- 2024: R+50.5 2020: R+45.6 2016: R+43.9 2012: R+15.5 2008: R+15.3
Not yet ingested
- Civics
- —
Market trends
- HPI YoY
- ▼ -48.00%
- Current HPI
- 196.7459
- Rent YoY
- —
- Metro
- —
- State GDP YoY
- ▲ 1.98%
- F500 in state
- 48
Industry mix (Fortune 500 HQ in OH)
| Industry | F500 HQs | Revenue |
|---|---|---|
| Insurance | 3 | $145B |
|
||
| Industrial Machinery | 3 | $49B |
|
||
| Financial Services | 3 | $24B |
|
||
| Consumer Goods | 2 | $93B |
|
||
| Aerospace / Defense | 2 | $47B |
|
||
| Utilities | 2 | $33B |
|
||
Price history
1 event — show timeline
- 2026-06-10 Listed $49,900 HBRMLS
Cash-flow waterfall
monthlySold comps — $/sqft
last 12 mo · ≤1 miLoading sold comps…