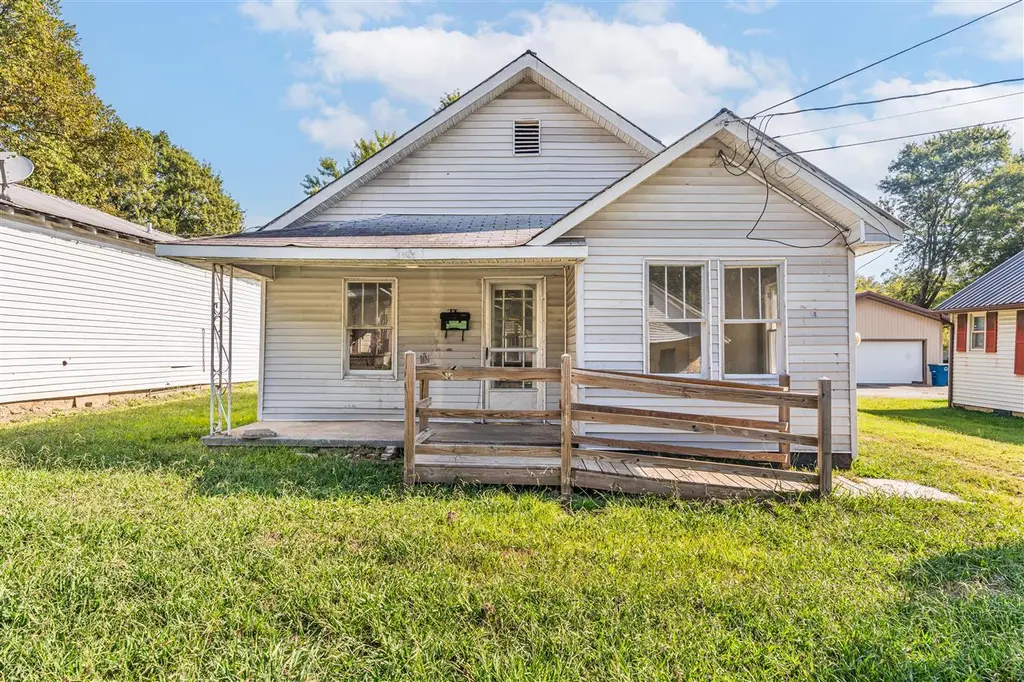
403 Mckenna St · Glasgow, KY
Flood risk 1/10 · Minimal
- FEMA flood zone
- X (unshaded)
- Chance of flooding over 30 yrs
- 0.0%
- Est. flood insurance / yr
- $507 – $1,088
Fire risk 1/10 · Minimal
- Est. fire insurance / yr
- $839 – $1,559
Heat risk 5/10 · Moderate
- Hot days now (above 107°F)
- 7 days/yr
- Hot days in 30 yrs
- 19 days/yr
Wind risk 3/10 · Minor
- Chance of severe wind over 30 yrs
- 5.0%
Air-quality risk 2/10 · Minimal
- Unhealthy air days now
- 0 days/yr
- Unhealthy air days in 30 yrs
- 2 days/yr
Risk factors via First Street. Map © Google.
Why this score? — see what drove the C grade
The composite is a weighted blend of 9 inputs, each scored 0–100. Each bar is that input's sub-score; the figure is the points it added to the 100-point composite (weight × sub-score).
- Cash flow +20.7/30.0
- ARV discount +12.0/15.0
- DSCR +6.6/10.0
- 1% rule +4.3/10.0
- Livability +3.8/5.0
- Schools +2.9/10.0
- Rent growth +2.5/5.0
- Condition / age +2.5/5.0
- Appreciation +0.0/10.0
$89,900
🖨 Deal sheet 📄 Offer letter ✓ Due diligence
Listing remarks
Recently remodeled 2-bedroom, 1-bath home in Glasgow. Updates include handicap-accessible front door, fresh paint, new LVP flooring, recently installed water heater, new vanity with plumbing upgrades, and updated lighting with ceiling fans. Conveniently located just minutes from downtown Glasgow and close to Glasgow Independent Schools. Move-in ready and easy to maintain. * Some photos are virtually staged. * * Lease with option to purchase option available. *
Key facts
- Move-in ready
- New lvp flooring
- Easy to maintain
Tags
Property features AI
Exterior
- Security: Smoke detectors; Accessible entrance
- Utilities: Public water; Public sewer
- Home design: Single-family residence; Residential property
- Construction: Vinyl siding; Metal roof
- Exterior features: Covered porch/patio; Level lot; Lot in Harston subdivision
Interior
- Bedrooms: Main-level bedrooms
- Flooring: Vinyl
- Bathrooms: One full bathroom (main level)
- Heating & cooling: Natural gas heating; Window cooling units; Ceiling fans
- Interior features: Gas water heater; Vinyl flooring
Neighborhood map
What this means for you Summary
Snapshot
- This is a 2-bed/1.0-bath single-family listed at $90k.
Deal economics
- At list price, monthly cash flow is $122 ($1k/yr) — positive.
- The deal already cash-flows at list — no discount required.
- To meet the 1% rule (rent ≥ 1% of price), the offer needs to be $83k (7.3% below list).
- Recommended offer: $83k (7.3% below list) — sets the bar for 1% rule.
- Cap rate 7.9% vs local median 3.3% in Glasgow — top-decile yield for the area; either an underpriced asset or a hidden risk that comps aren't pricing in. Stress-test before assuming the spread holds.
Location & tenants
- Location reads 76/100 on livability (#92 in KY, #3,738 nationally) — a middle-class / working-renter tenant base. Strengths: cost of living A+, housing A+, health & safety A+; Watch: amenities F, commute F, employment F.
- Glasgow Independent (town): math 32% / reading 40% proficiency, ranked #69 of 165 in KY (top 42%) — families likely to look elsewhere, expect single-tenant / working-renter base with shorter leases.
- Zoned schools: Highland Elementary School (math 35% / reading 37%, grade F, #287 of 676 statewide, top 43%, 740 students, 63% FRL); Glasgow Middle School (math 29% / reading 43%, grade F, #91 of 217 statewide, top 43%, 539 students, 61% FRL); Glasgow High School (math 42% / reading 47%, grade F, #21 of 254 statewide, top 10%, 589 students, 53% FRL).
- Market conditions: 293 active listings in the ZIP; 283 units permitted in Barren County in 2024 (64 in 5+ unit buildings).
Forward outlook
- Local home prices are declining (-3.0%/yr); year-one equity from $622 of loan paydown is wiped out by about $3k of value loss. Plan a longer hold.
- Barren County population projected at +13% by 2050 — modest demand growth; plan on rents tracking national, not racing it.
Negotiation context
- It's been on market 87 days — a 6% lower offer ($85k) is reasonable based on typical stale-listing flexibility.
- 6 sale attempts; this cycle's ask is 11887% above the opening price — seller raised mid-cycle; expect resistance to lowballs.
- Current owner paid $30k; list at $90k implies a 200% gain — meaningful room to come down on a strong offer.
Risks & watch-outs
- Watch-outs: built in 1950 — expect roof / HVAC / electrical / plumbing capex.
- Climate carrying-cost: extreme-heat days projected 7→19/yr by 2055 (HVAC capex compounding) — expect insurance premiums to compound above CPI over the hold.
Questions for the listing agent
- It's been on market 87 days. Have you received any prior offers? Is the seller open to a 7% concession, seller financing, or rate buy-down credit?
- Built in 1950 — when were the roof, HVAC, electrical panel, plumbing, and water heater last replaced?
- Why hasn't it sold? Are there any deal-killer items the seller is aware of (foundation, flood, title, zoning, code violations)?
- Is there a deadline driving the sale (1031 exchange, divorce, estate, relocation)? That informs how much negotiation room exists.
- What's the average days-on-market for RENTAL listings here right now (not sales)? A rising rental-DOM trend means longer vacancies and softer asking-rent achievability than the comps imply.
- What's the recent tenant-quality profile in this submarket — average credit score on applications, eviction rate, late-payment / NSF rate, and stable-employment percentage? A property-management company in the area should have these aggregated.
- How much new for-sale + rental construction is in the pipeline within 1–3 miles? Heavy new supply typically softens prices + rents 12–24 months out; constrained supply supports both.
Investment metrics
- 1% rule
- 0.93% ✗
- Cap rate
- 7.92%
- Cash-on-cash
- 5.81%
- DSCR
- 1.26
- GRM
- 9.0
CMA / ARV
- ARV (on-the-fly)
- $99,960
- Comps found
- 1
Show comp detail 1 sale within ~0.75 mi
| Address | Dist | Beds/Ba | Sqft | Sold | Price | $/sf | Match |
|---|---|---|---|---|---|---|---|
| 125 Harwood St | 0.38mi | 2/1.0 | 624 (+6%) | 20mo | $106,000 | $170 | 55 |
Match score weights: distance 35% · size 25% · config 20% · recency 20%. Top-matched comps best support the ARV.
Projected returns pro-forma
-3.0% appreciation · 3.0% rent growth · sell at horizon
- IRR
- -7.4%
- Equity multiple
- 0.73×
- Total profit
- $-6,843
- Equity at exit
- $13,404
- IRR
- 2.2%
- Equity multiple
- 1.15×
- Total profit
- $3,878
- Equity at exit
- $7,773
Cash invested: $25,172 (down + closing). Projections, not guarantees.
Landlord ↔ Tenant lean methodology
- Overall (STATE)
- 83 Strongly Landlord-Friendly
- State Kentucky
- 83 Strongly Landlord-Friendly · R+16
- County
- — inherits STATE
- City
- — inherits STATE
ZIP-level market 42141
- Home prices YoY
- -20.6%
- Active inventory
- 293
- Price-to-rent
- 9.0×
Monthly cashflow live
- Estimated rent
- $834 medium interval (Pro) →
- Mortgage (P&I)
- −$471
- Tax from tax record
- −$28 /mo · $334/yr
- Insurance
- −$37
- HOA
- −$0
- Vacancy / Maint / Mgmt
- −$175
- Net cashflow
- $122
Break-even live
UW: 25.0% down · 7.5% · 30yr · 1.5% tax · 5.0% vac · 8.0% maint · 8.0% mgmt
Financing live
Cash to close
- Down payment
- $22,475
- Closing costs
- $2,697
- Reserves months
- —
- Total cash needed
- —
Loan-product check · same deal, 3 products live
Conventional
25% down · 7.5% · 30yr
- Down + closing
- —
- Monthly P&I
- —
- Monthly cashflow
- —
- DSCR
- —
- Eligible?
- —
Personal DTI + credit; lowest rate.
DSCR
20% down · 8.5% · 30yr
- Down + closing
- —
- Monthly P&I
- —
- Monthly cashflow
- —
- DSCR
- —
- Eligible?
- —
No personal income docs; deal must DSCR.
Hard money
10% down · 12.0% · 12mo
- Down + closing
- —
- Monthly P&I
- —
- Monthly cashflow
- —
- DSCR
- —
- Eligible?
- —
Short-term bridge; refi at stabilization.
Listing history 31 events
-
2026-06-18days on market $89,900 Active 87 DOM
-
2026-06-17days on market $89,900 Active 86 DOM
-
2026-06-16days on market $89,900 Active 85 DOM
-
2026-06-15days on market $89,900 Active 84 DOM
-
2026-06-13days on market $89,900 Active 82 DOM
-
2026-06-12days on market $89,900 Active 81 DOM
-
2026-06-09days on market $89,900 Active 78 DOM
-
2026-06-08days on market $89,900 Active 77 DOM
-
2026-06-07days on market $89,900 Active 76 DOM
-
2026-06-07days on market $89,900 Active 75 DOM
-
2026-06-04days on market $89,900 Active 72 DOM
-
2026-06-02days on market $89,900 Active 71 DOM
-
2026-06-01days on market $89,900 Active 70 DOM
-
2026-05-31days on market $89,900 Active 69 DOM
-
2026-05-31days on market $89,900 Active 68 DOM
-
2026-05-08price $89,900
-
2026-04-23historical $750
-
2026-04-23$750
-
2026-04-20price $98,900
-
2026-03-23$99,750 Active
-
2026-03-20$750
-
2026-03-20historical $750
-
2026-03-13$750
-
2025-11-26historical $750
-
2025-11-20price $750
-
2025-11-05$800
-
2025-10-17price $97,500
-
2025-09-19$99,900 Active
-
2024-11-27soldstatus $30,000
-
2008-11-07soldstatus $9,500
-
1985-04-12soldstatus $12,000
ⓘ Source: listings_history table (triggers on properties + properties_extension) + one-shot
backfill from property_details.listing_events for pre-trigger history.
Tax reassessment forecast KY · Resets to sale price
- Current annual tax
- $334 · $28/mo
- Projected year-2 tax
- $773 · $64/mo
- Expected delta
- +$440/yr (+$37/mo · 131.8%)
ⓘ Screening estimate from a state-policy table — verify with the county assessor before closing.
Climate risk First Street
- Flood 1/10 Low FEMA zone X (unshaded) · 0% chance over 30 yrs
- Wildfire 1/10 Low
- Heat 5/10 Major 7 d/yr ≥107°F today · 19 d/yr by 30 yrs out
- Wind 3/10 Moderate 5% chance of damaging wind over 30 yrs
- Air quality 2/10 Low 0 unhealthy d/yr today · 2 by 30 yrs out
Nearby sold comps map
Loading sold comps map…
Walkable amenities ~0.75 mi
Loading nearby amenities…
Taxation est. · year 1
- Rental income
- $10,004
- − Mortgage interest
- −$5,036
- − Property taxes
- −$334
- − Insurance
- −$450
- − Repairs & maintenance
- −$800
- − Management
- −$800
- − Depreciation
- −$2,615
- Taxable loss
- −$31
- Est. tax savings @ 24.0%
- +$7
- After-tax cash flow
- $1,470/yr
For passive investors: Depreciation is non-cash, so a rental often shows a tax loss while cash-flowing — sheltering income. Rental losses are passive: they offset passive income freely, and up to $25,000/yr can offset ordinary (W-2) income if you actively participate and your MAGI is under $100k (phasing out to $0 by $150k); unused losses carry forward. On sale, claimed depreciation is recaptured at up to 25%, and gains may owe capital-gains tax (a 1031 exchange can defer both). Figures are a year-1 estimate at your 24.0% rate — not tax advice; consult a CPA.
Schools (NCES district)
- District
- Glasgow Independent
- NCES district ID
- 2102220
- Math proficiency
- 32% ▼ -21.00%
- Reading proficiency
- 40% ▼ -16.00%
- Median HH income
- $27,729
- Composite
- 29.02/100
- National rank
- #6610
- State rank
- #69 of 165 in KY
Livability — Glasgow
- Score
- 76/100
- State rank
- #92
- US rank
- #3738
Category grades
Schools grade is shown separately in the Schools card above.
Census & demographics
- Census place
- Glasgow, KY
- Population (ZIP)
- 32,133
Population outlook (Barren County) Hauer SSP2
- Today (2025)
- 46,858 people
- By 2030
- 48,311 · +3.1%
- By 2040
- 50,931 · +8.7%
- By 2050
- 52,820 · +12.7%
- By 2075
- 56,499 · +20.6%
- By 2100
- 55,831 · +19.1%
Race, ethnicity, and origin ACS 2023
- Neighborhood character
- Predominantly White (87%)
- Race & ethnicity
- White 87% Two or more races 6% Hispanic / Latino 5% Black 4%
- Common ancestry
- Slovak 2% Lithuanian 2% Serbian 1%
- Foreign-born
- 3% · Canada
- Languages at home
- 95% English-only · Spanish 3%
Political lean MEDSL · Barren
- 2024 margin
- Solid R (+52.8) · D 23.1% · R 75.9% · Other 1.1%
- 2008→2024 swing
- -18.9pp toward R · 2008: -33.9pp · 2024: -52.8pp
- All cycles
- 2024: R+52.8 2020: R+47.5 2016: R+49.9 2012: R+33.3 2008: R+33.9
Not yet ingested
- Civics
- —
Market trends
- HPI YoY
- ▼ -72.48%
- Current HPI
- 278.8778
- Rent YoY
- —
- Metro
- —
- State GDP YoY
- ▲ 1.81%
- F500 in state
- 4
Industry mix (Fortune 500 HQ in KY)
| Industry | F500 HQs | Revenue |
|---|---|---|
| Healthcare | 1 | $118B |
|
||
| Food / Beverage | 1 | $7B |
|
||
Price history
+649.2% since first listed16 events — show timeline
- 2026-05-08 Price Changed $89,900 RASKMLS
- 2026-04-23 Rental Removed $750 APPFOLIO
- 2026-04-23 Listed for Rent $750 APPFOLIO
- 2026-04-20 Price Changed $98,900 RASKMLS
- 2026-03-23 Listed $99,750 RASKMLS
- 2026-03-20 Listed for Rent $750 TENANTCLOUD
- 2026-03-20 Rental Removed $750 APPFOLIO
- 2026-03-13 Listed for Rent $750 APPFOLIO
- 2025-11-26 Rental Removed $750 APPFOLIO
- 2025-11-20 Price Changed $750 APPFOLIO
- 2025-11-05 Listed for Rent $800 APPFOLIO
- 2025-10-17 Price Changed $97,500 RASKMLS
- 2025-09-19 Listed $99,900 RASKMLS
- 2024-11-27 Sold (Public Records) $30,000 Public Records
- 2008-11-07 Sold (Public Records) $9,500 Public Records
- 1985-04-12 Sold (Public Records) $12,000 Public Records
Property tax history
+8.8%/yrLatest (2025): $334 · +209.1% YoY. Source: county tax records.
Cash-flow waterfall
monthlySold comps — $/sqft
last 12 mo · ≤1 miLoading sold comps…