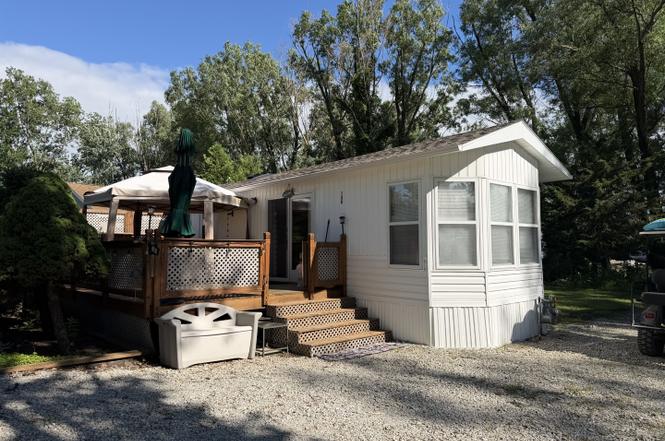
136 Little Musky Cir · Braidwood, IL
Flood risk 1/10 · Minimal
- FEMA flood zone
- X (unshaded)
- Chance of flooding over 30 yrs
- 0.0%
- Est. flood insurance / yr
- $507 – $1,088
Fire risk 1/10 · Minimal
- Est. fire insurance / yr
- $804 – $1,492
Heat risk 3/10 · Minor
- Hot days now (above 103°F)
- 7 days/yr
- Hot days in 30 yrs
- 16 days/yr
Wind risk 2/10 · Minimal
- Chance of severe wind over 30 yrs
- 1.0%
Air-quality risk 2/10 · Minimal
- Unhealthy air days now
- 1 days/yr
- Unhealthy air days in 30 yrs
- 2 days/yr
Risk factors via First Street. Map © Google.
Why this score? — see what drove the D- grade
The composite is a weighted blend of 9 inputs, each scored 0–100. Each bar is that input's sub-score; the figure is the points it added to the 100-point composite (weight × sub-score).
- Cash flow +12.5/30.0
- ARV discount +7.5/15.0
- 1% rule +4.6/10.0
- DSCR +3.7/10.0
- Livability +3.7/5.0
- Schools +3.0/10.0
- Rent growth +2.5/5.0
- Condition / age +2.5/5.0
- Appreciation +0.0/10.0
$103,500
🖨 Deal sheet 📄 Offer letter ✓ Due diligence
Listing remarks
Perfect timing. .. .summer season or stay year round, this adorable 1 Bedroom home that offers an updated livingspace, plus extra space for sleeping in LR if friends come over. Enjoy the natural light in the kitchen & LR with plenty of windows. Nights in the large backyard with bonfires making s'mores with family & friends or enjoy morning coffee outside in private. Enjoy all the wonderful amenities the community has to offer while relaxing in your own little getaway. Updates include: Appliances 2025, HVAC 2024, Roof & Shed roof 2023 (plus shed has electric), Kitchen sink, counter tops (Chevron butcher blocks), Bathroom sink and faucet, Flooring and Back door 2026, Water h
Key facts
- Gated community
- Amenity center
- Large backyard
Tags
Property features AI
Finance
- Other: Not currently leased; Possession at closing or immediate; Parcel number available
- HOA & community: Annual association fee of $1,555; HOA covers water, security, clubhouse, pool, scavenger (trash), snow removal, and lake rights
Exterior
- Parking: Gravel parking; Space for 3 vehicles
- Security: Community includes security (per association amenities)
- Utilities: Public water; Public sewer; Electric with circuit breakers
- Home design: Detached single-family home; One-story layout; Fee simple ownership with homeowners association; Rehab completed in 2025
- Construction: Vinyl siding exterior; Estimated age 31–40 years
- Exterior features: Lot dimensions approximately 45 x 100 x 79 x 100; Lot smaller than 0.25 acre; School bus service available
Interior
- Kitchen: Kitchen on main level (approx. 10 x 11)
- Bedrooms: 1 bedroom (Master Bedroom on main level); Additional rooms listed as Bedroom 2, Bedroom 3, Bedroom 4
- Bathrooms: 1 full bathroom
- Heating & cooling: Natural gas heating; Heat pump; Central air conditioning
- Interior features: Three total rooms
- Laundry & utility: Laundry room; Gas dryer hookup
Neighborhood map
What this means for you Summary
Snapshot
- This is a 1-bed/1.0-bath other listed at $104k.
Deal economics
- At list price, monthly cash flow is $-16 ($-191/yr) — negative.
- To cash-flow at today's rent, offer at most $101k (2.7% below list).
- To meet the 1% rule (rent ≥ 1% of price), the offer needs to be $100k (3.5% below list).
- Recommended offer: $100k (3.5% below list) — sets the bar for 1% rule.
- Cap rate 6.1% vs local median 3.1% in Braidwood — top-decile yield for the area; either an underpriced asset or a hidden risk that comps aren't pricing in. Stress-test before assuming the spread holds.
Location & tenants
- Location reads 74/100 on livability (#251 in IL, #4,654 nationally) — a middle-class / working-renter tenant base. Strengths: crime A+, cost of living A+, housing A+; Watch: schools D+, amenities F, commute F.
- Reed Custer CUSD 255U (rural): math 29% / reading 37% proficiency, ranked #203 of 620 in IL (top 33%) — families likely to look elsewhere, expect single-tenant / working-renter base with shorter leases.
- Market conditions: 81 active listings in the ZIP; 2,028 units permitted in Will County in 2024 (530 in 5+ unit buildings).
Forward outlook
- Local home prices are declining (-3.0%/yr); year-one equity from $716 of loan paydown is wiped out by about $3k of value loss. Plan a longer hold.
- Will County population projected to shrink 4% by 2050 — rents likely to lag national; underwrite the cash flow, not the appreciation.
Negotiation context
- Only 2 days on market — expect competitive offers; lowballing is unlikely to land.
- 6 sale attempts since 19y ago with the ask held roughly flat each time — persistent listings suggest the price (not the market) is what's stuck; bring a comps-based counter.
- Current owner paid $57k; list at $104k implies a 82% gain — meaningful room to come down on a strong offer.
Questions for the listing agent
- What do current leases actually rent for vs. the listed asking? Can we see a recent rent roll and the last 12 months of T-12 income?
- What does the HOA fee cover, when was the last increase, and are there any pending special assessments or reserve-fund shortfalls?
- Is there a deadline driving the sale (1031 exchange, divorce, estate, relocation)? That informs how much negotiation room exists.
- Schools are D-rated, which usually means shorter tenancies and higher turnover. Who's the typical renter profile here, and what's been the actual vacancy rate?
- The area grade is low — what's the realistic commute time and amenity access for the typical tenant pool here? Any planned neighborhood developments (good or bad) we should know about?
- What's the average days-on-market for RENTAL listings here right now (not sales)? A rising rental-DOM trend means longer vacancies and softer asking-rent achievability than the comps imply.
- What's the recent tenant-quality profile in this submarket — average credit score on applications, eviction rate, late-payment / NSF rate, and stable-employment percentage? A property-management company in the area should have these aggregated.
- How much new for-sale + rental construction is in the pipeline within 1–3 miles? Heavy new supply typically softens prices + rents 12–24 months out; constrained supply supports both.
Investment metrics
- 1% rule
- 0.96% ✗
- Cap rate
- 6.11%
- Cash-on-cash
- -0.66%
- DSCR
- 0.97
- GRM
- 8.6
CMA / ARV
No comps found within radius.
Projected returns pro-forma
-3.0% appreciation · 3.0% rent growth · sell at horizon
- IRR
- -17.3%
- Equity multiple
- 0.39×
- Total profit
- $-17,715
- Equity at exit
- $15,432
- IRR
- -9.1%
- Equity multiple
- 0.43×
- Total profit
- $-16,446
- Equity at exit
- $8,949
Cash invested: $28,980 (down + closing). Projections, not guarantees.
Landlord ↔ Tenant lean methodology
- Overall (STATE)
- 43 Moderately Tenant-Leaning
- State Illinois
- 43 Moderately Tenant-Leaning · D+7
- County
- — inherits STATE
- City
- — inherits STATE
ZIP-level market 60481
- Active inventory
- 81
- Price-to-rent
- 8.6×
Monthly cashflow live
- Estimated rent
- $998 medium interval (Pro) →
- Mortgage (P&I)
- −$543
- Tax from tax record
- −$89 /mo · $1,065/yr
- Insurance
- −$43
- HOA
- −$130
- Vacancy / Maint / Mgmt
- −$210
- Net cashflow
- $-16
Break-even live
UW: 25.0% down · 7.5% · 30yr · 1.5% tax · 5.0% vac · 8.0% maint · 8.0% mgmt
Financing live
Cash to close
- Down payment
- $25,875
- Closing costs
- $3,105
- Reserves months
- —
- Total cash needed
- —
Loan-product check · same deal, 3 products live
Conventional
25% down · 7.5% · 30yr
- Down + closing
- —
- Monthly P&I
- —
- Monthly cashflow
- —
- DSCR
- —
- Eligible?
- —
Personal DTI + credit; lowest rate.
DSCR
20% down · 8.5% · 30yr
- Down + closing
- —
- Monthly P&I
- —
- Monthly cashflow
- —
- DSCR
- —
- Eligible?
- —
No personal income docs; deal must DSCR.
Hard money
10% down · 12.0% · 12mo
- Down + closing
- —
- Monthly P&I
- —
- Monthly cashflow
- —
- DSCR
- —
- Eligible?
- —
Short-term bridge; refi at stabilization.
HOA detail
- Monthly dues
- $130 · $1,560/yr
- Likely covers
- waterelectric
Listing history 3 events
-
2026-06-19days on market $103,500 Active 2 DOM
-
2026-06-17remarks 687-char remark
-
2026-06-17$103,500 Active 1 DOM
ⓘ Source: listings_history table (triggers on properties + properties_extension) + one-shot
backfill from property_details.listing_events for pre-trigger history.
Tax reassessment forecast IL · Partial reset (capped growth)
- Current annual tax
- $1,065 · $89/mo
- Projected year-2 tax
- $1,707 · $142/mo
- Expected delta
- +$642/yr (+$54/mo · 60.3%)
ⓘ Screening estimate from a state-policy table — verify with the county assessor before closing.
Climate risk First Street
- Flood 1/10 Low FEMA zone X (unshaded) · 0% chance over 30 yrs
- Wildfire 1/10 Low
- Heat 3/10 Moderate 7 d/yr ≥103°F today · 16 d/yr by 30 yrs out
- Wind 2/10 Low 100% chance of damaging wind over 30 yrs
- Air quality 2/10 Low 1 unhealthy d/yr today · 2 by 30 yrs out
Nearby sold comps map
Loading sold comps map…
Walkable amenities ~0.75 mi
Loading nearby amenities…
Taxation est. · year 1
- Rental income
- $11,981
- − Mortgage interest
- −$5,798
- − Property taxes
- −$1,065
- − Insurance
- −$518
- − Repairs & maintenance
- −$958
- − Management
- −$958
- − HOA
- −$1,560
- − Depreciation
- −$3,011
- Taxable loss
- −$1,887
- Est. tax savings @ 24.0%
- +$453
- After-tax cash flow
- $262/yr
For passive investors: Depreciation is non-cash, so a rental often shows a tax loss while cash-flowing — sheltering income. Rental losses are passive: they offset passive income freely, and up to $25,000/yr can offset ordinary (W-2) income if you actively participate and your MAGI is under $100k (phasing out to $0 by $150k); unused losses carry forward. On sale, claimed depreciation is recaptured at up to 25%, and gains may owe capital-gains tax (a 1031 exchange can defer both). Figures are a year-1 estimate at your 24.0% rate — not tax advice; consult a CPA.
Schools (NCES district)
- District
- Reed Custer CUSD 255U
- NCES district ID
- 1733380
- Math proficiency
- 29% ▼ -8.00%
- Reading proficiency
- 37% ▼ -12.00%
- Median HH income
- $60,500
- Composite
- 29.67/100
- National rank
- #6461
- State rank
- #203 of 620 in IL
Livability — Braidwood
- Score
- 74/100
- State rank
- #251
- US rank
- #4654
Category grades
Schools grade is shown separately in the Schools card above.
Census & demographics
- Census place
- Braidwood, IL
- City population
- 5,332
- Population (ZIP)
- 11,277
Population outlook (Will County) Hauer SSP2
- Today (2025)
- 705,368 people
- By 2030
- 708,154 · +0.4%
- By 2040
- 702,692 · -0.4%
- By 2050
- 680,249 · -3.6%
- By 2075
- 611,990 · -13.2%
- By 2100
- 516,215 · -26.8%
Race, ethnicity, and origin ACS 2023
- Neighborhood character
- Predominantly White (88%)
- Race & ethnicity
- White 88% Hispanic / Latino 7% Two or more races 4% Black 2%
- Hispanic origin (detail)
- Mexican 5%
- Common ancestry
- Romanian 6% Iranian 3% Lithuanian 2%
- Foreign-born
- 4% · Canada, Dominican Republic
- Languages at home
- 94% English-only · Spanish 4%
Political lean MEDSL · Will
- 2024 margin
- Toss-up / Even · D 50.1% · R 48.5% · Other 1.4%
- 2008→2024 swing
- -11.6pp toward R · 2008: 13.2pp · 2024: 1.6pp
- All cycles
- 2024: D+1.6 2020: D+8.3 2016: D+5.7 2012: D+3.7 2008: D+13.2
Not yet ingested
- Civics
- —
Market trends
- HPI YoY
- ▼ -224.12%
- Current HPI
- 230.6346
- Rent YoY
- —
- Metro
- —
- State GDP YoY
- ▲ 1.59%
- F500 in state
- 60
Industry mix (Fortune 500 HQ in IL)
| Industry | F500 HQs | Revenue |
|---|---|---|
| Insurance | 4 | $201B |
|
||
| Consumer Goods | 4 | $87B |
|
||
| Industrial Machinery | 3 | $64B |
|
||
| Healthcare | 2 | $55B |
|
||
| Retail / Pharmacy | 1 | $148B |
|
||
| Agriculture / Food | 1 | $86B |
|
||
Price history
+113.4% since first listed20 events — show timeline
- 2026-06-17 Listed $103,500 MRED as Distributed by MLS Grid
- 2012-09-27 Listing Removed — MRED as Distributed by MLS Grid
- 2012-07-27 Price Changed — MRED as Distributed by MLS Grid
- 2011-07-27 Listed — MRED as Distributed by MLS Grid
- 2011-07-25 Listing Removed — MRED as Distributed by MLS Grid
- 2011-07-06 Price Changed — MRED as Distributed by MLS Grid
- 2011-04-17 Listed — MRED as Distributed by MLS Grid
- 2011-03-24 Listing Removed — MRED as Distributed by MLS Grid
- 2010-07-24 Price Changed — MRED as Distributed by MLS Grid
- 2010-06-05 Price Changed — MRED as Distributed by MLS Grid
- 2010-03-23 Listed — MRED as Distributed by MLS Grid
- 2007-09-06 Sold (Public Records) $57,000 Public Records
- 2007-08-23 Sold (MLS) $57,000 MRED as Distributed by MLS Grid
- 2007-08-04 Listing Removed — MRED as Distributed by MLS Grid
- 2007-06-08 Listed $62,900 MRED as Distributed by MLS Grid
- 2007-03-06 Sold (Public Records) $46,900 Public Records
- 2007-02-27 Sold (MLS) $46,900 MRED as Distributed by MLS Grid
- 2007-01-19 Listing Removed — MRED as Distributed by MLS Grid
- 2007-01-17 Listed $49,900 MRED as Distributed by MLS Grid
- 2003-07-02 Sold (Public Records) $48,500 Public Records
Property tax history
+1.9%/yrLatest (2024): $1,065 · +14.4% YoY. Source: county tax records.
Cash-flow waterfall
monthlySold comps — $/sqft
last 12 mo · ≤1 miLoading sold comps…