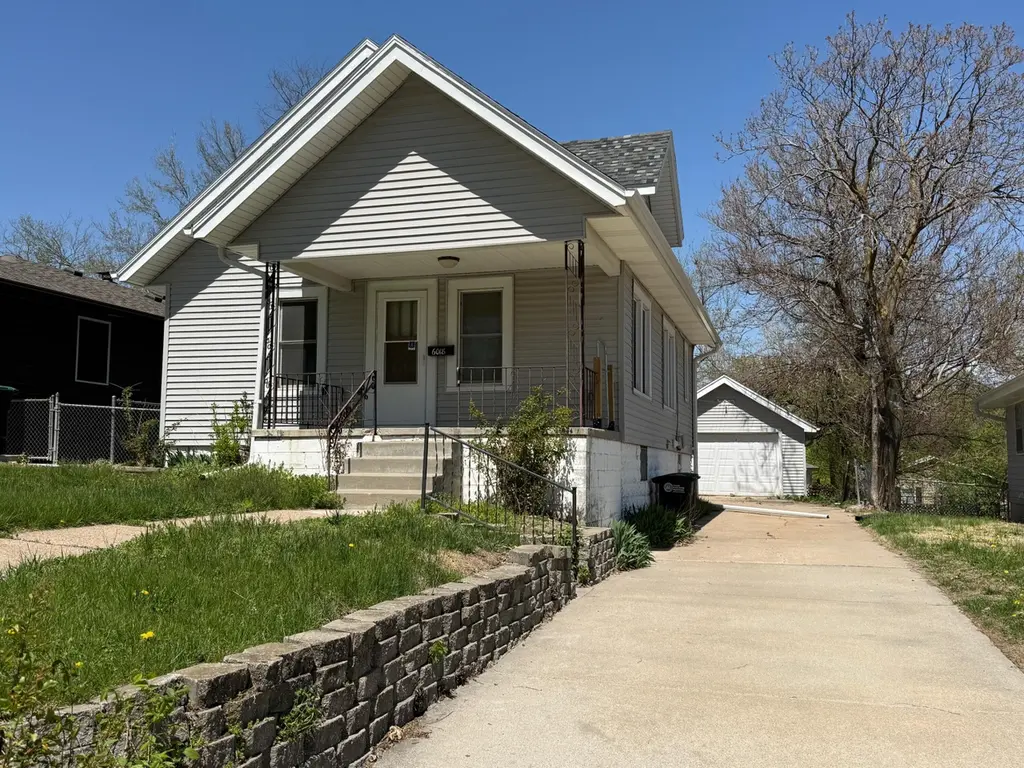
6018 Hamilton St · Omaha, NE
Flood risk 1/10 · Minimal
- FEMA flood zone
- X (unshaded)
- Chance of flooding over 30 yrs
- 0.0%
- Est. flood insurance / yr
- $473 – $860
Fire risk 1/10 · Minimal
- Est. fire insurance / yr
- $1,161 – $2,155
Heat risk 3/10 · Minor
- Hot days now (above 104°F)
- 7 days/yr
- Hot days in 30 yrs
- 15 days/yr
Wind risk 2/10 · Minimal
- Chance of severe wind over 30 yrs
- —
Air-quality risk 2/10 · Minimal
- Unhealthy air days now
- 0 days/yr
- Unhealthy air days in 30 yrs
- 1 days/yr
Risk factors via First Street. Map © Google.
Why this score? — see what drove the C- grade
The composite is a weighted blend of 9 inputs, each scored 0–100. Each bar is that input's sub-score; the figure is the points it added to the 100-point composite (weight × sub-score).
- Cash flow +21.6/30.0
- ARV discount +7.5/15.0
- DSCR +6.9/10.0
- 1% rule +5.1/10.0
- Rent growth +4.7/5.0
- Livability +4.2/5.0
- Condition / age +2.5/5.0
- Schools +2.1/10.0
- Appreciation +0.0/10.0
$149,500
🖨 Deal sheet 📄 Offer letter ✓ Due diligence
Listing remarks MLS
Sold before print- info only
Key facts
- Breaker box
- Newer roof
- Updated windows
Tags
Neighborhood map
What this means for you Summary
Snapshot
- This is a 2-bed/1.0-bath other listed at $150k.
Deal economics
- At list price, monthly cash flow is $228 ($3k/yr) — positive.
- The deal already cash-flows at list — no discount required.
- Meets the 1% rule at list price ($2k rent vs $150k).
- Cap rate 8.1% vs local median 3.6% in Omaha — top-decile yield for the area; either an underpriced asset or a hidden risk that comps aren't pricing in. Stress-test before assuming the spread holds.
Location & tenants
- Location reads 84/100 on livability (#7 in NE, #663 nationally) — a professional / high-income tenant draw. Strengths: amenities A+, commute A+, cost of living A+; Watch: crime F.
- Omaha Public Schools (urban): math 20% / reading 28% proficiency, ranked #110 of 111 in NE (top 99%) — low school quality limits family demand, transient renter base, plan for 1-2y turnover; 62% free/reduced lunch — lower-income household profile, screen leases tightly.
- Zoned schools: Harrison Elementary School (math 57% / reading 57%, grade C+, #136 of 502 statewide, top 31%, 260 students, 0% FRL); Lewis & Clark Middle School (math 23% / reading 35%, grade F, #115 of 128 statewide, top 90%, 860 students, 0% FRL); Benson High School (math 9% / reading 12%, grade F, #257 of 261 statewide, top 98%, 1,570 students, 0% FRL) — zoned schools average 0% FRL vs 62% district-wide (62 pts lower); this property's tenant base skews higher-income than the district average.
- Market conditions: Rents rising fast (+8.9%/yr); 85 active listings in the ZIP; 40 comparable units currently listed for rent nearby; rentals at typical pace (median 24d on market — plan ~3-4 weeks tenant-placement turnaround); 4,539 units permitted in Douglas County in 2024 (2,583 in 5+ unit buildings).
Forward outlook
- Local home prices are declining (-3.0%/yr); year-one equity from $1k of loan paydown is wiped out by about $4k of value loss. Plan a longer hold.
- Douglas County population projected at +28% by 2050 — long-run rental-demand tailwind backs the buy-and-hold thesis.
- At projected returns (-3.0% appreciation + 8.0% rent growth), your $42k cash investment doubles in ~9 years — after that, you're playing with house money.
Negotiation context
- Only 3 days on market — expect competitive offers; lowballing is unlikely to land.
- 2 sale attempts with the ask held roughly flat each time — persistent listings suggest the price (not the market) is what's stuck; bring a comps-based counter.
- Current owner paid $44k; list at $150k implies a 244% gain — meaningful room to come down on a strong offer.
Risks & watch-outs
- Watch-outs: built in 1926 — expect roof / HVAC / electrical / plumbing capex.
Questions for the listing agent
- Built in 1926 — when were the roof, HVAC, electrical panel, plumbing, and water heater last replaced?
- Is there a deadline driving the sale (1031 exchange, divorce, estate, relocation)? That informs how much negotiation room exists.
- Crime grade is F in this area — have there been break-ins, vandalism, or insurance claims at this property in the last 3 years? What carrier currently insures it and at what premium?
- What's the average days-on-market for RENTAL listings here right now (not sales)? A rising rental-DOM trend means longer vacancies and softer asking-rent achievability than the comps imply.
- What's the recent tenant-quality profile in this submarket — average credit score on applications, eviction rate, late-payment / NSF rate, and stable-employment percentage? A property-management company in the area should have these aggregated.
- How much new for-sale + rental construction is in the pipeline within 1–3 miles? Heavy new supply typically softens prices + rents 12–24 months out; constrained supply supports both.
Investment metrics
- 1% rule
- 1.01% ✓
- Cap rate
- 8.12%
- Cash-on-cash
- 6.54%
- DSCR
- 1.29
- GRM
- 8.3
CMA / ARV
No comps found within radius.
Projected returns pro-forma
-3.0% appreciation · 8.0% rent growth · sell at horizon
- IRR
- -1.1%
- Equity multiple
- 0.96×
- Total profit
- $-1,750
- Equity at exit
- $22,291
- IRR
- 13.1%
- Equity multiple
- 2.27×
- Total profit
- $53,356
- Equity at exit
- $12,926
Cash invested: $41,860 (down + closing). Projections, not guarantees.
Landlord ↔ Tenant lean methodology
- Overall (STATE)
- 83 Strongly Landlord-Friendly
- State Nebraska
- 83 Strongly Landlord-Friendly · R+13
- County
- — inherits STATE
- City
- — inherits STATE
ZIP-level market 68132
- Rents YoY
- 8.9%
- Active inventory
- 85
- Price-to-rent
- 8.3×
Monthly cashflow live
- Estimated rent
- $1,507 high interval (Pro) →
- Mortgage (P&I)
- −$784
- Tax from tax record
- −$116 /mo · $1,395/yr
- Insurance
- −$62
- HOA
- −$0
- Vacancy / Maint / Mgmt
- −$317
- Net cashflow
- $228
Break-even live
UW: 25.0% down · 7.5% · 30yr · 1.5% tax · 5.0% vac · 8.0% maint · 8.0% mgmt
Financing live
Cash to close
- Down payment
- $37,375
- Closing costs
- $4,485
- Reserves months
- —
- Total cash needed
- —
Loan-product check · same deal, 3 products live
Conventional
25% down · 7.5% · 30yr
- Down + closing
- —
- Monthly P&I
- —
- Monthly cashflow
- —
- DSCR
- —
- Eligible?
- —
Personal DTI + credit; lowest rate.
DSCR
20% down · 8.5% · 30yr
- Down + closing
- —
- Monthly P&I
- —
- Monthly cashflow
- —
- DSCR
- —
- Eligible?
- —
No personal income docs; deal must DSCR.
Hard money
10% down · 12.0% · 12mo
- Down + closing
- —
- Monthly P&I
- —
- Monthly cashflow
- —
- DSCR
- —
- Eligible?
- —
Short-term bridge; refi at stabilization.
Rent comps 40 comps
| Address | Beds | Baths | Sqft | Rent | $/sqft | DOM | Units | Dist |
|---|---|---|---|---|---|---|---|---|
| 1210 N 60th St Unit 4 Omaha, NE | 2.0 | 1.0 | 900 | $1,400 | $1.56 | 44d | 1 | 0.07mi |
| 6066 Charles St Omaha, NE | 2.0 | 1.0 | 910 | $1,700 | $1.87 | 19d | 1 | 0.10mi |
| 5833 Lafayette Ave Unit 5833 Omaha, NE | 2.0 | 1.0 | 900 | $1,295 | $1.44 | 23d | 1 | 0.11mi |
| 6020 Franklin St Omaha, NE | 3.0 | 1.5 | 1216 | $1,900 | $1.56 | 44d | 1 | 0.22mi |
| 5633 Parker St Omaha, NE | 3.0 | 1.5 | 1200 | $1,695 | $1.41 | 44d | 1 | 0.40mi |
| 6630 Lafayette Ave Omaha, NE | 3.0 | 1.0 | 1650 | $1,800 | $1.09 | 2d | 1 | 0.52mi |
| 2316 N 65th Ave Omaha, NE | 2.0 | 1.5 | 884 | $1,500 | $1.70 | 21d | 1 | 0.68mi |
| 1112 N 50th Ave Omaha, NE | 2.0 | 1.0 | 1200 | $1,450 | $1.21 | 14d | 1 | 0.84mi |
| 2817 N 60th St Unit 2817/02 Omaha, NE | 3.0 | 1.0 | 1188 | $1,500 | $1.26 | 3d | 1 | 0.88mi |
| 2817 N 60th St Unit 2821/02 Omaha, NE | 3.0 | 1.0 | 1188 | $1,045 | $0.88 | 23d | 1 | 0.89mi |
| 5016 California St #12 Omaha, NE | 2.0 | 2.0 | 1084 | $1,600 | $1.48 | 23d | 1 | 0.91mi |
| 4918 California St Omaha, NE | 3.0 | 1.0 | 1369 | $1,695 | $1.24 | 23d | 1 | 1.01mi |
| 6152 Military Ave Omaha, NE | 2.0 | 1.0–2.0 | 785 | $1,599 | $2.04 | 2d | 6 | 1.01mi |
| 1306 N 48th Ave Unit 1313258 Omaha, NE | 2.0 | 1.0 | 994 | $875 | $0.88 | 3d | 1 | 1.02mi |
| 4903 Underwood Ave Unit 11 Omaha, NE | 2.0 | 1.0 | 950 | $1,300 | $1.37 | 44d | 1 | 1.05mi |
| 6990 Dodge St Omaha, NE | 2.0 | 1.0–2.0 | 947 | $1,495 | $1.58 | 3d | 3 | 1.07mi |
| 915 N 48th Ave Apt 15 Omaha, NE | 2.0 | 1.0 | 950 | $990 | $1.04 | 44d | 1 | 1.07mi |
| 4806 Webster St Omaha, NE | 3.0 | 2.5 | 1589 | $2,295 | $1.44 | 3d | 1 | 1.10mi |
| 3204 N 56th St Omaha, NE | 3.0 | 2.0 | 1800 | $1,700 | $0.94 | 10d | 1 | 1.13mi |
| 406 N 49th St Unit 5 Omaha, NE | 2.0 | 2.0 | 1000 | $1,199 | $1.20 | 23d | 1 | 1.13mi |
| 4903 Chicago St Omaha, NE | 1.0–2.0 | 1.0–2.0 | 1100 | $1,250 | $1.14 | 21d | 1 | 1.15mi |
| 7349 Grant St Omaha, NE | 1.0–2.0 | 1.0–2.0 | 967 | $1,350 | $1.40 | 3d | 6 | 1.18mi |
| 4817 Chicago St Unit 11 Omaha, NE | 2.0 | 1.0 | 1250 | $1,195 | $0.96 | 44d | 1 | 1.19mi |
| 7402 Blondo St Omaha, NE | 2.0 | 1.0 | 1000 | $895 | $0.90 | 44d | 1 | 1.19mi |
| 519 S 56th St Omaha, NE | 3.0 | 2.0 | 1474 | $2,600 | $1.76 | 23d | 1 | 1.22mi |
| 3333 N 61st St Unit 3331 Omaha, NE | 2.0 | 1.0 | 1077 | $1,050 | $0.97 | 12d | 1 | 1.23mi |
| 2914 N 49th Ave Omaha, NE | 3.0 | 1.0 | 1375 | $1,615 | $1.17 | 23d | 1 | 1.28mi |
| 6116 Pinkney St Omaha, NE | 3.0 | 1.5 | 1700 | $1,800 | $1.06 | 12d | 1 | 1.29mi |
| 4835 Dodge St Omaha, NE | 2.0 | 1.0–2.0 | 752 | $1,699 | $2.26 | 2d | 4 | 1.31mi |
| 4874 Maple St Omaha, NE | 3.0 | 1.0 | 1098 | $1,545 | $1.41 | 44d | 1 | 1.32mi |
| 6010 Evans St Omaha, NE | 3.0 | 2.0 | 1196 | $1,850 | $1.55 | 23d | 1 | 1.35mi |
| 7602 Parker St Omaha, NE | 3.0 | 2.0 | 1040 | $1,695 | $1.63 | 3d | 1 | 1.36mi |
| 7602 Parker St Omaha, NE | 3.0 | 2.0 | 1050 | $1,700 | $1.62 | 44d | 1 | 1.36mi |
| 7316 Maple St Omaha, NE | 1.0–2.0 | 1.0 | 850 | $1,095 | $1.29 | 44d | 10 | 1.40mi |
| 4647 Dodge St Omaha, NE | 2.0 | 1.0–2.0 | 775 | $2,850 | $3.68 | 23d | 32 | 1.41mi |
| 7311 Wirt Cir Omaha, NE | 1.0–2.0 | 1.0 | 850 | $1,045 | $1.23 | 23d | 11 | 1.43mi |
| 670 S 69th St Omaha, NE | 3.0 | 1.0 | 1014 | $1,650 | $1.63 | 2d | 1 | 1.46mi |
| 7610 Ohio Plz Omaha, NE | 2.0 | 1.0–1.5 | 1050 | $1,138 | $1.08 | 44d | 1 | 1.46mi |
| 201 N 46th St Omaha, NE | 2.0 | 1.0–2.0 | 825 | $1,895 | $2.30 | 3d | 40 | 1.47mi |
| 4623 Douglas St Omaha, NE | 3.0 | 2.0 | 1510 | $1,750 | $1.16 | 21d | 1 | 1.48mi |
Listing history 5 events
-
2026-04-27status Pending
-
2026-04-26historical 28-char remark
Show marketing remark (28 chars)
Sold before print- info only
-
2026-04-24$149,500 New
Show marketing remark (28 chars)
Sold before print- info only
-
2026-04-24$151,000 28-char remark
Show marketing remark (28 chars)
Sold before print- info only
-
1992-04-01soldstatus $43,500
ⓘ Source: listings_history table (triggers on properties + properties_extension) + one-shot
backfill from property_details.listing_events for pre-trigger history.
Tax reassessment forecast NE · Resets to sale price
- Current annual tax
- $1,395 · $116/mo
- Projected year-2 tax
- $2,586 · $216/mo
- Expected delta
- +$1,191/yr (+$99/mo · 85.4%)
ⓘ Screening estimate from a state-policy table — verify with the county assessor before closing.
Climate risk First Street
- Flood 1/10 Low FEMA zone X (unshaded) · 0% chance over 30 yrs
- Wildfire 1/10 Low
- Heat 3/10 Moderate 7 d/yr ≥104°F today · 15 d/yr by 30 yrs out
- Wind 2/10 Low
- Air quality 2/10 Low 0 unhealthy d/yr today · 1 by 30 yrs out
Nearby sold comps map
Loading sold comps map…
Walkable amenities ~0.75 mi
Loading nearby amenities…
Taxation est. · year 1
- Rental income
- $18,086
- − Mortgage interest
- −$8,374
- − Property taxes
- −$1,395
- − Insurance
- −$748
- − Repairs & maintenance
- −$1,447
- − Management
- −$1,447
- − Depreciation
- −$4,349
- Taxable income
- $327
- Est. tax owed @ 24.0%
- −$78
- After-tax cash flow
- $2,659/yr
For passive investors: Depreciation is non-cash, so a rental often shows a tax loss while cash-flowing — sheltering income. Rental losses are passive: they offset passive income freely, and up to $25,000/yr can offset ordinary (W-2) income if you actively participate and your MAGI is under $100k (phasing out to $0 by $150k); unused losses carry forward. On sale, claimed depreciation is recaptured at up to 25%, and gains may owe capital-gains tax (a 1031 exchange can defer both). Figures are a year-1 estimate at your 24.0% rate — not tax advice; consult a CPA.
Schools (NCES district)
- District
- Omaha Public Schools
- NCES district ID
- 3174820
- Math proficiency
- 20% ▼ -10.00%
- Reading proficiency
- 28% ▼ -5.00%
- Median HH income
- $46,039
- Composite
- 20.83/100
- National rank
- #8502
- State rank
- #110 of 111 in NE
Livability — Omaha
- Score
- 84/100
- State rank
- #7
- US rank
- #663
Category grades
Schools grade is shown separately in the Schools card above.
Census & demographics
- Census place
- Omaha, NE
- County
- Douglas County · 538,646 people
- City population
- 552,986
- Metro
- Omaha-Council Bluffs, NE-IA
- Population (ZIP)
- 13,960
- Household income
- $68,221
- Rent vs Own
- Severe rent burden
- 540.0
Population outlook (Douglas County) Hauer SSP2
- Today (2025)
- 625,245 people
- By 2030
- 661,613 · +5.8%
- By 2040
- 732,395 · +17.1%
- By 2050
- 801,988 · +28.3%
- By 2075
- 968,637 · +54.9%
- By 2100
- 1,101,871 · +76.2%
Race, ethnicity, and origin ACS 2023
- Neighborhood character
- Predominantly White (75%)
- Race & ethnicity
- White 75% Hispanic / Latino 11% Black 7% Asian 3% Two or more races 3%
- Hispanic origin (detail)
- Mexican 9%
- Common ancestry
- Lithuanian 4% Romanian 2% Slovak 2%
- Foreign-born
- 9% · United Kingdom, Canada, Philippines
- Languages at home
- 85% English-only · Spanish 8% French/Haitian/Cajun 3% Other Indo-European 1%
Political lean MEDSL · Douglas
- 2024 margin
- D (+10.2) · D 54.4% · R 44.2% · Other 1.4%
- 2008→2024 swing
- +5.5pp toward D · 2008: 4.6pp · 2024: 10.2pp
- All cycles
- 2024: D+10.2 2020: D+11.3 2016: D+1.4 2012: R+4.3 2008: D+4.6
Not yet ingested
- Civics
- —
Market trends
- HPI YoY
- ▼ -388.04%
- Current HPI
- 236.9179
- Rent YoY
- ▲ 8.88%
- Metro
- Omaha-Council Bluffs, NE-IA
- State GDP YoY
- ▲ 0.68%
- F500 in state
- 2
Industry mix (Fortune 500 HQ in NE)
| Industry | F500 HQs | Revenue |
|---|---|---|
| Conglomerate | 1 | $371B |
|
||
Price history
+247.1% since first listed5 events — show timeline
- 2026-04-27 Pending — GPRMLS
- 2026-04-26 Delisted — SWIAR
- 2026-04-24 Listed $151,000 SWIAR
- 2026-04-24 Listed $149,500 GPRMLS
- 1992-04-01 Sold (Public Records) $43,500 Public Records
Property tax history
+0.9%/yrLatest (2015): $1,395 · +0.9% YoY. Source: county tax records.
Cash-flow waterfall
monthlySold comps — $/sqft
last 12 mo · ≤1 miLoading sold comps…