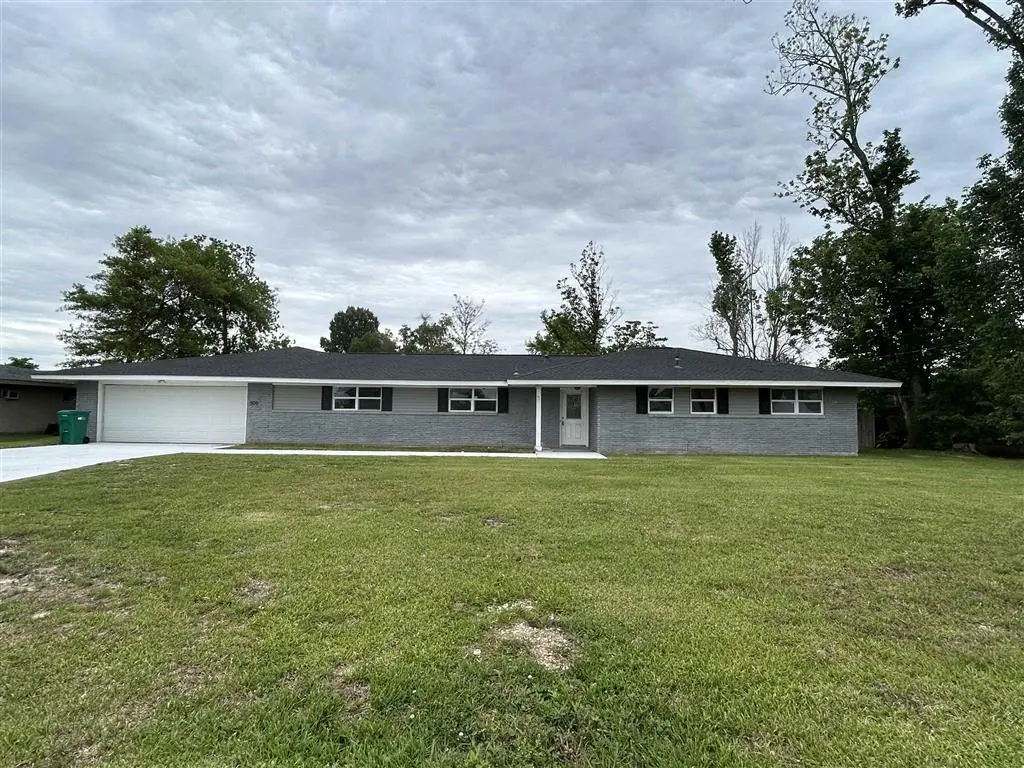
505 N Lebanon St N · Sulphur, LA
Flood risk 3/10 · Minor
- FEMA flood zone
- X (unshaded)
- Chance of flooding over 30 yrs
- 0.1%
- Est. flood insurance / yr
- $507 – $1,088
Fire risk 3/10 · Minor
- Est. fire insurance / yr
- $1,269 – $2,357
Heat risk 9/10 · Severe
- Hot days now (above 109°F)
- 7 days/yr
- Hot days in 30 yrs
- 23 days/yr
Wind risk 9/10 · Severe
- Chance of severe wind over 30 yrs
- 99.0%
Air-quality risk 2/10 · Minimal
- Unhealthy air days now
- 1 days/yr
- Unhealthy air days in 30 yrs
- 1 days/yr
Risk factors via First Street. Map © Google.
Why this score? — see what drove the C+ grade
The composite is a weighted blend of 9 inputs, each scored 0–100. Each bar is that input's sub-score; the figure is the points it added to the 100-point composite (weight × sub-score).
- Cash flow +25.4/30.0
- ARV discount +10.9/15.0
- DSCR +8.4/10.0
- 1% rule +6.0/10.0
- Rent growth +4.4/5.0
- Livability +3.6/5.0
- Schools +3.1/10.0
- Condition / age +2.5/5.0
- Appreciation +0.0/10.0
$225,000
🖨 Deal sheet (PDF) 📄 Offer letter ✓ Due diligence
Listing remarks MLS
Spacious brick home on a slab in an established Sulphur neighborhood. Home features 4 bedrooms, 2.5 baths, two living areas and a large backyard with a fenced in inground pool. Flood zone X. All measurements +/-. Case# 221-598518 HUD OWNED PROPERTY, HUD HOMES ARE SOLD "AS IS", ASK YOUR AGENT FOR DETAILS AND TO SUBMIT OFFERS THROUGH www. hudhomestore.com. * Must have an active NAID number per HUD to show * Must present NAID # when calling to make an appointment.
Key facts
- Large kitchen
- Brick home
- Dining room
Tags
Neighborhood map
What this means for you Summary
Snapshot
- This is a 4-bed/2.5-bath single-family listed at $225k.
Deal economics
- At list price, monthly cash flow is $516 ($6k/yr) — positive.
- The deal already cash-flows at list — no discount required.
- Meets the 1% rule at list price ($2k rent vs $225k).
Location & tenants
- Location reads 71/100 on livability (#48 in LA) — a middle-class / working-renter tenant base. Strengths: cost of living A+, housing A+, health & safety A; Watch: crime D-, amenities F, commute F.
- Calcasieu Parish (other): math 30% / reading 44% proficiency, ranked #29 of 98 in LA (top 30%) — families likely to look elsewhere, expect single-tenant / working-renter base with shorter leases.
- Zoned schools: Maplewood Elementary (math 23% / reading 38%, grade F, #324 of 646 statewide, top 51%, 651 students, 55% FRL); Maplewood Middle School (math 31% / reading 50%, grade F, #62 of 218 statewide, top 29%, 335 students, 50% FRL); Sulphur High School (math 36% / reading 53%, grade F, #58 of 265 statewide, top 23%, 2,043 students, 47% FRL) — zoned schools at 51% FRL track the district average.
- Market conditions: Rents rising fast (+7.7%/yr); 291 active listings in the ZIP; 4 comparable units currently listed for rent nearby; rentals lingering (median 45d on market — plan ~5-8 weeks vacancy on turnover, expect pricing pressure); 75% of comp listings sitting > 30 days — soft ceiling on asking rent; 1,298 units permitted in Calcasieu Parish in 2024 (526 in 5+ unit buildings).
- At $2,468/mo this rent would consume 46% of the median local household income ($65k/yr) (locally 197% of renters already pay >50% of income on rent) — very limited rent-growth headroom before tenants either downsize or default.
Forward outlook
- Local home prices are declining (-3.0%/yr); year-one equity from $2k of loan paydown is wiped out by about $7k of value loss. Plan a longer hold.
- Calcasieu County population projected at +11% by 2050 — modest demand growth; plan on rents tracking national, not racing it.
- At projected returns (-3.0% appreciation + 7.7% rent growth), your $63k cash investment doubles in ~8 years — after that, you're playing with house money.
Negotiation context
- Only 4 days on market — expect competitive offers; lowballing is unlikely to land.
- 5 sale attempts since 12y ago with the ask held roughly flat each time — persistent listings suggest the price (not the market) is what's stuck; bring a comps-based counter.
Risks & watch-outs
- Climate carrying-cost: severe wind risk, 99% chance of damaging wind over 30y; extreme-heat days projected 7→23/yr by 2055 (HVAC capex compounding) — expect insurance premiums to compound above CPI over the hold.
Questions for the listing agent
- Built in 1960 — when were the roof, HVAC, electrical panel, plumbing, and water heater last replaced?
- Is there a deadline driving the sale (1031 exchange, divorce, estate, relocation)? That informs how much negotiation room exists.
- Schools are A-rated — typically a magnet for longer-tenancy family renters. What's the average tenant stay here, and is there a school-zone premium baked into asking?
- Crime grade is D in this area — have there been break-ins, vandalism, or insurance claims at this property in the last 3 years? What carrier currently insures it and at what premium?
- What's the average days-on-market for RENTAL listings here right now (not sales)? A rising rental-DOM trend means longer vacancies and softer asking-rent achievability than the comps imply.
- What's the recent tenant-quality profile in this submarket — average credit score on applications, eviction rate, late-payment / NSF rate, and stable-employment percentage? A property-management company in the area should have these aggregated.
- How much new for-sale + rental construction is in the pipeline within 1–3 miles? Heavy new supply typically softens prices + rents 12–24 months out; constrained supply supports both.
Investment metrics
- 1% rule
- 1.10% ✓
- Cap rate
- 9.04%
- Cash-on-cash
- 9.83%
- DSCR
- 1.44
- GRM
- 7.6
CMA / ARV
- ARV (on-the-fly)
- $243,595
- Comps found
- 12
Show comp detail 12 sales within ~0.75 mi
| Address | Dist | Beds/Ba | Sqft | Sold | Price | $/sf | Match |
|---|---|---|---|---|---|---|---|
| 28 Horseshoe Ln | 0.38mi | 4/2.0 | 2,300 (-3%) | 6mo | $285,000 | $124 | 70 |
| 2715 Saint Francis St | 0.27mi | 5/2.0 (+1) | 2,091 (-12%) | 1mo | $187,500 | $90 | 60 |
| 2618 Roxton St | 0.42mi | 3/2.0 (-1) | 2,190 (-7%) | 2mo | $180,500 | $82 | 60 |
| 2213 Comanche St | 0.58mi | 3/2.0 (-1) | 2,430 (+3%) | 2mo | $90,000 | $37 | 60 |
| 920 Jacques Dr | 0.59mi | 4/3.5 | 2,353 (-0%) | 11mo | $260,000 | $110 | 58 |
| 916 Jacques Dr | 0.61mi | 3/3.0 (-1) | 2,340 (-1%) | 6mo | $317,000 | $135 | 58 |
| 224 S Hazel St S | 0.25mi | 3/2.5 (-1) | 2,715 (+15%) | 5mo | $199,000 | $73 | 54 |
| 1409 Beth St | 0.57mi | 4/2.0 | 2,236 (-6%) | 11mo | $269,000 | $120 | 53 |
| 1004 Jacques Dr | 0.56mi | 4/3.0 | 2,309 (-2%) | 20mo | $269,000 | $117 | 52 |
| 1404 Forest Ln | 0.51mi | 3/3.5 (-1) | 2,232 (-6%) | 11mo | $230,000 | $103 | 48 |
| 320 Rio Hondo St | 0.63mi | 3/2.0 (-1) | 2,445 (+3%) | 18mo | $240,000 | $98 | 43 |
| 322 Quelqueshue St | 0.60mi | 4/2.0 | 2,021 (-14%) | 12mo | $200,000 | $99 | 36 |
Match score weights: distance 35% · size 25% · config 20% · recency 20%. Top-matched comps best support the ARV.
Projected returns pro-forma
-3.0% appreciation · 7.65% rent growth · sell at horizon
- IRR
- 3.3%
- Equity multiple
- 1.13×
- Total profit
- $8,449
- Equity at exit
- $33,548
- IRR
- 16.7%
- Equity multiple
- 2.65×
- Total profit
- $104,133
- Equity at exit
- $19,454
Cash invested: $63,000 (down + closing). Projections, not guarantees.
Landlord ↔ Tenant lean methodology
- Overall (STATE)
- 90 Strongly Landlord-Friendly
- State Louisiana
- 90 Strongly Landlord-Friendly · R+12
- County
- — inherits STATE
- City
- — inherits STATE
ZIP-level market 70663
- Rents YoY
- 7.7%
- Active inventory
- 291
- Price-to-rent
- 7.6×
Monthly cashflow live
- Estimated rent
- $2,468 medium interval (Pro) →
- Mortgage (P&I)
- −$1,180
- Tax from tax record
- −$160 /mo · $1,925/yr
- Insurance
- −$94
- HOA
- −$0
- Vacancy / Maint / Mgmt
- −$518
- Net cashflow
- $516
Break-even live
Sensitivity live
| Price | -10% $643 | -5% $580 | +0% $516 | +5% $452 | +10% $388 |
|---|---|---|---|---|---|
| Rent | -10% $321 | -5% $418 | +0% $516 | +5% $613 | +10% $711 |
| Rate | -1.0pp $629 | -0.5pp $573 | base $516 | +0.5pp $458 | +1.0pp $398 |
UW: 25.0% down · 7.5% · 30yr · 1.5% tax · 5.0% vac · 8.0% maint · 8.0% mgmt
Financing live
Cash to close
- Down payment
- $56,250
- Closing costs
- $6,750
- Reserves months
- —
- Total cash needed
- —
Loan-product check · same deal, 3 products live
Conventional
25% down · 7.5% · 30yr
- Down + closing
- —
- Monthly P&I
- —
- Monthly cashflow
- —
- DSCR
- —
- Eligible?
- —
Personal DTI + credit; lowest rate.
DSCR
20% down · 8.5% · 30yr
- Down + closing
- —
- Monthly P&I
- —
- Monthly cashflow
- —
- DSCR
- —
- Eligible?
- —
No personal income docs; deal must DSCR.
Hard money
10% down · 12.0% · 12mo
- Down + closing
- —
- Monthly P&I
- —
- Monthly cashflow
- —
- DSCR
- —
- Eligible?
- —
Short-term bridge; refi at stabilization.
Rent comps 4 comps
| Address | Beds | Baths | Sqft | Rent | $/sqft | DOM | Units | Dist |
|---|---|---|---|---|---|---|---|---|
| 608 Shady Ln Sulphur, LA | 3.0 | 3.0 | 1903 | $2,200 | $1.16 | 44d | 1 | 0.21mi |
| 1016 Jacques Dr Sulphur, LA | 4.0 | 3.0 | 2350 | $3,000 | $1.28 | 44d | 1 | 0.53mi |
| 103 Jackson Ave Sulphur, LA | 4.0 | 2.0 | 2114 | $4,500 | $2.13 | 44d | 1 | 0.93mi |
| 708 Alabama St Sulphur, LA | 4.0 | 2.5 | 2335 | $2,800 | $1.20 | 21d | 1 | 1.24mi |
Listing history 12 events
-
2026-04-27status Pending
-
2026-04-23$225,000 Active
-
2024-02-20soldstatus 476-char remark
Show marketing remark (476 chars)
Spacious brick home on a slab in an established Sulphur neighborhood. Home features 4 bedrooms, 2.5 baths, two living areas and a large backyard with a fenced in inground pool. Flood zone X. All measurements +/-. Case# 221-598518 HUD OWNED PROPERTY, HUD HOMES ARE SOLD "AS IS", ASK YOUR AGENT FOR DETAILS AND TO SUBMIT OFFERS THROUGH www. hudhomestore.com. * Must have an active NAID number per HUD to show * Must present NAID # when calling to make an appointment.
-
2023-07-12$178,200 476-char remark
Show marketing remark (476 chars)
Spacious brick home on a slab in an established Sulphur neighborhood. Home features 4 bedrooms, 2.5 baths, two living areas and a large backyard with a fenced in inground pool. Flood zone X. All measurements +/-. Case# 221-598518 HUD OWNED PROPERTY, HUD HOMES ARE SOLD "AS IS", ASK YOUR AGENT FOR DETAILS AND TO SUBMIT OFFERS THROUGH www. hudhomestore.com. * Must have an active NAID number per HUD to show * Must present NAID # when calling to make an appointment.
-
2019-06-13soldstatus 382-char remark
Show marketing remark (382 chars)
Large updated home in an established neighborhood. Home has two living area and a large in ground pool that is fenced. Case# 221-537070 HUD OWNED PROPERTY, HUD HOMES ARE SOLD "AS IS", ASK YOUR AGENT FOR DETAILS AND TO SUBMIT OFFERS THROUGH www. hudhomestore.com. * Must have an active NAID number per HUD to show * Must present NAID # when calling to make an appointment.
-
2019-03-20$225,000 382-char remark
Show marketing remark (382 chars)
Large updated home in an established neighborhood. Home has two living area and a large in ground pool that is fenced. Case# 221-537070 HUD OWNED PROPERTY, HUD HOMES ARE SOLD "AS IS", ASK YOUR AGENT FOR DETAILS AND TO SUBMIT OFFERS THROUGH www. hudhomestore.com. * Must have an active NAID number per HUD to show * Must present NAID # when calling to make an appointment.
-
2015-10-08soldstatus $229,000
-
2015-10-07soldstatus
-
2015-05-21$229,900
-
2014-10-24soldstatus
-
2014-10-24soldstatus $85,000
-
2014-10-01$89,900
ⓘ Source: listings_history table (triggers on properties + properties_extension) + one-shot
backfill from property_details.listing_events for pre-trigger history.
Tax reassessment forecast LA · Resets to sale price
- Current annual tax
- $1,925 · $160/mo
- Projected year-2 tax
- $1,925 · $160/mo
- Expected delta
- $0/yr ($0/mo · 0.0%)
ⓘ Screening estimate from a state-policy table — verify with the county assessor before closing.
Climate risk First Street
- Flood 3/10 Moderate FEMA zone X (unshaded) · 10% chance over 30 yrs
- Wildfire 3/10 Moderate
- Heat 9/10 Extreme 7 d/yr ≥109°F today · 23 d/yr by 30 yrs out
- Wind 9/10 Extreme 99% chance of damaging wind over 30 yrs
- Air quality 2/10 Low 1 unhealthy d/yr today · 1 by 30 yrs out
Nearby sold comps map
Loading sold comps map…
Walkable amenities ~0.75 mi
Loading nearby amenities…
Taxation est. · year 1
- Rental income
- $29,620
- − Mortgage interest
- −$12,603
- − Property taxes
- −$1,925
- − Insurance
- −$1,125
- − Repairs & maintenance
- −$2,370
- − Management
- −$2,370
- − Depreciation
- −$6,545
- Taxable income
- $2,682
- Est. tax owed @ 24.0%
- −$644
- After-tax cash flow
- $5,547/yr
For passive investors: Depreciation is non-cash, so a rental often shows a tax loss while cash-flowing — sheltering income. Rental losses are passive: they offset passive income freely, and up to $25,000/yr can offset ordinary (W-2) income if you actively participate and your MAGI is under $100k (phasing out to $0 by $150k); unused losses carry forward. On sale, claimed depreciation is recaptured at up to 25%, and gains may owe capital-gains tax (a 1031 exchange can defer both). Figures are a year-1 estimate at your 24.0% rate — not tax advice; consult a CPA.
Schools (NCES district)
- District
- Calcasieu Parish
- NCES district ID
- 2200330
- Math proficiency
- 30% ▼ -39.00%
- Reading proficiency
- 44% ▼ -33.00%
- Median HH income
- $44,700
- Composite
- 31.45/100
- National rank
- #5979
- State rank
- #29 of 98 in LA
Livability — Sulphur
- Score
- 71/100
- State rank
- #48
- US rank
- #7164
Category grades
Schools grade is shown separately in the Schools card above.
Census & demographics
- Census place
- Sulphur, LA
- County
- Calcasieu Parish · 170,889 people
- City population
- 27,799
- Metro
- Lake Charles, LA
- Population (ZIP)
- 27,799
- Household income
- $64,707
- Rent vs Own
- Severe rent burden
- 197.0
Population outlook (Calcasieu County) Hauer SSP2
- Today (2025)
- 212,179 people
- By 2030
- 218,199 · +2.8%
- By 2040
- 228,486 · +7.7%
- By 2050
- 236,208 · +11.3%
- By 2075
- 251,696 · +18.6%
- By 2100
- 247,848 · +16.8%
Race, ethnicity, and origin ACS 2023
- Neighborhood character
- Predominantly White (82%)
- Race & ethnicity
- White 82% Black 8% Hispanic / Latino 5% Two or more races 4%
- Common ancestry
- Lithuanian 13% Slovak 2% Scandinavian 1%
- Foreign-born
- 3% · Canada, Vietnam
- Languages at home
- 94% English-only · Spanish 2% French/Haitian/Cajun 2% Other Indo-European 1%
Political lean MEDSL · Calcasieu
- 2024 margin
- Solid R (+39.6) · D 29.5% · R 69.0% · Other 1.5%
- 2008→2024 swing
- -15.0pp toward R · 2008: -24.6pp · 2024: -39.6pp
- All cycles
- 2024: R+39.6 2020: R+35.2 2016: R+33.3 2012: R+28.7 2008: R+24.6
Not yet ingested
- Civics
- —
Market trends
- HPI YoY
- ▼ -104.29%
- Current HPI
- 100.0895
- Rent YoY
- ▲ 7.65%
- Metro
- Lake Charles, LA
- State GDP YoY
- ▲ 3.29%
- F500 in state
- 10
Industry mix (Fortune 500 HQ in LA)
| Industry | F500 HQs | Revenue |
|---|---|---|
| Telecommunications | 2 | $23B |
|
||
| Utilities | 1 | $12B |
|
||
| Wholesale / Distribution | 1 | $5B |
|
||
| Advertising | 1 | $2B |
|
||
Price history
+150.3% since first listed12 events — show timeline
- 2026-04-27 Pending — SWLAR
- 2026-04-23 Listed $225,000 SWLAR
- 2024-02-20 Sold (MLS) — SWLAR
- 2023-07-12 Listed $178,200 SWLAR
- 2019-06-13 Sold (MLS) — SWLAR
- 2019-03-20 Listed $225,000 SWLAR
- 2015-10-08 Sold (Public Records) $229,000 Public Records
- 2015-10-07 Sold (MLS) — SWLAR
- 2015-05-21 Listed $229,900 SWLAR
- 2014-10-24 Sold (Public Records) $85,000 Public Records
- 2014-10-24 Sold (MLS) — SWLAR
- 2014-10-01 Listed $89,900 SWLAR
Property tax history
+3.8%/yrLatest (2025): $1,925 · -0.3% YoY. Source: county tax records.
Cash-flow waterfall
monthlySold comps — $/sqft
last 12 mo · ≤1 miLoading sold comps…