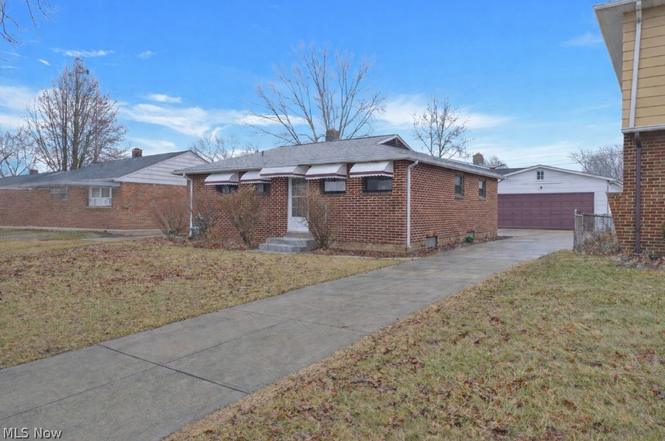
6377 Ledgebrook Dr · Brook Park, OH
Flood risk 1/10 · Minimal
- FEMA flood zone
- X (unshaded)
- Chance of flooding over 30 yrs
- 0.0%
- Est. flood insurance / yr
- $473 – $860
Fire risk 1/10 · Minimal
- Est. fire insurance / yr
- $713 – $1,323
Heat risk 3/10 · Minor
- Hot days now (above 96°F)
- 7 days/yr
- Hot days in 30 yrs
- 16 days/yr
Wind risk 1/10 · Minimal
- Chance of severe wind over 30 yrs
- —
Air-quality risk 2/10 · Minimal
- Unhealthy air days now
- 1 days/yr
- Unhealthy air days in 30 yrs
- 3 days/yr
Risk factors via First Street. Map © Google.
Why this score? — see what drove the C- grade
The composite is a weighted blend of 9 inputs, each scored 0–100. Each bar is that input's sub-score; the figure is the points it added to the 100-point composite (weight × sub-score).
- Cash flow +21.4/30.0
- DSCR +6.8/10.0
- 1% rule +5.3/10.0
- Schools +4.4/10.0
- ARV discount +3.8/15.0
- Livability +3.7/5.0
- Rent growth +2.5/5.0
- Condition / age +2.5/5.0
- Appreciation +0.0/10.0
$240,000
🖨 Deal sheet (PDF) 📄 Offer letter ✓ Due diligence
Listing remarks
Welcome to this beautiful 2 bedroom, 2 full bathroom brick ranch in Brook Park! This features a large sized 2-car garage with additional storage space and a shed in the back with a long concrete extended driveway and a nice closed in 3 seasons porch along with a new roof and gutters! As you walk in you will notice the refinished and well maintained hardwood flooring throughout the 1st floor bedrooms, living room and dining room. The kitchen has large luxury tile flooring, brown cabinetry, butcher block countertops and a full stainless steel appliances set with a separate breakfast bar area that opens nicely into the dining room and the front living room! Through the dining room you will see
Key facts
- Shed
- 2 car garage
- New roof
Tags
Neighborhood map
What this means for you Summary
Snapshot
- This is a 2-bed/1.0-bath single-family listed at $240k.
Deal economics
- At list price, monthly cash flow is $355 ($4k/yr) — positive.
- The deal already cash-flows at list — no discount required.
- Meets the 1% rule at list price ($2k rent vs $240k).
- Recommended offer: $233k (3.0% below list) — sets the bar for market timing.
- Cap rate 8.1% vs local median 5.2% in Brook Park — top-decile yield for the area; either an underpriced asset or a hidden risk that comps aren't pricing in. Stress-test before assuming the spread holds.
Location & tenants
- Location reads 74/100 on livability (#273 in OH, #4,475 nationally) — a middle-class / working-renter tenant base. Strengths: crime A+, cost of living A+, housing A+; Watch: employment D+, health & safety D, amenities F.
- Berea City (suburban): math 47% / reading 56% proficiency, ranked #414 of 656 in OH (top 63%) — acceptable for families but not a draw, mixed tenant base, ~2y average lease.
- Zoned schools: Brook Park Elementary School (math 69% / reading 59%, grade B, #564 of 1,584 statewide, top 36%, 947 students, 36% FRL); Berea-Midpark Middle School (math 43% / reading 52%, grade C-, #444 of 654 statewide, top 69%, 1,556 students, 0% FRL); Berea-Midpark High School (math 28% / reading 60%, grade F, #489 of 781 statewide, top 63%, 1,850 students, 29% FRL) — zoned schools at 22% FRL track the district average.
- Market conditions: 44 active listings in the ZIP; 3 comparable units currently listed for rent nearby; rentals lingering (median 45d on market — plan ~5-8 weeks vacancy on turnover, expect pricing pressure); 67% of comp listings sitting > 30 days — soft ceiling on asking rent; 1,441 units permitted in Cuyahoga County in 2024 (700 in 5+ unit buildings).
- This rent runs 41% of the median local income ($71k/yr) — at the standard rent-burdened threshold; future hikes will face affordability resistance.
Forward outlook
- Local home prices are declining (-3.0%/yr); year-one equity from $2k of loan paydown is wiped out by about $7k of value loss. Plan a longer hold.
- Cuyahoga County population projected to shrink 8% by 2050 — rents likely to lag national; underwrite the cash flow, not the appreciation.
Negotiation context
- It's been on market 57 days — a 3% lower offer ($233k) is reasonable based on typical stale-listing flexibility.
- Current owner paid $66k; list at $240k implies a 264% gain — meaningful room to come down on a strong offer.
Questions for the listing agent
- It's been on market 57 days. Have you received any prior offers? Is the seller open to a 3% concession, seller financing, or rate buy-down credit?
- Built in 1961 — when were the roof, HVAC, electrical panel, plumbing, and water heater last replaced?
- Is there a deadline driving the sale (1031 exchange, divorce, estate, relocation)? That informs how much negotiation room exists.
- Schools are B-rated — typically a magnet for longer-tenancy family renters. What's the average tenant stay here, and is there a school-zone premium baked into asking?
- What's the average days-on-market for RENTAL listings here right now (not sales)? A rising rental-DOM trend means longer vacancies and softer asking-rent achievability than the comps imply.
- What's the recent tenant-quality profile in this submarket — average credit score on applications, eviction rate, late-payment / NSF rate, and stable-employment percentage? A property-management company in the area should have these aggregated.
- How much new for-sale + rental construction is in the pipeline within 1–3 miles? Heavy new supply typically softens prices + rents 12–24 months out; constrained supply supports both.
Investment metrics
- 1% rule
- 1.03% ✓
- Cap rate
- 8.07%
- Cash-on-cash
- 6.34%
- DSCR
- 1.28
- GRM
- 8.1
CMA / ARV
- ARV (on-the-fly)
- $221,859
- Comps found
- 12
Show comp detail 12 sales within ~0.75 mi
| Address | Dist | Beds/Ba | Sqft | Sold | Price | $/sf | Match |
|---|---|---|---|---|---|---|---|
| 6330 Sandfield Dr | 0.07mi | 3/1.5 (+1) | 891 (0%) | 1mo | $235,000 | $264 | 89 |
| 6330 Ledgebrook Dr | 0.07mi | 3/1.0 (+1) | 884 (-1%) | 2mo | $225,000 | $255 | 88 |
| 6330 Stonecrest Dr | 0.11mi | 3/2.0 (+1) | 884 (-1%) | 1mo | $149,900 | $170 | 84 |
| 6448 Delores Blvd | 0.18mi | 3/1.0 (+1) | 884 (-1%) | 2mo | $175,000 | $198 | 84 |
| 15425 Richard Dr | 0.21mi | 3/2.0 (+1) | 972 (+9%) | 1mo | $245,000 | $252 | 66 |
| 6719 Smith Rd | 0.59mi | 2/1.0 | 910 (+2%) | 5mo | $167,700 | $184 | 65 |
| 15995 Paulding Blvd | 0.53mi | 3/2.0 (+1) | 912 (+2%) | 2mo | $237,500 | $260 | 61 |
| 6330 Michael Dr | 0.45mi | 3/1.5 (+1) | 936 (+5%) | 6mo | $215,000 | $230 | 58 |
| 6065 Mercer Dr | 0.66mi | 2/2.0 | 936 (+5%) | 2mo | $232,900 | $249 | 55 |
| 6361 Smith Rd | 0.26mi | 3/2.0 (+1) | 1,000 (+12%) | 5mo | $206,000 | $206 | 54 |
| 6131 Hardin Dr | 0.53mi | 3/2.0 (+1) | 972 (+9%) | 4mo | $230,000 | $237 | 48 |
| 15532 Rademaker Dr | 0.73mi | 3/2.0 (+1) | 936 (+5%) | 3mo | $255,000 | $272 | 46 |
Match score weights: distance 35% · size 25% · config 20% · recency 20%. Top-matched comps best support the ARV.
Projected returns pro-forma
-3.0% appreciation · 3.0% rent growth · sell at horizon
- IRR
- -6.5%
- Equity multiple
- 0.76×
- Total profit
- $-16,297
- Equity at exit
- $35,785
- IRR
- 3.1%
- Equity multiple
- 1.22×
- Total profit
- $14,891
- Equity at exit
- $20,751
Cash invested: $67,200 (down + closing). Projections, not guarantees.
Landlord ↔ Tenant lean methodology
- Overall (STATE)
- 73 Landlord-Friendly
- State Ohio
- 73 Landlord-Friendly · R+6
- County
- — inherits STATE
- City
- — inherits STATE
ZIP-level market 44142
- Active inventory
- 44
- Price-to-rent
- 8.1×
Monthly cashflow live
- Estimated rent
- $2,465 medium interval (Pro) →
- Mortgage (P&I)
- −$1,259
- Tax from tax record
- −$234 /mo · $2,808/yr
- Insurance
- −$100
- HOA
- −$0
- Vacancy / Maint / Mgmt
- −$518
- Net cashflow
- $355
Break-even live
Sensitivity live
| Price | -10% $491 | -5% $423 | +0% $355 | +5% $287 | +10% $219 |
|---|---|---|---|---|---|
| Rent | -10% $160 | -5% $257 | +0% $355 | +5% $452 | +10% $550 |
| Rate | -1.0pp $476 | -0.5pp $416 | base $355 | +0.5pp $293 | +1.0pp $229 |
UW: 25.0% down · 7.5% · 30yr · 1.5% tax · 5.0% vac · 8.0% maint · 8.0% mgmt
Financing live
Cash to close
- Down payment
- $60,000
- Closing costs
- $7,200
- Reserves months
- —
- Total cash needed
- —
Loan-product check · same deal, 3 products live
Conventional
25% down · 7.5% · 30yr
- Down + closing
- —
- Monthly P&I
- —
- Monthly cashflow
- —
- DSCR
- —
- Eligible?
- —
Personal DTI + credit; lowest rate.
DSCR
20% down · 8.5% · 30yr
- Down + closing
- —
- Monthly P&I
- —
- Monthly cashflow
- —
- DSCR
- —
- Eligible?
- —
No personal income docs; deal must DSCR.
Hard money
10% down · 12.0% · 12mo
- Down + closing
- —
- Monthly P&I
- —
- Monthly cashflow
- —
- DSCR
- —
- Eligible?
- —
Short-term bridge; refi at stabilization.
Rent comps 3 comps
| Address | Beds | Baths | Sqft | Rent | $/sqft | DOM | Units | Dist |
|---|---|---|---|---|---|---|---|---|
| 16261 Remora Blvd Brook Park, OH | 3.0 | 1.0 | 936 | $1,750 | $1.87 | 45d | 1 | 0.87mi |
| 6333 W 130th St Cleveland, OH | 3.0 | 2.0 | 1020 | $2,000 | $1.96 | 45d | 1 | 1.30mi |
| 6536 Lawnwood Ave Unit 1496105P Parma Heights, OH | 3.0 | 2.0 | 1087 | $6,186 | $5.69 | 3d | 1 | 1.42mi |
Listing history 13 events
-
2026-06-21days on market $240,000 Active 57 DOM
-
2026-06-18days on market $240,000 Active 54 DOM
-
2026-06-17days on market $240,000 Active 53 DOM
-
2026-06-16days on market $240,000 Active 52 DOM
-
2026-06-15days on market $240,000 Active 51 DOM
-
2026-06-13days on market $240,000 Active 49 DOM
-
2026-06-13days on market $240,000 Active 48 DOM
-
2026-06-10status $240,000 Active 45 DOM
-
2026-04-10status Pending
-
2026-03-31price $240,000
-
2026-03-14price $250,000
-
2026-02-24$260,000 Active
-
1988-05-26soldstatus $66,000
ⓘ Source: listings_history table (triggers on properties + properties_extension) + one-shot
backfill from property_details.listing_events for pre-trigger history.
Tax reassessment forecast OH · Partial reset (capped growth)
- Current annual tax
- $2,808 · $234/mo
- Projected year-2 tax
- $3,276 · $273/mo
- Expected delta
- +$468/yr (+$39/mo · 16.7%)
ⓘ Screening estimate from a state-policy table — verify with the county assessor before closing.
Climate risk First Street
- Flood 1/10 Low FEMA zone X (unshaded) · 0% chance over 30 yrs
- Wildfire 1/10 Low
- Heat 3/10 Moderate 7 d/yr ≥96°F today · 16 d/yr by 30 yrs out
- Wind 1/10 Low
- Air quality 2/10 Low 1 unhealthy d/yr today · 3 by 30 yrs out
Nearby sold comps map
Loading sold comps map…
Walkable amenities ~0.75 mi
Loading nearby amenities…
Taxation est. · year 1
- Rental income
- $29,580
- − Mortgage interest
- −$13,444
- − Property taxes
- −$2,808
- − Insurance
- −$1,200
- − Repairs & maintenance
- −$2,366
- − Management
- −$2,366
- − Depreciation
- −$6,982
- Taxable income
- $414
- Est. tax owed @ 24.0%
- −$99
- After-tax cash flow
- $4,158/yr
For passive investors: Depreciation is non-cash, so a rental often shows a tax loss while cash-flowing — sheltering income. Rental losses are passive: they offset passive income freely, and up to $25,000/yr can offset ordinary (W-2) income if you actively participate and your MAGI is under $100k (phasing out to $0 by $150k); unused losses carry forward. On sale, claimed depreciation is recaptured at up to 25%, and gains may owe capital-gains tax (a 1031 exchange can defer both). Figures are a year-1 estimate at your 24.0% rate — not tax advice; consult a CPA.
Schools (NCES district)
- District
- Berea City
- NCES district ID
- 3904360
- Math proficiency
- 47% ▼ -17.00%
- Reading proficiency
- 56% ▼ -7.00%
- Median HH income
- $51,921
- Composite
- 44.18/100
- National rank
- #2856
- State rank
- #414 of 656 in OH
Livability — Brook Park
- Score
- 74/100
- State rank
- #273
- US rank
- #4475
Category grades
Schools grade is shown separately in the Schools card above.
Census & demographics
- Census place
- Brook Park, OH
- County
- Cuyahoga County · 1,090,369 people
- City population
- 18,359
- Metro
- Cleveland-Elyria, OH
- Population (ZIP)
- 18,284
- Household income
- $71,332
- Rent vs Own
- Severe rent burden
- 275.0
Population outlook (Cuyahoga County) Hauer SSP2
- Today (2025)
- 1,244,621 people
- By 2030
- 1,230,093 · -1.2%
- By 2040
- 1,189,108 · -4.5%
- By 2050
- 1,145,706 · -7.9%
- By 2075
- 1,076,557 · -13.5%
- By 2100
- 978,987 · -21.3%
Race, ethnicity, and origin ACS 2023
- Neighborhood character
- Predominantly White (83%)
- Race & ethnicity
- White 83% Hispanic / Latino 6% Black 6% Two or more races 5% Asian 2%
- Hispanic origin (detail)
- Mexican 2% Puerto Rican 2%
- Common ancestry
- Romanian 11% Subsaharan African 2% Scotch-Irish 1%
- Foreign-born
- 5% · Canada, India, China
- Languages at home
- 93% English-only · Spanish 2% Other Indo-European 2% Russian/Polish/Slavic 1%
Political lean MEDSL · Cuyahoga
- 2024 margin
- Solid D (+31.5) · D 65.4% · R 33.9%
- 2008→2024 swing
- -7.4pp toward R · 2008: 38.9pp · 2024: 31.5pp
- All cycles
- 2024: D+31.5 2020: D+34.1 2016: D+35.0 2012: D+38.7 2008: D+38.9
Not yet ingested
- Civics
- —
Market trends
- HPI YoY
- ▼ -177.54%
- Current HPI
- 193.7004
- Rent YoY
- —
- Metro
- Cleveland-Elyria, OH
- State GDP YoY
- ▲ 1.98%
- F500 in state
- 48
Industry mix (Fortune 500 HQ in OH)
| Industry | F500 HQs | Revenue |
|---|---|---|
| Insurance | 3 | $145B |
|
||
| Industrial Machinery | 3 | $49B |
|
||
| Financial Services | 3 | $24B |
|
||
| Consumer Goods | 2 | $93B |
|
||
| Aerospace / Defense | 2 | $47B |
|
||
| Utilities | 2 | $33B |
|
||
Price history
+263.6% since first listed5 events — show timeline
- 2026-04-10 Pending — MLSNOW
- 2026-03-31 Price Changed $240,000 MLSNOW
- 2026-03-14 Price Changed $250,000 MLSNOW
- 2026-02-24 Listed $260,000 MLSNOW
- 1988-05-26 Sold (Public Records) $66,000 Public Records
Property tax history
+2.0%/yrLatest (2025): $2,808 · -0.6% YoY. Source: county tax records.
Cash-flow waterfall
monthlySold comps — $/sqft
last 12 mo · ≤1 miLoading sold comps…