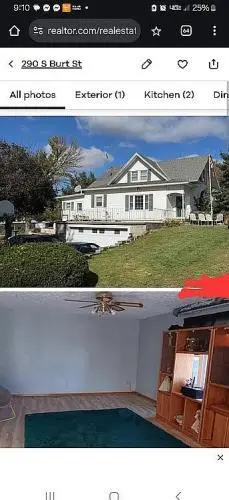
290 S Burt St · Craig, NE
Flood risk 1/10 · Minimal
- FEMA flood zone
- X (unshaded)
- Chance of flooding over 30 yrs
- 0.0%
- Est. flood insurance / yr
- $473 – $860
Fire risk 1/10 · Minimal
- Est. fire insurance / yr
- $1,161 – $2,155
Heat risk 3/10 · Minor
- Hot days now (above 103°F)
- 7 days/yr
- Hot days in 30 yrs
- 15 days/yr
Wind risk 2/10 · Minimal
- Chance of severe wind over 30 yrs
- —
Air-quality risk 1/10 · Minimal
- Unhealthy air days now
- 0 days/yr
- Unhealthy air days in 30 yrs
- 0 days/yr
Risk factors via First Street. Map © Google.
Why this score? — see what drove the B+ grade
The composite is a weighted blend of 9 inputs, each scored 0–100. Each bar is that input's sub-score; the figure is the points it added to the 100-point composite (weight × sub-score).
- Cash flow +25.7/30.0
- ARV discount +15.0/15.0
- Appreciation +10.0/10.0
- DSCR +8.6/10.0
- 1% rule +6.5/10.0
- Schools +4.7/10.0
- Livability +2.9/5.0
- Rent growth +2.5/5.0
- Condition / age +2.5/5.0
$125,000
🖨 Deal sheet (PDF) 📄 Offer letter ✓ Due diligence
Listing remarks MLS
This is a amazing home. 3 bedrooms . And a kitchen on on main. Downstairs has a newly remodeled bathroom. And another bedroom. And yep another kitchen. Has a 2 car garage. On the large lot it also has a 1 car garage. And u can have chickens. Currently rented for 1400 a month
Key facts
- Large lot
- Kitchen on main
- Built 1910
Tags
Neighborhood map
What this means for you Summary
Snapshot
- This is a 4-bed/3.0-bath single-family listed at $125k.
Deal economics
- At list price, monthly cash flow is $299 ($4k/yr) — positive.
- The deal already cash-flows at list — no discount required.
- Meets the 1% rule at list price ($1k rent vs $125k).
- Recommended offer: $110k (12.0% below list) — sets the bar for market timing.
Location & tenants
- Location reads 58/100 on livability (#495 in NE) — a working-class tenant base; expect higher turnover. Strengths: cost of living A+, housing A+; Watch: crime C-, amenities F, commute F.
- Oakland Craig Public Schools (rural): math 55% / reading 55% proficiency, ranked #39 of 111 in NE (top 35%) — acceptable for families but not a draw, mixed tenant base, ~2y average lease.
- Zoned schools: Oakland Craig Elementary (math 47% / reading 52%, grade D, #233 of 502 statewide, top 52%, 223 students, 15% FRL); Oakland Craig Junior-Senior High (math 62% / reading 57%, grade C+, #49 of 261 statewide, top 26%, 193 students, 4% FRL) — zoned schools average 9% FRL vs 27% district-wide (18 pts lower); this property's tenant base skews higher-income than the district average.
- Market conditions: 2 active listings in the ZIP; 15 units permitted in Burt County in 2024 (0 in 5+ unit buildings).
Forward outlook
- In year one you build about $13k of equity ($864 loan paydown + $12k appreciation (10.0% local appreciation)).
- Burt County population projected at -18% by 2050 — secular population decline; favor cash flow + early exit over multi-decade hold.
- At projected returns (10.0% appreciation + 3.0% rent growth), your $35k cash investment doubles in ~2 years — after that, you're playing with house money.
- By year 3, paydown + projected appreciation supports a ~$34k cash-out refi (75% LTV) — recoverable capital for the next deal without selling this one.
Negotiation context
- It's been on market 181 days — a 12% lower offer ($110k) is reasonable based on typical stale-listing flexibility.
- 5 sale attempts since 2y ago with the ask held roughly flat each time — persistent listings suggest the price (not the market) is what's stuck; bring a comps-based counter.
- Current owner paid $58k; list at $125k implies a 116% gain — meaningful room to come down on a strong offer.
Risks & watch-outs
- Watch-outs: built in 1910 — expect roof / HVAC / electrical / plumbing capex.
Questions for the listing agent
- It's been on market 181 days. Have you received any prior offers? Is the seller open to a 12% concession, seller financing, or rate buy-down credit?
- Built in 1910 — when were the roof, HVAC, electrical panel, plumbing, and water heater last replaced?
- Why hasn't it sold? Are there any deal-killer items the seller is aware of (foundation, flood, title, zoning, code violations)?
- Is there a deadline driving the sale (1031 exchange, divorce, estate, relocation)? That informs how much negotiation room exists.
- Schools are F-rated, which usually means shorter tenancies and higher turnover. Who's the typical renter profile here, and what's been the actual vacancy rate?
- What's the average days-on-market for RENTAL listings here right now (not sales)? A rising rental-DOM trend means longer vacancies and softer asking-rent achievability than the comps imply.
- What's the recent tenant-quality profile in this submarket — average credit score on applications, eviction rate, late-payment / NSF rate, and stable-employment percentage? A property-management company in the area should have these aggregated.
- How much new for-sale + rental construction is in the pipeline within 1–3 miles? Heavy new supply typically softens prices + rents 12–24 months out; constrained supply supports both.
Investment metrics
- 1% rule
- 1.15% ✓
- Cap rate
- 9.16%
- Cash-on-cash
- 10.24%
- DSCR
- 1.46
- GRM
- 7.2
CMA / ARV
- ARV (median comp)
- $242,226
- List price
- $125,000
- Delta
- -48.40%
- Verdict
- UNDERPRICED
- Comps
- 1 within 2.0 mi
Projected returns pro-forma
10.0% appreciation · 3.0% rent growth · sell at horizon
- IRR
- 31.8%
- Equity multiple
- 3.49×
- Total profit
- $87,102
- Equity at exit
- $112,610
- IRR
- 27.5%
- Equity multiple
- 7.90×
- Total profit
- $241,557
- Equity at exit
- $242,848
Cash invested: $35,000 (down + closing). Projections, not guarantees.
Landlord ↔ Tenant lean methodology
- Overall (STATE)
- 83 Strongly Landlord-Friendly
- State Nebraska
- 83 Strongly Landlord-Friendly · R+13
- County
- — inherits STATE
- City
- — inherits STATE
ZIP-level market 68019
- Home prices YoY
- 4.1%
- Active inventory
- 2
- Price-to-rent
- 7.2×
Monthly cashflow live
- Estimated rent
- $1,438 medium interval (Pro) →
- Mortgage (P&I)
- −$656
- Tax from tax record
- −$130 /mo · $1,557/yr
- Insurance
- −$52
- HOA
- −$0
- Vacancy / Maint / Mgmt
- −$302
- Net cashflow
- $299
Break-even live
Sensitivity live
| Price | -10% $369 | -5% $334 | +0% $299 | +5% $263 | +10% $228 |
|---|---|---|---|---|---|
| Rent | -10% $185 | -5% $242 | +0% $299 | +5% $355 | +10% $412 |
| Rate | -1.0pp $362 | -0.5pp $330 | base $299 | +0.5pp $266 | +1.0pp $233 |
UW: 25.0% down · 7.5% · 30yr · 1.5% tax · 5.0% vac · 8.0% maint · 8.0% mgmt
Financing live
Cash to close
- Down payment
- $31,250
- Closing costs
- $3,750
- Reserves months
- —
- Total cash needed
- —
Loan-product check · same deal, 3 products live
Conventional
25% down · 7.5% · 30yr
- Down + closing
- —
- Monthly P&I
- —
- Monthly cashflow
- —
- DSCR
- —
- Eligible?
- —
Personal DTI + credit; lowest rate.
DSCR
20% down · 8.5% · 30yr
- Down + closing
- —
- Monthly P&I
- —
- Monthly cashflow
- —
- DSCR
- —
- Eligible?
- —
No personal income docs; deal must DSCR.
Hard money
10% down · 12.0% · 12mo
- Down + closing
- —
- Monthly P&I
- —
- Monthly cashflow
- —
- DSCR
- —
- Eligible?
- —
Short-term bridge; refi at stabilization.
Listing history 33 events
-
2026-06-21days on market $125,000 Active 181 DOM
-
2026-06-21days on market $125,000 Active 180 DOM
-
2026-06-18days on market $125,000 Active 178 DOM
-
2026-06-17days on market $125,000 Active 177 DOM
-
2026-06-16days on market $125,000 Active 176 DOM
-
2026-06-15days on market $125,000 Active 175 DOM
-
2026-06-13days on market $125,000 Active 173 DOM
-
2026-06-12days on market $125,000 Active 172 DOM
-
2026-06-09days on market $125,000 Active 169 DOM
-
2026-06-08days on market $125,000 Active 168 DOM
-
2026-06-07days on market $125,000 Active 167 DOM
-
2026-06-07days on market $125,000 Active 166 DOM
-
2026-06-04days on market $125,000 Active 163 DOM
-
2026-06-02days on market $125,000 Active 162 DOM
-
2026-06-01days on market $125,000 Active 161 DOM
-
2026-05-31days on market $125,000 Active 160 DOM
-
2025-12-18$125,000 Active 275-char remark
Show marketing remark (275 chars)
This is a amazing home. 3 bedrooms . And a kitchen on on main. Downstairs has a newly remodeled bathroom. And another bedroom. And yep another kitchen. Has a 2 car garage. On the large lot it also has a 1 car garage. And u can have chickens. Currently rented for 1400 a month
-
2025-11-21historical
-
2025-11-06price $130,000
-
2025-10-21$150,000 New
-
2025-10-21soldstatus $58,000
-
2025-04-16historical
-
2025-04-10price $89,900
-
2025-03-24price $99,900
-
2025-03-03price $125,000
-
2024-11-24status Back On Market
-
2024-10-18status Pending
-
2024-10-15$129,000 New
-
2024-10-03historical
-
2024-07-20price $130,000
-
2024-06-16price $135,000
-
2024-06-01$139,000 New
-
2014-01-22soldstatus $54,000
ⓘ Source: listings_history table (triggers on properties + properties_extension) + one-shot
backfill from property_details.listing_events for pre-trigger history.
Tax reassessment forecast NE · Resets to sale price
- Current annual tax
- $1,557 · $130/mo
- Projected year-2 tax
- $2,162 · $180/mo
- Expected delta
- +$606/yr (+$50/mo · 38.9%)
ⓘ Screening estimate from a state-policy table — verify with the county assessor before closing.
Climate risk First Street
- Flood 1/10 Low FEMA zone X (unshaded) · 0% chance over 30 yrs
- Wildfire 1/10 Low
- Heat 3/10 Moderate 7 d/yr ≥103°F today · 15 d/yr by 30 yrs out
- Wind 2/10 Low
- Air quality 1/10 Low 0 unhealthy d/yr today · 0 by 30 yrs out
Nearby sold comps map
Loading sold comps map…
Walkable amenities ~0.75 mi
Loading nearby amenities…
Taxation est. · year 1
- Rental income
- $17,255
- − Mortgage interest
- −$7,002
- − Property taxes
- −$1,557
- − Insurance
- −$625
- − Repairs & maintenance
- −$1,380
- − Management
- −$1,380
- − Depreciation
- −$3,636
- Taxable income
- $1,674
- Est. tax owed @ 24.0%
- −$402
- After-tax cash flow
- $3,182/yr
For passive investors: Depreciation is non-cash, so a rental often shows a tax loss while cash-flowing — sheltering income. Rental losses are passive: they offset passive income freely, and up to $25,000/yr can offset ordinary (W-2) income if you actively participate and your MAGI is under $100k (phasing out to $0 by $150k); unused losses carry forward. On sale, claimed depreciation is recaptured at up to 25%, and gains may owe capital-gains tax (a 1031 exchange can defer both). Figures are a year-1 estimate at your 24.0% rate — not tax advice; consult a CPA.
Schools (NCES district)
- District
- Oakland Craig Public Schools
- NCES district ID
- 3174640
- Math proficiency
- 55% ▼ -6.00%
- Reading proficiency
- 55% ▼ -2.00%
- Median HH income
- $50,268
- Composite
- 46.97/100
- National rank
- #2354
- State rank
- #39 of 111 in NE
Livability — Craig
- Score
- 58/100
- State rank
- #495
- US rank
- #21262
Category grades
Schools grade is shown separately in the Schools card above.
Census & demographics
- Census place
- Craig, NE
- Population (ZIP)
- 441
Population outlook (Burt County) Hauer SSP2
- Today (2025)
- 6,136 people
- By 2030
- 5,896 · -3.9%
- By 2040
- 5,446 · -11.2%
- By 2050
- 5,044 · -17.8%
- By 2075
- 4,535 · -26.1%
- By 2100
- 3,973 · -35.3%
Race, ethnicity, and origin ACS 2023
- Neighborhood character
- Predominantly White (81%)
- Race & ethnicity
- White 81% Two or more races 17% Hispanic / Latino 15% Asian 2%
- Hispanic origin (detail)
- Mexican 15%
- Common ancestry
- Slovak 4% Hungarian 1% Serbian 1%
- Foreign-born
- 2% · China
Political lean MEDSL · Burt
- 2024 margin
- Solid R (+45.1) · D 26.9% · R 72.0% · Other 1.1%
- 2008→2024 swing
- -30.5pp toward R · 2008: -14.6pp · 2024: -45.1pp
- All cycles
- 2024: R+45.1 2020: R+40.6 2016: R+40.6 2012: R+22.0 2008: R+14.6
Not yet ingested
- Civics
- —
Market trends
- HPI YoY
- ▲ 12.53%
- Current HPI
- 316.2453
- Rent YoY
- —
- Metro
- —
- State GDP YoY
- ▲ 0.68%
- F500 in state
- 2
Industry mix (Fortune 500 HQ in NE)
| Industry | F500 HQs | Revenue |
|---|---|---|
| Conglomerate | 1 | $371B |
|
||
Price history
+131.5% since first listed17 events — show timeline
- 2025-12-18 Listed $125,000 Fizber.com
- 2025-11-21 Listing Removed — GPRMLS
- 2025-11-06 Price Changed $130,000 GPRMLS
- 2025-10-21 Sold (Public Records) $58,000 Public Records
- 2025-10-21 Listed $150,000 GPRMLS
- 2025-04-16 Listing Removed — GPRMLS
- 2025-04-10 Price Changed $89,900 GPRMLS
- 2025-03-24 Price Changed $99,900 GPRMLS
- 2025-03-03 Price Changed $125,000 GPRMLS
- 2024-11-24 Relisted — GPRMLS
- 2024-10-18 Pending — GPRMLS
- 2024-10-15 Listed $129,000 GPRMLS
- 2024-10-03 Listing Removed — GPRMLS
- 2024-07-20 Price Changed $130,000 GPRMLS
- 2024-06-16 Price Changed $135,000 GPRMLS
- 2024-06-01 Listed $139,000 GPRMLS
- 2014-01-22 Sold (Public Records) $54,000 Public Records
Property tax history
+1.3%/yrLatest (2025): $1,557 · +1.0% YoY. Source: county tax records.
Cash-flow waterfall
monthlySold comps — $/sqft
last 12 mo · ≤1 miLoading sold comps…