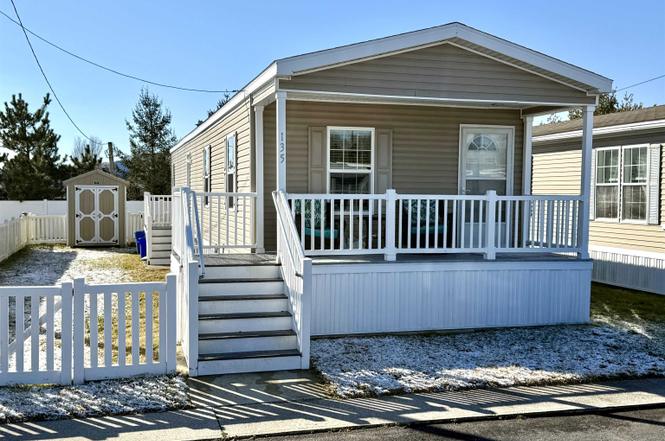
135 Maurice Blvd · Middle, NJ
Flood risk No data
- FEMA flood zone
- —
- Chance of flooding over 30 yrs
- —
- Est. flood insurance / yr
- —
Fire risk No data
- Est. fire insurance / yr
- —
Heat risk No data
- Hot days now (above threshold)
- —
- Hot days in 30 yrs
- —
Wind risk No data
- Chance of severe wind over 30 yrs
- —
Air-quality risk No data
- Unhealthy air days now
- —
- Unhealthy air days in 30 yrs
- —
Risk factors via First Street. Map © Google.
Why this score? — see what drove the F grade
The composite is a weighted blend of 9 inputs, each scored 0–100. Each bar is that input's sub-score; the figure is the points it added to the 100-point composite (weight × sub-score).
- Appreciation +10.0/10.0
- Cash flow +7.1/30.0
- ARV discount +2.7/15.0
- Rent growth +2.5/5.0
- Livability +2.5/5.0
- Condition / age +2.5/5.0
- Schools +2.4/10.0
- 1% rule +1.9/10.0
- DSCR +1.3/10.0
$182,500
🖨 Deal sheet (PDF) 📄 Offer letter ✓ Due diligence
Listing remarks
Don't miss this opportunity for affordable year-round or seasonal living in this well maintained two bedroom, two bath mobile home located in Grande Woods South Manufactured Home Community, which is an all-age community. Easy access to shopping and a ten minute drive to Wildwood Beaches and Boardwalks or the Historic City of Cape May. Open floor plan for easy living! Bright living room, dining area and kitchen with plenty of cabinets and countertop space. The master suite has ample closet space and a private bath. Laundry area holds full sized washer and dryer, which is conveniently located near the second means of egress. Natural gas heat and central air with ceiling fans to maintain great
Key facts
- Open floor plan
- Laundry area
- Private bath
Tags
Property features AI
Exterior
- Utilities: Well water; City sewer; Natural gas hot water (on-demand)
- Home design: Vinyl exterior; Offered for sale
- Exterior features: Deck; Porch; Fenced yard; Storage building; Sidewalks
Interior
- Kitchen: Range; Microwave; Refrigerator; Dishwasher
- Bedrooms: 2 bedrooms
- Flooring: Wall-to-wall carpet; Vinyl flooring
- Bathrooms: 2 full bathrooms
- Heating & cooling: Natural gas forced-air heating; Central air conditioning; Ceiling fan
- Interior features: Wall-to-wall carpet; Vinyl flooring; Smoke/Fire detector; Curtains and blinds included; Partial furniture included; Living room; Eat-in kitchen; Six total rooms
- Laundry & utility: Washer; Dryer; On-demand gas hot water
Neighborhood map
What this means for you Summary
Snapshot
- This is a 2-bed/2.0-bath manufactured listed at $182k.
Deal economics
- At list price, monthly cash flow is $-260 ($-3k/yr) — negative.
- To cash-flow at today's rent, offer at most $145k (20.7% below list).
- To meet the 1% rule (rent ≥ 1% of price), the offer needs to be $127k (30.6% below list).
- Recommended offer: $127k (30.6% below list) — sets the bar for 1% rule.
Location & tenants
- Location reads: area grade F — affects rentability + tenant quality, not the cash-flow math above.
- Middle Township Public School District (suburban): math 15% / reading 38% proficiency, ranked #372 of 472 in NJ (top 79%) — low school quality limits family demand, transient renter base, plan for 1-2y turnover.
- Zoned schools: Middle Township Elementary #1 (657 students, 56% FRL); Middle Township Elementary #4 (math 14% / reading 47%, grade F, #303 of 431 statewide, top 72%, 594 students, 52% FRL); Middle Township High School (math 17% / reading 32%, grade F, #327 of 399 statewide, top 82%, 790 students, 36% FRL).
- Market conditions: 72 active listings in the ZIP; 877 units permitted in Cape May County in 2024 (35 in 5+ unit buildings).
Forward outlook
- In year one you build about $20k of equity ($1k loan paydown + $18k appreciation (10.0% local appreciation)).
- Cape May County population projected at -24% by 2050 — secular population decline; favor cash flow + early exit over multi-decade hold.
- By year 2, paydown + projected appreciation supports a ~$31k cash-out refi (75% LTV) — recoverable capital for the next deal without selling this one.
Negotiation context
- It's been on market 153 days — a 12% lower offer ($161k) is reasonable based on typical stale-listing flexibility.
Questions for the listing agent
- What do current leases actually rent for vs. the listed asking? Can we see a recent rent roll and the last 12 months of T-12 income?
- It's been on market 153 days. Have you received any prior offers? Is the seller open to a 31% concession, seller financing, or rate buy-down credit?
- Why hasn't it sold? Are there any deal-killer items the seller is aware of (foundation, flood, title, zoning, code violations)?
- Is there a deadline driving the sale (1031 exchange, divorce, estate, relocation)? That informs how much negotiation room exists.
- The area grade is low — what's the realistic commute time and amenity access for the typical tenant pool here? Any planned neighborhood developments (good or bad) we should know about?
- What's the average days-on-market for RENTAL listings here right now (not sales)? A rising rental-DOM trend means longer vacancies and softer asking-rent achievability than the comps imply.
- What's the recent tenant-quality profile in this submarket — average credit score on applications, eviction rate, late-payment / NSF rate, and stable-employment percentage? A property-management company in the area should have these aggregated.
- How much new for-sale + rental construction is in the pipeline within 1–3 miles? Heavy new supply typically softens prices + rents 12–24 months out; constrained supply supports both.
Investment metrics
- 1% rule
- 0.69% ✗
- Cap rate
- 4.58%
- Cash-on-cash
- -6.12%
- DSCR
- 0.73
- GRM
- 12.0
CMA / ARV
- ARV (on-the-fly)
- $164,864
- Comps found
- 4
Show comp detail 4 sales within ~0.75 mi
| Address | Dist | Beds/Ba | Sqft | Sold | Price | $/sf | Match |
|---|---|---|---|---|---|---|---|
| 68 Priest Blvd | 0.19mi | 2/2.0 | 980 (-4%) | 2mo | $140,000 | $143 | 82 |
| 322 Grande Blvd | 0.34mi | 3/2.0 (+1) | 980 (-4%) | 20mo | $178,000 | $182 | 56 |
| 71 Priest Blvd | 0.18mi | 2/1.5 | 900 (-12%) | 18mo | $145,000 | $161 | 54 |
| 2 Priest Blvd | 0.40mi | 2/2.0 | 896 (-12%) | 23mo | $115,000 | $128 | 41 |
Match score weights: distance 35% · size 25% · config 20% · recency 20%. Top-matched comps best support the ARV.
Projected returns pro-forma
10.0% appreciation · 3.0% rent growth · sell at horizon
- IRR
- 20.0%
- Equity multiple
- 2.62×
- Total profit
- $82,825
- Equity at exit
- $164,410
- IRR
- 18.3%
- Equity multiple
- 6.03×
- Total profit
- $256,989
- Equity at exit
- $354,557
Cash invested: $51,100 (down + closing). Projections, not guarantees.
Landlord ↔ Tenant lean methodology
- Overall (STATE)
- 21 Tenant-Leaning
- State New Jersey
- 21 Tenant-Leaning · D+6
- County
- — inherits STATE
- City
- — inherits STATE
ZIP-level market 08242
- Home prices YoY
- 14.2%
- Active inventory
- 72
- Price-to-rent
- 12.0×
Monthly cashflow live
- Estimated rent
- $1,267 medium interval (Pro) →
- Mortgage (P&I)
- −$957
- Tax est. 1.5%
- −$228 /mo · $2,738/yr
- Insurance
- −$76
- HOA
- −$0
- Vacancy / Maint / Mgmt
- −$266
- Net cashflow
- $-260
Break-even live
Sensitivity live
| Price | -10% $-134 | -5% $-197 | +0% $-260 | +5% $-324 | +10% $-387 |
|---|---|---|---|---|---|
| Rent | -10% $-361 | -5% $-310 | +0% $-260 | +5% $-210 | +10% $-160 |
| Rate | -1.0pp $-169 | -0.5pp $-214 | base $-260 | +0.5pp $-308 | +1.0pp $-356 |
UW: 25.0% down · 7.5% · 30yr · 1.5% tax · 5.0% vac · 8.0% maint · 8.0% mgmt
Financing live
Cash to close
- Down payment
- $45,625
- Closing costs
- $5,475
- Reserves months
- —
- Total cash needed
- —
Loan-product check · same deal, 3 products live
Conventional
25% down · 7.5% · 30yr
- Down + closing
- —
- Monthly P&I
- —
- Monthly cashflow
- —
- DSCR
- —
- Eligible?
- —
Personal DTI + credit; lowest rate.
DSCR
20% down · 8.5% · 30yr
- Down + closing
- —
- Monthly P&I
- —
- Monthly cashflow
- —
- DSCR
- —
- Eligible?
- —
No personal income docs; deal must DSCR.
Hard money
10% down · 12.0% · 12mo
- Down + closing
- —
- Monthly P&I
- —
- Monthly cashflow
- —
- DSCR
- —
- Eligible?
- —
Short-term bridge; refi at stabilization.
Listing history 18 events
-
2026-06-21days on market $182,500 Active 153 DOM
-
2026-06-21days on market $182,500 Active 152 DOM
-
2026-06-18days on market $182,500 Active 150 DOM
-
2026-06-17days on market $182,500 Active 149 DOM
-
2026-06-16days on market $182,500 Active 148 DOM
-
2026-06-15days on market $182,500 Active 147 DOM
-
2026-06-13days on market $182,500 Active 145 DOM
-
2026-06-12days on market $182,500 Active 144 DOM
-
2026-06-09days on market $182,500 Active 141 DOM
-
2026-06-08days on market $182,500 Active 140 DOM
-
2026-06-07days on market $182,500 Active 139 DOM
-
2026-06-07days on market $182,500 Active 138 DOM
-
2026-06-04days on market $182,500 Active 135 DOM
-
2026-06-02days on market $182,500 Active 134 DOM
-
2026-06-01days on market $182,500 Active 133 DOM
-
2026-05-31days on market $182,500 Active 132 DOM
-
2026-04-14price $182,500
-
2026-01-19$189,900 Active
ⓘ Source: listings_history table (triggers on properties + properties_extension) + one-shot
backfill from property_details.listing_events for pre-trigger history.
Nearby sold comps map
Loading sold comps map…
Walkable amenities ~0.75 mi
Loading nearby amenities…
Taxation est. · year 1
- Rental income
- $15,201
- − Mortgage interest
- −$10,223
- − Property taxes
- −$2,738
- − Insurance
- −$912
- − Repairs & maintenance
- −$1,216
- − Management
- −$1,216
- − Depreciation
- −$5,309
- Taxable loss
- −$6,413
- Est. tax savings @ 24.0%
- +$1,539
- After-tax cash flow
- $-1,586/yr
For passive investors: Depreciation is non-cash, so a rental often shows a tax loss while cash-flowing — sheltering income. Rental losses are passive: they offset passive income freely, and up to $25,000/yr can offset ordinary (W-2) income if you actively participate and your MAGI is under $100k (phasing out to $0 by $150k); unused losses carry forward. On sale, claimed depreciation is recaptured at up to 25%, and gains may owe capital-gains tax (a 1031 exchange can defer both). Figures are a year-1 estimate at your 24.0% rate — not tax advice; consult a CPA.
Schools (NCES district)
- District
- Middle Township Public School District
- NCES district ID
- 3410020
- Math proficiency
- 15% ▼ -18.00%
- Reading proficiency
- 38% ▼ -7.00%
- Median HH income
- $59,228
- Composite
- 24.09/100
- National rank
- #7754
- State rank
- #372 of 472 in NJ
Livability — Middle
No livability data for this city. (Only ~50 U.S. cities are tracked.)
Census & demographics
- Census place
- Rio Grande, NJ
- Population (ZIP)
- 4,021
Population outlook (Cape May County) Hauer SSP2
- Today (2025)
- 88,234 people
- By 2030
- 84,144 · -4.6%
- By 2040
- 75,146 · -14.8%
- By 2050
- 67,389 · -23.6%
- By 2075
- 55,732 · -36.8%
- By 2100
- 44,972 · -49.0%
Race, ethnicity, and origin ACS 2023
- Neighborhood character
- Predominantly White (69%)
- Race & ethnicity
- White 69% Hispanic / Latino 17% Two or more races 11% Black 7%
- Hispanic origin (detail)
- Mexican 5% Puerto Rican 10%
- Common ancestry
- Romanian 4% Slovak 2% Lithuanian 1%
- Foreign-born
- 6% · Canada
- Languages at home
- 85% English-only · Spanish 11% Russian/Polish/Slavic 2% Arabic 1%
Political lean MEDSL · Cape May
- 2024 margin
- R (+19.2) · D 39.7% · R 58.9% · Other 1.4%
- 2008→2024 swing
- -10.6pp toward R · 2008: -8.7pp · 2024: -19.2pp
- All cycles
- 2024: R+19.2 2020: R+15.9 2016: R+19.9 2012: R+8.9 2008: R+8.7
Not yet ingested
- Civics
- —
Market trends
- HPI YoY
- ▲ 51.53%
- Current HPI
- 414.7401
- Rent YoY
- —
- Metro
- —
- State GDP YoY
- ▲ 2.05%
- F500 in state
- 34
Industry mix (Fortune 500 HQ in NJ)
| Industry | F500 HQs | Revenue |
|---|---|---|
| Consumer Goods | 3 | $31B |
|
||
| Pharmaceuticals | 2 | $153B |
|
||
| Technology | 2 | $21B |
|
||
| Insurance | 2 | $20B |
|
||
| Healthcare | 2 | $19B |
|
||
| Financial Services | 1 | $70B |
|
||
Price history
-3.9% since first listed2 events — show timeline
- 2026-04-14 Price Changed $182,500 CMCMLS
- 2026-01-19 Listed $189,900 CMCMLS
Cash-flow waterfall
monthlySold comps — $/sqft
last 12 mo · ≤1 miLoading sold comps…