 Duplex
12030 County Road 1139 · Tyler, TX
Flood risk 1/10 · Minimal
- FEMA flood zone
- X (unshaded)
- Chance of flooding over 30 yrs
- 0.0%
- Est. flood insurance / yr
- $507 – $1,088
Fire risk 5/10 · Moderate
- Est. fire insurance / yr
- $1,222 – $2,270
Heat risk 7/10 · Major
- Hot days now (above 108°F)
- 7 days/yr
- Hot days in 30 yrs
- 26 days/yr
Wind risk 6/10 · Moderate
- Chance of severe wind over 30 yrs
- 60.0%
Air-quality risk 2/10 · Minimal
- Unhealthy air days now
- 0 days/yr
- Unhealthy air days in 30 yrs
- 1 days/yr
Risk factors via First Street. Map © Google.
Why this score? — see what drove the D- grade
The composite is a weighted blend of 9 inputs, each scored 0–100. Each bar is that input's sub-score; the figure is the points it added to the 100-point composite (weight × sub-score).
- Cash flow +12.3/30.0
- ARV discount +7.4/15.0
- 1% rule +4.4/10.0
- Livability +3.8/5.0
- DSCR +3.7/10.0
- Schools +3.3/10.0
- Rent growth +2.5/5.0
- Condition / age +2.5/5.0
- Appreciation +0.0/10.0
$267,000
🖨 Deal sheet 📄 Offer letter ✓ Due diligence
Multi-family units
County records classify this as Multi-Family (2-4 Unit). Listing-text estimate: 2 units. confirmed
Listing remarks MLS
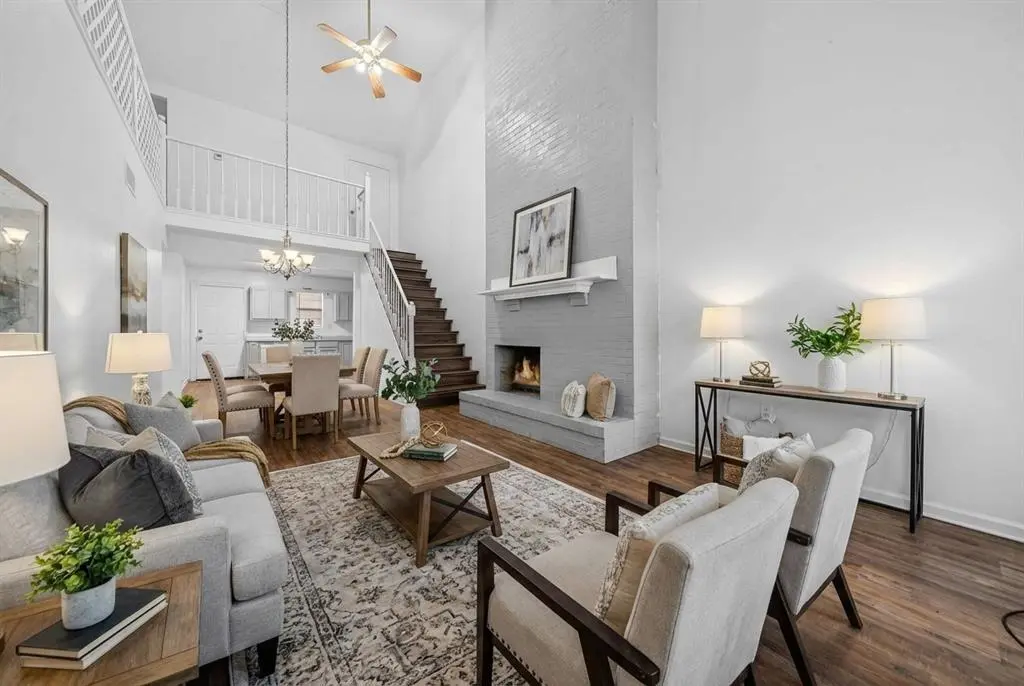
Income-producing duplex with owner-occupant potential! This well-maintained property features two mirrored units, each offering 3 bedrooms, 2 bathrooms, a bonus room, and additional storage space. Both sides include cozy fireplaces and durable luxury vinyl plank flooring, creating a comfortable and appealing living environment. The property offers covered carport parking for tenants along with additional off-street parking. Currently generating $1,350 per month in rent per unit, this duplex provides steady income with room to grow. With minor cosmetic improvements, there is potential to increase rental rates and overall returns. A great opportunity for investors or owner-occupants alike. Live in one side and rent the other to offset your mortgage while building long-term equity. Whether you’re expanding your portfolio or looking for a smart house-hack option, this duplex offers flexibility, functionality, and strong income potential.
Key facts
- Mirrored units
- Bonus room
- 0.35 acre lot
Tags
Neighborhood map
What this means for you Summary
Snapshot
- This is a 2 × 3-bed/2.0-bath units multifamily listed at $267k.
Deal economics
- At list price, monthly cash flow is $-48 ($-572/yr) — negative. Per door: $-24/mo.
- To cash-flow at today's rent, offer at most $259k (3.2% below list).
- To meet the 1% rule (rent ≥ 1% of price), the offer needs to be $250k (6.2% below list).
- Recommended offer: $250k (6.2% below list) — sets the bar for 1% rule.
- Cap rate 6.1% vs local median 3.6% in Tyler — top-decile yield for the area; either an underpriced asset or a hidden risk that comps aren't pricing in. Stress-test before assuming the spread holds.
Location & tenants
- Location reads 75/100 on livability (#147 in TX, #4,181 nationally) — a middle-class / working-renter tenant base. Strengths: cost of living A+, housing A+, health & safety A+; Watch: employment C-, schools D+, crime D+.
- Tyler ISD (urban): math 39% / reading 38% proficiency, ranked #449 of 826 in TX (top 54%) — families likely to look elsewhere, expect single-tenant / working-renter base with shorter leases; 66% free/reduced lunch — lower-income household profile, screen leases tightly.
- Market conditions: 90 active listings in the ZIP; 595 units permitted in Smith County in 2024 (45 in 5+ unit buildings).
Forward outlook
- Local home prices are declining (-3.0%/yr); year-one equity from $2k of loan paydown is wiped out by about $8k of value loss. Plan a longer hold.
- Smith County population projected at +24% by 2050 — long-run rental-demand tailwind backs the buy-and-hold thesis.
Negotiation context
- It's been on market 84 days — a 6% lower offer ($251k) is reasonable based on typical stale-listing flexibility.
- 6 sale attempts since 4y ago with the ask held roughly flat each time — persistent listings suggest the price (not the market) is what's stuck; bring a comps-based counter.
Risks & watch-outs
- Climate carrying-cost: major wind risk, 60% chance of damaging wind over 30y; moderate wildfire risk; extreme-heat days projected 7→26/yr by 2055 (HVAC capex compounding) — expect insurance premiums to compound above CPI over the hold.
Questions for the listing agent
- What do current leases actually rent for vs. the listed asking? Can we see a recent rent roll and the last 12 months of T-12 income?
- It's been on market 84 days. Have you received any prior offers? Is the seller open to a 6% concession, seller financing, or rate buy-down credit?
- Can we see the unit-by-unit rent roll, current vacancy, and any below-market leases? What's the average tenancy length?
- What capital expenditures (roof, boiler, parking lot, exteriors) have been made in the last 5 years, and what's planned in the next 2?
- Why hasn't it sold? Are there any deal-killer items the seller is aware of (foundation, flood, title, zoning, code violations)?
- Is there a deadline driving the sale (1031 exchange, divorce, estate, relocation)? That informs how much negotiation room exists.
- Schools are D-rated, which usually means shorter tenancies and higher turnover. Who's the typical renter profile here, and what's been the actual vacancy rate?
- Crime grade is D in this area — have there been break-ins, vandalism, or insurance claims at this property in the last 3 years? What carrier currently insures it and at what premium?
- The area grade is low — what's the realistic commute time and amenity access for the typical tenant pool here? Any planned neighborhood developments (good or bad) we should know about?
- What's the average days-on-market for RENTAL listings here right now (not sales)? A rising rental-DOM trend means longer vacancies and softer asking-rent achievability than the comps imply.
- What's the recent tenant-quality profile in this submarket — average credit score on applications, eviction rate, late-payment / NSF rate, and stable-employment percentage? A property-management company in the area should have these aggregated.
- How much new apartment / multifamily construction is in the pipeline within 1–3 miles? Heavy new supply (>2% of stock underway) typically softens rents 12–24 months out; light construction supports rent growth.
Investment metrics
- 1% rule
- 0.94% ✗
- Cap rate
- 6.08%
- Cash-on-cash
- -0.77%
- DSCR
- 0.97
- GRM
- 8.9
CMA / ARV
- ARV (on-the-fly)
- $266,400
- Comps found
- 1
Show comp detail 1 sale within ~0.75 mi
| Address | Dist | Beds/Ba | Sqft | Sold | Price | $/sf | Match |
|---|---|---|---|---|---|---|---|
| 12030 County Road 1139 | 0.00mi | 6/4.0 | 3,330 (0%) | 0mo | $267,000 | $80 | 100 |
Match score weights: distance 35% · size 25% · config 20% · recency 20%. Top-matched comps best support the ARV.
Projected returns pro-forma
-3.0% appreciation · 3.0% rent growth · sell at horizon
- IRR
- -17.5%
- Equity multiple
- 0.38×
- Total profit
- $-46,155
- Equity at exit
- $39,811
- IRR
- -9.4%
- Equity multiple
- 0.42×
- Total profit
- $-43,499
- Equity at exit
- $23,085
Cash invested: $74,760 (down + closing). Projections, not guarantees.
Landlord ↔ Tenant lean methodology
- Overall (STATE)
- 87 Strongly Landlord-Friendly
- State Texas
- 87 Strongly Landlord-Friendly · R+5
- County
- — inherits STATE
- City
- — inherits STATE
ZIP-level market 75709
- Home prices YoY
- -16.5%
- Active inventory
- 90
- Price-to-rent
- 17.8×
Monthly cashflow live
- Estimated rent
- $2,504 medium interval (Pro) →
- Mortgage (P&I)
- −$1,400
- Tax from tax record
- −$514 /mo · $6,173/yr
- Insurance
- −$111
- HOA
- −$0
- Vacancy / Maint / Mgmt
- −$526
- Net cashflow
- $-48
Break-even live
2-unit breakdown (identical units grouped — click to expand)
| Units | Beds | Baths | Est. rent |
|---|---|---|---|
| 2× units | 3 | 2 | $2,504 |
| #1 | 3 | 2 | $1,252 |
| #2 | 3 | 2 | $1,252 |
| Total (2 units) | $2,504 | ||
UW: 25.0% down · 7.5% · 30yr · 1.5% tax · 5.0% vac · 8.0% maint · 8.0% mgmt
Financing live
Cash to close
- Down payment
- $66,750
- Closing costs
- $8,010
- Reserves months
- —
- Total cash needed
- —
Loan-product check · same deal, 3 products live
Conventional
25% down · 7.5% · 30yr
- Down + closing
- —
- Monthly P&I
- —
- Monthly cashflow
- —
- DSCR
- —
- Eligible?
- —
Personal DTI + credit; lowest rate.
DSCR
20% down · 8.5% · 30yr
- Down + closing
- —
- Monthly P&I
- —
- Monthly cashflow
- —
- DSCR
- —
- Eligible?
- —
No personal income docs; deal must DSCR.
Hard money
10% down · 12.0% · 12mo
- Down + closing
- —
- Monthly P&I
- —
- Monthly cashflow
- —
- DSCR
- —
- Eligible?
- —
Short-term bridge; refi at stabilization.
Listing history 24 events
-
2026-05-03status Pending 953-char remark
Show marketing remark (950 chars)
Income-producing duplex with owner-occupant potential! This well-maintained property features two mirrored units, each offering 3 bedrooms, 2 bathrooms, a bonus room, and additional storage space. Both sides include cozy fireplaces and durable luxury vinyl plank flooring, creating a comfortable and appealing living environment. The property offers covered carport parking for tenants along with additional off-street parking. Currently generating $1,350 per month in rent, this duplex provides steady income with room to grow. With minor cosmetic improvements, there is potential to increase rental rates and overall returns. A great opportunity for investors or owner-occupants alike. Live in one side and rent the other to offset your mortgage while building long-term equity. Whether you’re expanding your portfolio or looking for a smart house-hack option, this duplex offers flexibility, functionality, and strong income potential.
-
2026-05-03status Pending 950-char remark
Show marketing remark (950 chars)
Income-producing duplex with owner-occupant potential! This well-maintained property features two mirrored units, each offering 3 bedrooms, 2 bathrooms, a bonus room, and additional storage space. Both sides include cozy fireplaces and durable luxury vinyl plank flooring, creating a comfortable and appealing living environment. The property offers covered carport parking for tenants along with additional off-street parking. Currently generating $1,350 per month in rent, this duplex provides steady income with room to grow. With minor cosmetic improvements, there is potential to increase rental rates and overall returns. A great opportunity for investors or owner-occupants alike. Live in one side and rent the other to offset your mortgage while building long-term equity. Whether you’re expanding your portfolio or looking for a smart house-hack option, this duplex offers flexibility, functionality, and strong income potential.
-
2026-03-30price $267,000 950-char remark
Show marketing remark (953 chars)
Income-producing duplex with owner-occupant potential! This well-maintained property features two mirrored units, each offering 3 bedrooms, 2 bathrooms, a bonus room, and additional storage space. Both sides include cozy fireplaces and durable luxury vinyl plank flooring, creating a comfortable and appealing living environment. The property offers covered carport parking for tenants along with additional off-street parking. Currently generating $1,350 per month in rent per unit, this duplex provides steady income with room to grow. With minor cosmetic improvements, there is potential to increase rental rates and overall returns. A great opportunity for investors or owner-occupants alike. Live in one side and rent the other to offset your mortgage while building long-term equity. Whether you’re expanding your portfolio or looking for a smart house-hack option, this duplex offers flexibility, functionality, and strong income potential.
-
2026-03-30price $267,000 953-char remark
Show marketing remark (953 chars)
Income-producing duplex with owner-occupant potential! This well-maintained property features two mirrored units, each offering 3 bedrooms, 2 bathrooms, a bonus room, and additional storage space. Both sides include cozy fireplaces and durable luxury vinyl plank flooring, creating a comfortable and appealing living environment. The property offers covered carport parking for tenants along with additional off-street parking. Currently generating $1,350 per month in rent per unit, this duplex provides steady income with room to grow. With minor cosmetic improvements, there is potential to increase rental rates and overall returns. A great opportunity for investors or owner-occupants alike. Live in one side and rent the other to offset your mortgage while building long-term equity. Whether you’re expanding your portfolio or looking for a smart house-hack option, this duplex offers flexibility, functionality, and strong income potential.
-
2026-02-08$275,000 Active 953-char remark
Show marketing remark (950 chars)
Income-producing duplex with owner-occupant potential! This well-maintained property features two mirrored units, each offering 3 bedrooms, 2 bathrooms, a bonus room, and additional storage space. Both sides include cozy fireplaces and durable luxury vinyl plank flooring, creating a comfortable and appealing living environment. The property offers covered carport parking for tenants along with additional off-street parking. Currently generating $1,350 per month in rent, this duplex provides steady income with room to grow. With minor cosmetic improvements, there is potential to increase rental rates and overall returns. A great opportunity for investors or owner-occupants alike. Live in one side and rent the other to offset your mortgage while building long-term equity. Whether you’re expanding your portfolio or looking for a smart house-hack option, this duplex offers flexibility, functionality, and strong income potential.
-
2026-02-08$275,000 Active 950-char remark
Show marketing remark (950 chars)
Income-producing duplex with owner-occupant potential! This well-maintained property features two mirrored units, each offering 3 bedrooms, 2 bathrooms, a bonus room, and additional storage space. Both sides include cozy fireplaces and durable luxury vinyl plank flooring, creating a comfortable and appealing living environment. The property offers covered carport parking for tenants along with additional off-street parking. Currently generating $1,350 per month in rent, this duplex provides steady income with room to grow. With minor cosmetic improvements, there is potential to increase rental rates and overall returns. A great opportunity for investors or owner-occupants alike. Live in one side and rent the other to offset your mortgage while building long-term equity. Whether you’re expanding your portfolio or looking for a smart house-hack option, this duplex offers flexibility, functionality, and strong income potential.
-
2025-09-16price $280,000
-
2025-07-24price $285,000
-
2025-05-19price $295,000
-
2025-03-21historical $1,250
-
2025-02-27$1,250
-
2025-01-16historical $1,250
-
2025-01-14price $1,250
-
2025-01-06price $319,900
-
2024-12-23price $1,300
-
2024-12-04price $1,350
-
2024-10-30$1,400
-
2024-10-22$329,900 Active
-
2022-11-23historical
-
2022-08-12soldstatus
-
2022-08-12soldstatus
-
2022-07-12$289,000
-
2018-10-02soldstatus
-
2003-04-03soldstatus
ⓘ Source: listings_history table (triggers on properties + properties_extension) + one-shot
backfill from property_details.listing_events for pre-trigger history.
Tax reassessment forecast TX · Resets to sale price
- Current annual tax
- $6,173 · $514/mo
- Projected year-2 tax
- $6,173 · $514/mo
- Expected delta
- $0/yr ($0/mo · 0.0%)
ⓘ Screening estimate from a state-policy table — verify with the county assessor before closing.
Climate risk First Street
- Flood 1/10 Low FEMA zone X (unshaded) · 0% chance over 30 yrs
- Wildfire 5/10 Major
- Heat 7/10 Severe 7 d/yr ≥108°F today · 26 d/yr by 30 yrs out
- Wind 6/10 Major 60% chance of damaging wind over 30 yrs
- Air quality 2/10 Low 0 unhealthy d/yr today · 1 by 30 yrs out
Nearby sold comps map
Loading sold comps map…
Walkable amenities ~0.75 mi
Loading nearby amenities…
Taxation est. · year 1
- Rental income
- $30,048
- − Mortgage interest
- −$14,956
- − Property taxes
- −$6,173
- − Insurance
- −$1,335
- − Repairs & maintenance
- −$2,404
- − Management
- −$2,404
- − Depreciation
- −$7,767
- Taxable loss
- −$4,991
- Est. tax savings @ 24.0%
- +$1,198
- After-tax cash flow
- $625/yr
For passive investors: Depreciation is non-cash, so a rental often shows a tax loss while cash-flowing — sheltering income. Rental losses are passive: they offset passive income freely, and up to $25,000/yr can offset ordinary (W-2) income if you actively participate and your MAGI is under $100k (phasing out to $0 by $150k); unused losses carry forward. On sale, claimed depreciation is recaptured at up to 25%, and gains may owe capital-gains tax (a 1031 exchange can defer both). Figures are a year-1 estimate at your 24.0% rate — not tax advice; consult a CPA.
Schools (NCES district)
- District
- Tyler ISD
- NCES district ID
- 4843470
- Math proficiency
- 39% ▼ -4.00%
- Reading proficiency
- 38% ▼ -1.00%
- Median HH income
- $44,090
- Composite
- 32.69/100
- National rank
- #5650
- State rank
- #449 of 826 in TX
Livability — Tyler
- Score
- 75/100
- State rank
- #147
- US rank
- #4181
Category grades
Schools grade is shown separately in the Schools card above.
Census & demographics
- City population
- 127,842
- Population (ZIP)
- 5,237
Population outlook (Smith County) Hauer SSP2
- Today (2025)
- 248,890 people
- By 2030
- 261,665 · +5.1%
- By 2040
- 286,114 · +15.0%
- By 2050
- 308,006 · +23.8%
- By 2075
- 354,171 · +42.3%
- By 2100
- 372,828 · +49.8%
Race, ethnicity, and origin ACS 2023
- Neighborhood character
- Diverse neighborhood (Simpson 0.67)
- Race & ethnicity
- White 43% Hispanic / Latino 33% Black 19% Two or more races 8% Asian 1%
- Hispanic origin (detail)
- Mexican 29%
- Common ancestry
- Slovak 3% Lithuanian 2% Serbian 1%
- Foreign-born
- 10% · Canada, Dominican Republic
- Languages at home
- 67% English-only · Spanish 31% Other Indo-European 1%
Political lean MEDSL · Smith
- 2024 margin
- Solid R (+45.1) · D 27.0% · R 72.1%
- 2008→2024 swing
- -5.6pp toward R · 2008: -39.5pp · 2024: -45.1pp
- All cycles
- 2024: R+45.1 2020: R+39.4 2016: R+43.9 2012: R+46.9 2008: R+39.5
Not yet ingested
- Civics
- —
Market trends
- HPI YoY
- ▼ -39.17%
- Current HPI
- 197.8711
- Rent YoY
- —
- Metro
- —
- State GDP YoY
- ▲ 3.95%
- F500 in state
- 110
Industry mix (Fortune 500 HQ in TX)
| Industry | F500 HQs | Revenue |
|---|---|---|
| Energy | 16 | $1,198B |
|
||
| Technology | 5 | $198B |
|
||
| Engineering / Construction | 4 | $72B |
|
||
| Energy Services | 3 | $60B |
|
||
| Utilities | 3 | $41B |
|
||
| Healthcare | 2 | $330B |
|
||
Price history
-7.6% since first listed24 events — show timeline
- 2026-05-03 Pending — GTAR
- 2026-05-03 Pending — NTREIS
- 2026-03-30 Price Changed $267,000 NTREIS
- 2026-03-30 Price Changed $267,000 GTAR
- 2026-02-08 Listed $275,000 GTAR
- 2026-02-08 Listed $275,000 NTREIS
- 2025-09-16 Price Changed $280,000 GTAR
- 2025-07-24 Price Changed $285,000 GTAR
- 2025-05-19 Price Changed $295,000 GTAR
- 2025-03-21 Rental Removed $1,250 RENT.
- 2025-02-27 Listed for Rent $1,250 RENT.
- 2025-01-16 Rental Removed $1,250 RENT.
- 2025-01-14 Price Changed $1,250 RENT.
- 2025-01-06 Price Changed $319,900 GTAR
- 2024-12-23 Price Changed $1,300 RENT.
- 2024-12-04 Price Changed $1,350 RENT.
- 2024-10-30 Listed for Rent $1,400 RENT.
- 2024-10-22 Listed $329,900 GTAR
- 2022-11-23 Rental Removed — RENT.
- 2022-08-12 Sold (Public Records) — Public Records
- 2022-08-12 Sold (MLS) — GTAR
- 2022-07-12 Listed $289,000 GTAR
- 2018-10-02 Sold (Public Records) — Public Records
- 2003-04-03 Sold (Public Records) — Public Records
Property tax history
+6.3%/yrLatest (2024): $6,173 · +16.6% YoY. Source: county tax records.
Cash-flow waterfall
monthlySold comps — $/sqft
last 12 mo · ≤1 miLoading sold comps…