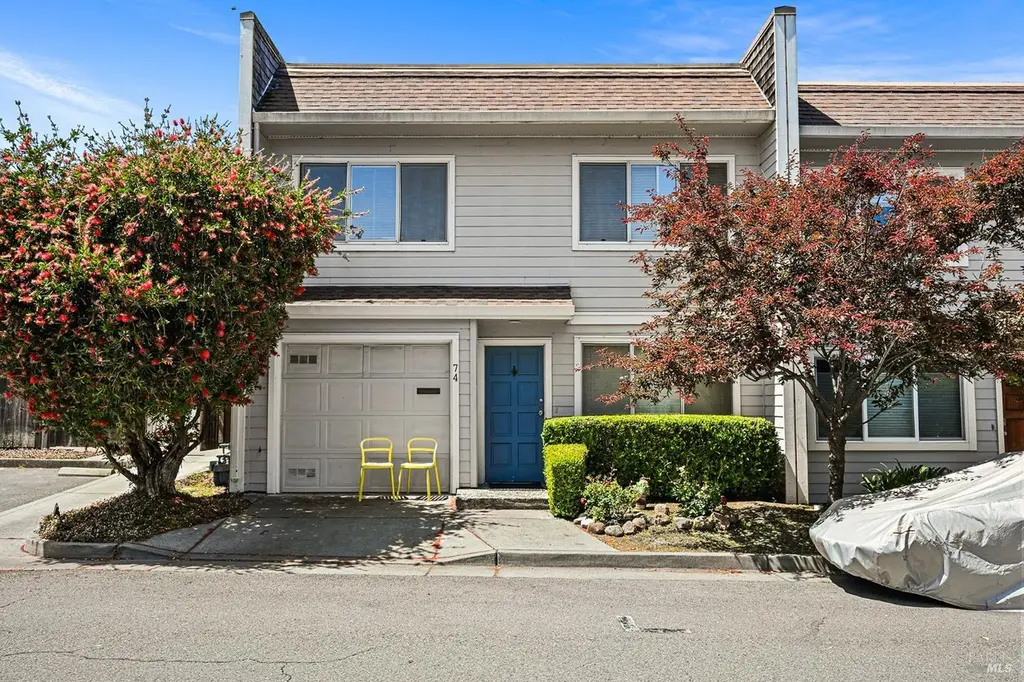
74 Mariner Green Dr · Corte Madera, CA
Flood risk 1/10 · Minimal
- FEMA flood zone
- X (unshaded)
- Chance of flooding over 30 yrs
- 0.0%
- Est. flood insurance / yr
- $507 – $1,088
Fire risk 3/10 · Minor
- Est. fire insurance / yr
- $659 – $1,223
Heat risk 3/10 · Minor
- Hot days now (above 83°F)
- 7 days/yr
- Hot days in 30 yrs
- 17 days/yr
Wind risk 1/10 · Minimal
- Chance of severe wind over 30 yrs
- —
Air-quality risk 8/10 · Major
- Unhealthy air days now
- 13 days/yr
- Unhealthy air days in 30 yrs
- 13 days/yr
Risk factors via First Street. Map © Google.
Why this score? — see what drove the C- grade
The composite is a weighted blend of 9 inputs, each scored 0–100. Each bar is that input's sub-score; the figure is the points it added to the 100-point composite (weight × sub-score).
- ARV discount +15.0/15.0
- Appreciation +8.5/10.0
- Cash flow +7.2/30.0
- Schools +6.5/10.0
- Livability +4.2/5.0
- 1% rule +2.5/10.0
- Rent growth +2.5/5.0
- Condition / age +2.5/5.0
- DSCR +1.3/10.0
$730,000
🖨 Deal sheet 📄 Offer letter ✓ Due diligence
Listing remarks
Welcome to 74 Mariner Green Drive, an inviting two-story condominium situated in the heart of the desirable Mariner Green community in Corte Madera. Built in 1966, this lovely residence offers comfortable living spaces designed for an easy and convenient lifestyle. The home features a thoughtfully arranged floor plan including four bedrooms and two and a half bathrooms. The main level provides a seamless flow between living areas, complete with a fireplace and central heating for year-round comfort. Everyday convenience is prioritized with a main-floor half bath and direct access to an attached garage and a beautiful back patio filled with light and views. The upper level of the home incorp
Key facts
- Central heating
- Main floor half bath
- Attached garage
Tags
Property features AI
Finance
- HOA & community: Part of Mariner Townhouse Owners Association; Monthly HOA fee of $984; Association amenities include clubhouse and pool; HOA fee covers common areas, exterior maintenance, management, pool, recreation facility, and roof
Exterior
- Parking: 1-car garage (garage faces front); Total 2 parking spaces
- Utilities: Public sewer
- Home design: Residential condominium; Two stories
- Construction: Roof: see remarks
- Exterior features: Close to clubhouse; Common facility pool and a private pool
Interior
- Kitchen: Kitchen on the main level
- Bedrooms: 4 bedrooms (upper level)
- Bathrooms: 3 bathrooms total — 2 full and 1 partial
- Heating & cooling: Central heating; No cooling
- Interior features: One fireplace located in the family room; Two-story layout; No basement
- Laundry & utility: Washer and dryer included
Neighborhood map
What this means for you Summary
Snapshot
- This is a 3-bed/3.0-bath condo listed at $730k.
Deal economics
- At list price, monthly cash flow is $-1k ($-12k/yr) — negative.
- To cash-flow at today's rent, offer at most $550k (24.6% below list).
- To meet the 1% rule (rent ≥ 1% of price), the offer needs to be $547k (25.1% below list).
- Recommended offer: $547k (25.1% below list) — sets the bar for 1% rule.
- Cap rate 4.6% vs local median 1.9% in Corte Madera — top-decile yield for the area; either an underpriced asset or a hidden risk that comps aren't pricing in. Stress-test before assuming the spread holds.
Location & tenants
- Location reads 83/100 on livability (#26 in CA, #984 nationally) — a professional / high-income tenant draw. Strengths: schools A+, commute A+, employment A+; Watch: cost of living F.
- Tamalpais Union High (suburban): math 62% / reading 78% proficiency, ranked #42 of 517 in CA (top 8%) — strong family-tenant draw, lease renewals of 3-5y typical.
- Market conditions: 40 active listings in the ZIP; 12 comparable units currently listed for rent nearby; rentals leasing fast (median 2d on market — plan ~1-2 weeks tenant-placement turnaround); high-income renter base; 149 units permitted in Marin County in 2024 (5 in 5+ unit buildings).
Forward outlook
- In year one you build about $56k of equity ($5k loan paydown + $51k appreciation (7.0% local appreciation)).
- Marin County population projected at +9% by 2050 — modest demand growth; plan on rents tracking national, not racing it.
- By year 2, paydown + projected appreciation supports a ~$90k cash-out refi (75% LTV) — recoverable capital for the next deal without selling this one.
Negotiation context
- It's been on market 48 days — a 3% lower offer ($708k) is reasonable based on typical stale-listing flexibility.
Questions for the listing agent
- What do current leases actually rent for vs. the listed asking? Can we see a recent rent roll and the last 12 months of T-12 income?
- It's been on market 48 days. Have you received any prior offers? Is the seller open to a 25% concession, seller financing, or rate buy-down credit?
- Built in 1966 — when were the roof, HVAC, electrical panel, plumbing, and water heater last replaced?
- What does the HOA fee cover, when was the last increase, and are there any pending special assessments or reserve-fund shortfalls?
- Any open or pending special assessments — roof, HVAC, plumbing, elevator, façade? What's the per-unit balance and payoff schedule, and is the seller paying it off at close or rolling it to the buyer?
- Is there a deadline driving the sale (1031 exchange, divorce, estate, relocation)? That informs how much negotiation room exists.
- Schools are A-rated — typically a magnet for longer-tenancy family renters. What's the average tenant stay here, and is there a school-zone premium baked into asking?
- What's the average days-on-market for RENTAL listings here right now (not sales)? A rising rental-DOM trend means longer vacancies and softer asking-rent achievability than the comps imply.
- What's the recent tenant-quality profile in this submarket — average credit score on applications, eviction rate, late-payment / NSF rate, and stable-employment percentage? A property-management company in the area should have these aggregated.
- How much new apartment / multifamily construction is in the pipeline within 1–3 miles? Heavy new supply (>2% of stock underway) typically softens rents 12–24 months out; light construction supports rent growth.
Investment metrics
- 1% rule
- 0.75% ✗
- Cap rate
- 4.62%
- Cash-on-cash
- -5.97%
- DSCR
- 0.73
- GRM
- 11.1
CMA / ARV
- ARV (median comp)
- $1,061,667
- List price
- $730,000
- Delta
- -31.24%
- Verdict
- UNDERPRICED
- Comps
- 20 within 1.0 mi
Projected returns pro-forma
7.05% appreciation · 3.0% rent growth · sell at horizon
- IRR
- 13.2%
- Equity multiple
- 1.94×
- Total profit
- $192,507
- Equity at exit
- $508,054
- IRR
- 13.5%
- Equity multiple
- 3.98×
- Total profit
- $608,291
- Equity at exit
- $967,057
Cash invested: $204,400 (down + closing). Projections, not guarantees.
Landlord ↔ Tenant lean methodology
- Overall (STATE)
- 18 Strongly Tenant-Friendly
- State California
- 18 Strongly Tenant-Friendly · D+13
- County
- — inherits STATE
- City
- — inherits STATE
ZIP-level market 94925
- Home prices YoY
- 2.4%
- Active inventory
- 40
- Price-to-rent
- 11.1×
Monthly cashflow live
- Estimated rent
- $5,466 high interval (Pro) →
- Mortgage (P&I)
- −$3,828
- Tax from tax record
- −$218 /mo · $2,613/yr
- Insurance
- −$304
- HOA
- −$984
- Vacancy / Maint / Mgmt
- −$1,148
- Net cashflow
- $-1,016
Break-even live
UW: 25.0% down · 7.5% · 30yr · 1.5% tax · 5.0% vac · 8.0% maint · 8.0% mgmt
Financing live
Cash to close
- Down payment
- $182,500
- Closing costs
- $21,900
- Reserves months
- —
- Total cash needed
- —
Loan-product check · same deal, 3 products live
Conventional
25% down · 7.5% · 30yr
- Down + closing
- —
- Monthly P&I
- —
- Monthly cashflow
- —
- DSCR
- —
- Eligible?
- —
Personal DTI + credit; lowest rate.
DSCR
20% down · 8.5% · 30yr
- Down + closing
- —
- Monthly P&I
- —
- Monthly cashflow
- —
- DSCR
- —
- Eligible?
- —
No personal income docs; deal must DSCR.
Hard money
10% down · 12.0% · 12mo
- Down + closing
- —
- Monthly P&I
- —
- Monthly cashflow
- —
- DSCR
- —
- Eligible?
- —
Short-term bridge; refi at stabilization.
Rent comps 12 comps
| Address | Beds | Baths | Sqft | Rent | $/sqft | DOM | Units | Dist |
|---|---|---|---|---|---|---|---|---|
| 159 Prince Royal Dr Corte Madera, CA | 3.0 | 2.0 | 1200 | $6,995 | $5.83 | 16d | 1 | 0.24mi |
| 350 Robin Dr Corte Madera, CA | 2.0–3.0 | 2.0 | 1458 | $7,872 | $5.40 | 1d | 9 | 0.83mi |
| 45 Tamal Vista Blvd Corte Madera, CA | 2.0 | 1.0 | 890 | $2,950 | $3.31 | 1d | 1 | 1.24mi |
| 45 Tamal Vista Blvd Corte Madera, CA | 2.0 | 1.0 | 890 | $2,950 | $3.31 | 19d | 1 | 1.24mi |
| 16 S Knoll Rd Unit 102 Mill Valley, CA | 2.0 | 1.0 | 1100 | $3,200 | $2.91 | 13d | 1 | 1.25mi |
| 16 S Knoll Rd Unit 102 Mill Valley, CA | 2.0 | 1.0 | 1100 | $3,200 | $2.91 | 1d | 1 | 1.25mi |
| 21 Circle Dr Belvedere Tiburon, CA | 2.0 | 2.0 | 900 | $3,000 | $3.33 | 1d | 1 | 1.40mi |
| 199 Tamal Vista Blvd Corte Madera, CA | 1.0–3.0 | 1.0–2.0 | 1018 | $7,995 | $7.85 | 1d | 24 | 1.41mi |
| 32 Circle Dr Unit B Belvedere Tiburon, CA | 2.0 | 2.0 | 1025 | $3,800 | $3.71 | 16d | 1 | 1.46mi |
| 32 Circle Dr Unit A Belvedere Tiburon, CA | 2.0 | 2.0 | 1025 | $3,900 | $3.80 | 1d | 1 | 1.46mi |
| 24 Andrew Dr #78 Belvedere Tiburon, CA | 3.0 | 2.0 | 1300 | $4,995 | $3.84 | 23d | 1 | 1.50mi |
| 10 Andrew Dr Belvedere Tiburon, CA | 2.0 | 1.0 | 1220 | $2,450 | $2.01 | 1d | 1 | 1.50mi |
HOA detail condo
- Monthly dues
- $984 · $11,808/yr
- Assessments
- None detected in remarks — confirm with the listing agent.
Listing history 15 events
-
2026-06-18days on market $730,000 Active 48 DOM
-
2026-06-17days on market $730,000 Active 47 DOM
-
2026-06-16days on market $730,000 Active 46 DOM
-
2026-06-15days on market $730,000 Active 45 DOM
-
2026-06-13days on market $730,000 Active 43 DOM
-
2026-06-13days on market $730,000 Active 42 DOM
-
2026-06-09days on market $730,000 Active 39 DOM
-
2026-06-08days on market $730,000 Active 38 DOM
-
2026-06-07days on market $730,000 Active 37 DOM
-
2026-06-04days on market $730,000 Active 34 DOM
-
2026-06-03days on market $730,000 Active 33 DOM
-
2026-06-02days on market $730,000 Active 32 DOM
-
2026-06-01days on market $730,000 Active 31 DOM
-
2026-05-31days on market $730,000 Active 30 DOM
-
2026-05-01$730,000 Active 1310-char remark
ⓘ Source: listings_history table (triggers on properties + properties_extension) + one-shot
backfill from property_details.listing_events for pre-trigger history.
Tax reassessment forecast CA · Resets to sale price
- Current annual tax
- $2,613 · $218/mo
- Projected year-2 tax
- $5,548 · $462/mo
- Expected delta
- +$2,935/yr (+$245/mo · 112.3%)
ⓘ Screening estimate from a state-policy table — verify with the county assessor before closing.
Climate risk First Street
- Flood 1/10 Low FEMA zone X (unshaded) · 0% chance over 30 yrs
- Wildfire 3/10 Moderate
- Heat 3/10 Moderate 7 d/yr ≥83°F today · 17 d/yr by 30 yrs out
- Wind 1/10 Low
- Air quality 8/10 Severe 13 unhealthy d/yr today · 13 by 30 yrs out
Nearby sold comps map
Loading sold comps map…
Walkable amenities ~0.75 mi
Loading nearby amenities…
Taxation est. · year 1
- Rental income
- $65,590
- − Mortgage interest
- −$40,891
- − Property taxes
- −$2,613
- − Insurance
- −$3,650
- − Repairs & maintenance
- −$5,247
- − Management
- −$5,247
- − HOA
- −$11,808
- − Depreciation
- −$21,236
- Taxable loss
- −$25,103
- Est. tax savings @ 24.0%
- +$6,025
- After-tax cash flow
- $-6,169/yr
For passive investors: Depreciation is non-cash, so a rental often shows a tax loss while cash-flowing — sheltering income. Rental losses are passive: they offset passive income freely, and up to $25,000/yr can offset ordinary (W-2) income if you actively participate and your MAGI is under $100k (phasing out to $0 by $150k); unused losses carry forward. On sale, claimed depreciation is recaptured at up to 25%, and gains may owe capital-gains tax (a 1031 exchange can defer both). Figures are a year-1 estimate at your 24.0% rate — not tax advice; consult a CPA.
Schools (NCES district)
- District
- Tamalpais Union High
- NCES district ID
- 0638790
- Math proficiency
- 62% ▲ 4.00%
- Reading proficiency
- 78% ▲ 6.00%
- Median HH income
- $106,037
- Composite
- 64.66/100
- National rank
- #527
- State rank
- #42 of 517 in CA
Livability — Corte Madera
- Score
- 83/100
- State rank
- #26
- US rank
- #984
Category grades
Schools grade is shown separately in the Schools card above.
Census & demographics
- Census place
- Corte Madera, CA
- County
- Marin County · 243,328 people
- City population
- 10,077
- Metro
- San Francisco-Oakland-Berkeley, CA
- Population (ZIP)
- 10,077
- Household income
- $232,763
- Rent vs Own
- Severe rent burden
- 169.0
Population outlook (Marin County) Hauer SSP2
- Today (2025)
- 276,379 people
- By 2030
- 282,942 · +2.4%
- By 2040
- 292,937 · +6.0%
- By 2050
- 300,449 · +8.7%
- By 2075
- 316,946 · +14.7%
- By 2100
- 303,948 · +10.0%
Race, ethnicity, and origin ACS 2023
- Neighborhood character
- Predominantly White (72%)
- Race & ethnicity
- White 72% Hispanic / Latino 12% Two or more races 12% Asian 6% Black 1%
- Hispanic origin (detail)
- Mexican 7%
- Common ancestry
- Romanian 5% Italian 5% Lithuanian 3%
- Foreign-born
- 12% · Canada, South Korea, China
- Languages at home
- 84% English-only · Spanish 6% Other Indo-European 5% German/W. Germanic 1%
Political lean MEDSL · Marin
- 2024 margin
- Solid D (+63.9) · D 80.6% · R 16.7% · Other 2.7%
- 2008→2024 swing
- +6.2pp toward D · 2008: 57.7pp · 2024: 63.9pp
- All cycles
- 2024: D+63.9 2020: D+66.5 2016: D+62.9 2012: D+50.5 2008: D+57.7
Not yet ingested
- Civics
- —
Market trends
- HPI YoY
- ▲ 7.05%
- Current HPI
- 298.9243
- Rent YoY
- —
- Metro
- San Francisco-Oakland-Berkeley, CA
- State GDP YoY
- ▲ 3.21%
- F500 in state
- 116
Industry mix (Fortune 500 HQ in CA)
| Industry | F500 HQs | Revenue |
|---|---|---|
| Technology | 27 | $1,492B |
|
||
| Financial Services | 3 | $174B |
|
||
| Retail | 3 | $44B |
|
||
| Insurance | 3 | $26B |
|
||
| Media / Entertainment | 2 | $115B |
|
||
| Pharmaceuticals / Biotech | 2 | $62B |
|
||
Price history
1 event — show timeline
- 2026-05-01 Listed $730,000 BAREIS
Property tax history
+3.1%/yrLatest (2025): $2,613 · +11.0% YoY. Source: county tax records.
Cash-flow waterfall
monthlySold comps — $/sqft
last 12 mo · ≤1 miLoading sold comps…