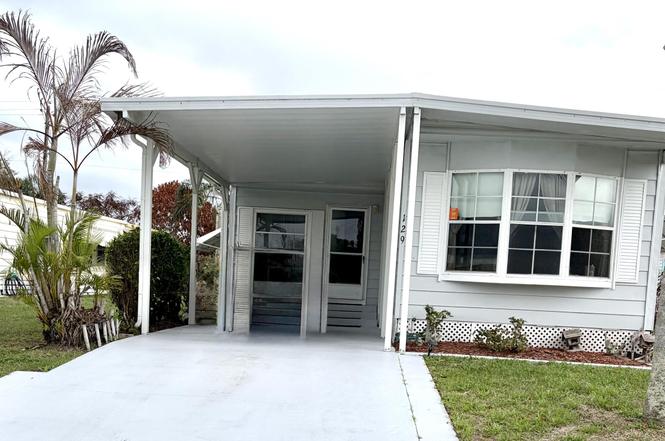
129 E Caribbean · Port St. Lucie, FL
Flood risk 1/10 · Minimal
- FEMA flood zone
- X (unshaded)
- Chance of flooding over 30 yrs
- 0.0%
- Est. flood insurance / yr
- $507 – $1,088
Fire risk 3/10 · Minor
- Est. fire insurance / yr
- $947 – $1,759
Heat risk 10/10 · Severe
- Hot days now (above 106°F)
- 7 days/yr
- Hot days in 30 yrs
- 22 days/yr
Wind risk 10/10 · Severe
- Chance of severe wind over 30 yrs
- 99.0%
Air-quality risk 2/10 · Minimal
- Unhealthy air days now
- 1 days/yr
- Unhealthy air days in 30 yrs
- 1 days/yr
Risk factors via First Street. Map © Google.
Why this score? — see what drove the D grade
The composite is a weighted blend of 9 inputs, each scored 0–100. Each bar is that input's sub-score; the figure is the points it added to the 100-point composite (weight × sub-score).
- Cash flow +15.0/30.0
- ARV discount +7.5/15.0
- 1% rule +5.0/10.0
- DSCR +5.0/10.0
- Schools +3.7/10.0
- Rent growth +3.0/5.0
- Livability +2.5/5.0
- Condition / age +2.5/5.0
- Appreciation +0.0/10.0
$42,000
🖨 Deal sheet (PDF) 📄 Offer letter ✓ Due diligence
Listing remarks
Settle in here at 129 East Caribbean located in a great 55+ community with active and energetic residents. Lot's of golf, fishing, shopping, boating, music, churches, dining, theater, sports and car shows all you can do! This 2 bedroom split layout gives access to privacy when guest arrive with 2 separate baths and a large Florida room you'll have plenty of space. There is a good work room (can be a studio) and separate indoor laundry and storage. There is carpet clean without too much wear and the private suite in the master (NEW SUBFLOOR) does need finish with buyers choice. Outside your Florida room you'll enjoy hours of soaking up nature and cooking up a nice steak on the grill with the
Key facts
- Work room
- Landscaped
- Florida room
Tags
Property features AI
Finance
- Other: Living area reported as 1,440; Mobile home length approx. 60' and width 24'; Resale condition; Water heater listed as a green energy-efficient feature
- Financial info: Land lease required: $997 monthly (lease expires 2026-03-01)
- HOA & community: Located in a senior community; Pets allowed (restrictions may apply)
Exterior
- Parking: 2 total parking spaces; Attached carport (1 covered carport space); Driveway with open parking space
- Security: Security patrol
- Utilities: Public water; Public sewer; Electricity available; Cable available
- Home design: Manufactured (double wide) home; One-story; Entry off driveway; North-facing
- Construction: Double wide manufactured construction; Skirted; Roof over
- Exterior features: Open patio; Patio; Landscaped interior lot; Private paved road frontage; No waterfront
Interior
- Kitchen: Dishwasher; Electric range; Microwave; Refrigerator; Electric water heater
- Bedrooms: 2 bedrooms on the main level
- Flooring: Carpet; Tile; Vinyl; Other
- Bathrooms: 2 full bathrooms (both on main level)
- Heating & cooling: Central electric heating; Central air conditioning; Ceiling fans; Wall/window units
- Interior features: Split bedroom layout; Blinds and bay windows
- Laundry & utility: Indoor laundry room with washer hookup
Neighborhood map
What this means for you Summary
Snapshot
- This is a 2-bed/2.0-bath manufactured listed at $42k.
Deal economics
- At list price, monthly cash flow is $1k ($16k/yr) — positive.
- The deal already cash-flows at list — no discount required.
- Meets the 1% rule at list price ($2k rent vs $42k).
- Recommended offer: $38k (9.0% below list) — sets the bar for market timing.
- Cap rate 43.7% vs local median 3.9% in Port St. Lucie — top-decile yield for the area; either an underpriced asset or a hidden risk that comps aren't pricing in. Stress-test before assuming the spread holds.
Location & tenants
- Location reads: area grade D — affects rentability + tenant quality, not the cash-flow math above.
- St. Lucie (urban): math 40% / reading 48% proficiency, ranked #51 of 73 in FL (top 70%) — families likely to look elsewhere, expect single-tenant / working-renter base with shorter leases.
- Market conditions: Rents rising (+1.9%/yr); 646 active listings in the ZIP; 24 comparable units currently listed for rent nearby; rentals at typical pace (median 25d on market — plan ~3-4 weeks tenant-placement turnaround); 4,868 units permitted in St. Lucie County in 2024 (268 in 5+ unit buildings).
- This rent runs 39% of the median local income ($62k/yr) — at the standard rent-burdened threshold; future hikes will face affordability resistance.
Forward outlook
- Local home prices are declining (-3.0%/yr); year-one equity from $290 of loan paydown is wiped out by about $1k of value loss. Plan a longer hold.
- St. Lucie County population projected at +20% by 2050 — long-run rental-demand tailwind backs the buy-and-hold thesis.
- At projected returns (-3.0% appreciation + 1.9% rent growth), your $12k cash investment doubles in ~1 year — after that, you're playing with house money.
Negotiation context
- It's been on market 99 days — a 9% lower offer ($38k) is reasonable based on typical stale-listing flexibility.
- 3 sale attempts with the ask held roughly flat each time — persistent listings suggest the price (not the market) is what's stuck; bring a comps-based counter.
Risks & watch-outs
- Climate carrying-cost: severe wind risk, 99% chance of damaging wind over 30y; extreme-heat days projected 7→22/yr by 2055 (HVAC capex compounding) — expect insurance premiums to compound above CPI over the hold.
Questions for the listing agent
- It's been on market 99 days. Have you received any prior offers? Is the seller open to a 9% concession, seller financing, or rate buy-down credit?
- Why hasn't it sold? Are there any deal-killer items the seller is aware of (foundation, flood, title, zoning, code violations)?
- Is there a deadline driving the sale (1031 exchange, divorce, estate, relocation)? That informs how much negotiation room exists.
- The area grade is low — what's the realistic commute time and amenity access for the typical tenant pool here? Any planned neighborhood developments (good or bad) we should know about?
- What's the average days-on-market for RENTAL listings here right now (not sales)? A rising rental-DOM trend means longer vacancies and softer asking-rent achievability than the comps imply.
- What's the recent tenant-quality profile in this submarket — average credit score on applications, eviction rate, late-payment / NSF rate, and stable-employment percentage? A property-management company in the area should have these aggregated.
- How much new for-sale + rental construction is in the pipeline within 1–3 miles? Heavy new supply typically softens prices + rents 12–24 months out; constrained supply supports both.
Investment metrics
- 1% rule
- 4.82% ✓
- Cap rate
- 43.67%
- Cash-on-cash
- 133.51%
- DSCR
- 6.94
- GRM
- 1.7
CMA / ARV
- ARV (on-the-fly)
- $178,560
- Comps found
- 12
Show comp detail 12 sales within ~0.75 mi
| Address | Dist | Beds/Ba | Sqft | Sold | Price | $/sf | Match |
|---|---|---|---|---|---|---|---|
| 110 W Caribbean | 0.38mi | 2/2.0 | 1,416 (-2%) | 5mo | $77,500 | $55 | 75 |
| 10 Padre | 0.29mi | 2/2.0 | 1,280 (-11%) | 4mo | $38,000 | $30 | 65 |
| 8526 Lidflower Ct | 0.40mi | 3/2.5 (+1) | 1,404 (-2%) | 6mo | $70,900 | $50 | 65 |
| 8394 Delphinium Ct | 0.58mi | 3/2.0 (+1) | 1,392 (-3%) | 4mo | $220,000 | $158 | 60 |
| 192 W Caribbean | 0.70mi | 2/2.0 | 1,416 (-2%) | 6mo | $49,000 | $35 | 60 |
| 3700 Westchester Ct | 0.69mi | 2/2.0 | 1,480 (+3%) | 8mo | $130,000 | $88 | 57 |
| 8504 Gallberry Cir | 0.41mi | 2/2.0 | 1,264 (-12%) | 4mo | $178,000 | $141 | 57 |
| 3792 Satinwood Ct | 0.51mi | 2/2.0 | 1,238 (-14%) | 8mo | $153,000 | $124 | 46 |
| 2948 Fiddlewood Cir | 0.74mi | 2/2.0 | 1,280 (-11%) | 1mo | $122,000 | $95 | 46 |
| 3033 Satinleaf Ln | 0.73mi | 2/2.0 | 1,248 (-13%) | 4mo | $195,000 | $156 | 40 |
| 3720 Pebble Bch | 0.75mi | 3/2.0 (+1) | 1,608 (+12%) | 3mo | $225,000 | $140 | 38 |
| 3801 Westchester Ct | 0.70mi | 2/2.0 | 1,225 (-15%) | 7mo | $210,000 | $171 | 37 |
Match score weights: distance 35% · size 25% · config 20% · recency 20%. Top-matched comps best support the ARV.
Projected returns pro-forma
-3.0% appreciation · 1.92% rent growth · sell at horizon
- IRR
- —
- Equity multiple
- 7.32×
- Total profit
- $74,380
- Equity at exit
- $6,262
- IRR
- —
- Equity multiple
- 14.90×
- Total profit
- $163,459
- Equity at exit
- $3,631
Cash invested: $11,760 (down + closing). Projections, not guarantees.
Landlord ↔ Tenant lean methodology
- Overall (STATE)
- 87 Strongly Landlord-Friendly
- State Florida
- 87 Strongly Landlord-Friendly · R+3
- County
- — inherits STATE
- City
- — inherits STATE
ZIP-level market 34952
- Home prices YoY
- -29.6%
- Rents YoY
- 1.9%
- Active inventory
- 646
- Price-to-rent
- 1.7×
Monthly cashflow live
- Estimated rent
- $2,024 high interval (Pro) →
- Mortgage (P&I)
- −$220
- Tax est. 1.5%
- −$52 /mo · $630/yr
- Insurance
- −$18
- HOA
- −$0
- Vacancy / Maint / Mgmt
- −$425
- Net cashflow
- $1,308
Break-even live
Sensitivity live
| Price | -10% $1,337 | -5% $1,323 | +0% $1,308 | +5% $1,294 | +10% $1,279 |
|---|---|---|---|---|---|
| Rent | -10% $1,149 | -5% $1,228 | +0% $1,308 | +5% $1,388 | +10% $1,468 |
| Rate | -1.0pp $1,330 | -0.5pp $1,319 | base $1,308 | +0.5pp $1,297 | +1.0pp $1,286 |
UW: 25.0% down · 7.5% · 30yr · 1.5% tax · 5.0% vac · 8.0% maint · 8.0% mgmt
Financing live
Cash to close
- Down payment
- $10,500
- Closing costs
- $1,260
- Reserves months
- —
- Total cash needed
- —
Loan-product check · same deal, 3 products live
Conventional
25% down · 7.5% · 30yr
- Down + closing
- —
- Monthly P&I
- —
- Monthly cashflow
- —
- DSCR
- —
- Eligible?
- —
Personal DTI + credit; lowest rate.
DSCR
20% down · 8.5% · 30yr
- Down + closing
- —
- Monthly P&I
- —
- Monthly cashflow
- —
- DSCR
- —
- Eligible?
- —
No personal income docs; deal must DSCR.
Hard money
10% down · 12.0% · 12mo
- Down + closing
- —
- Monthly P&I
- —
- Monthly cashflow
- —
- DSCR
- —
- Eligible?
- —
Short-term bridge; refi at stabilization.
Rent comps 24 comps
| Address | Beds | Baths | Sqft | Rent | $/sqft | DOM | Units | Dist |
|---|---|---|---|---|---|---|---|---|
| 1131 SE Parrish Ct Port Saint Lucie, FL | 2.0 | 1.0 | 902 | $2,000 | $2.22 | 24d | 1 | 0.29mi |
| 71 W Caribbean Port St. Lucie, FL | 2.0 | 2.0 | 1417 | $1,700 | $1.20 | 24d | 1 | 0.29mi |
| 2082 SE Wild Meadow Cir Port Saint Lucie, FL | 2.0 | 2.0 | 1524 | $1,850 | $1.21 | 24d | 1 | 0.32mi |
| 2058 SE Wild Meadow Cir #101 Port St Lucie, FL | 2.0 | 2.5 | 1425 | $2,200 | $1.54 | 15d | 1 | 0.33mi |
| 2183 SE Wild Meadow Cir Port Saint Lucie, FL | 2.0 | 2.0 | 1550 | $1,900 | $1.23 | 15d | 1 | 0.35mi |
| 2130 SE Wild Meadow Cir Port Saint Lucie, FL | 2.0 | 2.0 | 1440 | $1,695 | $1.18 | 15d | 1 | 0.37mi |
| 1811 SE Walton Lakes Dr Port Saint Lucie, FL | 2.0 | 1.0–2.0 | 1117 | $1,926 | $1.72 | 15d | 6 | 0.39mi |
| 2209 SE East Dunbrooke Cir Port Saint Lucie, FL | 3.0 | 2.0 | 1212 | $2,950 | $2.43 | 15d | 1 | 0.50mi |
| 3784 Sapodilla Ct Port Saint Lucie, FL | 2.0 | 2.0 | 1121 | $2,300 | $2.05 | 24d | 1 | 0.52mi |
| 1810 SE Pinewood Trl Port Saint Lucie, FL | 1.0–2.0 | 1.0–2.0 | 1013 | $2,055 | $2.03 | 15d | 7 | 0.70mi |
| 1500 SE Tiffany Club Pl Port Saint Lucie, FL | 1.0–3.0 | 1.0–2.0 | 895 | $1,922 | $2.15 | 15d | 7 | 0.81mi |
| 1520 SE Royal Green Cir Unit K-203 Port St. Lucie, FL | 2.0 | 2.0 | 886 | $1,800 | $2.03 | 24d | 1 | 1.01mi |
| 1516 SE Royal Green Cir #202 Port St Lucie, FL | 3.0 | 2.0 | 921 | $2,100 | $2.28 | 24d | 1 | 1.01mi |
| 1900 Bella Vista Way Port Saint Lucie, FL | 1.0–2.0 | 1.0–2.0 | 995 | $1,764 | $1.77 | 15d | 15 | 1.02mi |
| 1455 SE Colchester Cir Port Saint Lucie, FL | 2.0 | 2.0 | 921 | $1,795 | $1.95 | 15d | 1 | 1.07mi |
| 1537 SE Royal Green Cir Unit E204 Port St. Lucie, FL | 2.0 | 2.0 | 886 | $1,750 | $1.98 | 15d | 1 | 1.07mi |
| 1548 SE Royal Green Cir Unit M-103 Port St. Lucie, FL | 2.0 | 2.0 | 886 | $1,800 | $2.03 | 24d | 1 | 1.12mi |
| 1618 SE Elkhart Ter Port Saint Lucie, FL | 3.0 | 2.0 | 1176 | $2,200 | $1.87 | 24d | 1 | 1.30mi |
| 2051 SE Hillmoor Dr Port Saint Lucie, FL | 1.0–2.0 | 1.0–2.0 | 1014 | $2,539 | $2.50 | 24d | 15 | 1.35mi |
| 301 SE Castle Ct Port St. Lucie, FL | 2.0 | 2.5 | 1688 | $2,900 | $1.72 | 24d | 1 | 1.38mi |
| 1900 SE Hillmoor Dr Port Saint Lucie, FL | 2.0–3.0 | 2.0–2.5 | 1182 | $1,799 | $1.52 | 15d | 14 | 1.41mi |
| 2061 SE Glen Ridge Dr Port Saint Lucie, FL | 2.0 | 2.5 | 1350 | $1,925 | $1.43 | 24d | 1 | 1.44mi |
| 1401 SE Appamattox Ter Port Saint Lucie, FL | 3.0 | 2.0 | 1358 | $2,500 | $1.84 | 24d | 1 | 1.47mi |
| 9905 S US Highway 1 Port Saint Lucie, FL | 1.0–2.0 | 1.0–2.0 | 966 | $2,239 | $2.32 | 15d | 15 | 1.50mi |
Listing history 29 events
-
2026-06-21days on market $42,000 Active 99 DOM
-
2026-06-18days on market $42,000 Active 96 DOM
-
2026-06-17days on market $42,000 Active 95 DOM
-
2026-06-16days on market $42,000 Active 94 DOM
-
2026-06-15days on market $42,000 Active 93 DOM
-
2026-06-14days on market $42,000 Active 91 DOM
-
2026-06-13days on market $42,000 Active 90 DOM
-
2026-06-10days on market $42,000 Active 88 DOM
-
2026-06-09days on market $42,000 Active 87 DOM
-
2026-06-08days on market $42,000 Active 86 DOM
-
2026-06-07days on market $42,000 Active 85 DOM
-
2026-06-05days on market $42,000 Active 82 DOM
-
2026-06-03days on market $42,000 Active 81 DOM
-
2026-06-02days on market $42,000 Active 80 DOM
-
2026-06-01days on market $42,000 Active 79 DOM
-
2026-05-31days on market $42,000 Active 78 DOM
-
2026-05-30days on market $42,000 Active 77 DOM
-
2026-03-14$42,000 Active
-
2026-03-11historical
-
2025-11-07price $44,850
-
2025-11-07price $44,900
-
2025-09-24$45,000 Active
-
2025-09-24historical
-
2025-08-09price $45,000
-
2025-08-08price $48,678
-
2025-08-05price $48,789
-
2025-07-21price $48,990
-
2025-07-18price $49,994
-
2025-07-07$49,999 Active
ⓘ Source: listings_history table (triggers on properties + properties_extension) + one-shot
backfill from property_details.listing_events for pre-trigger history.
Climate risk First Street
- Flood 1/10 Low FEMA zone X (unshaded) · 0% chance over 30 yrs
- Wildfire 3/10 Moderate
- Heat 10/10 Extreme 7 d/yr ≥106°F today · 22 d/yr by 30 yrs out
- Wind 10/10 Extreme 99% chance of damaging wind over 30 yrs
- Air quality 2/10 Low 1 unhealthy d/yr today · 1 by 30 yrs out
Nearby sold comps map
Loading sold comps map…
Walkable amenities ~0.75 mi
Loading nearby amenities…
Taxation est. · year 1
- Rental income
- $24,283
- − Mortgage interest
- −$2,353
- − Property taxes
- −$630
- − Insurance
- −$210
- − Repairs & maintenance
- −$1,943
- − Management
- −$1,943
- − Depreciation
- −$1,222
- Taxable income
- $15,983
- Est. tax owed @ 24.0%
- −$3,836
- After-tax cash flow
- $11,864/yr
For passive investors: Depreciation is non-cash, so a rental often shows a tax loss while cash-flowing — sheltering income. Rental losses are passive: they offset passive income freely, and up to $25,000/yr can offset ordinary (W-2) income if you actively participate and your MAGI is under $100k (phasing out to $0 by $150k); unused losses carry forward. On sale, claimed depreciation is recaptured at up to 25%, and gains may owe capital-gains tax (a 1031 exchange can defer both). Figures are a year-1 estimate at your 24.0% rate — not tax advice; consult a CPA.
Schools (NCES district)
- District
- St. Lucie
- NCES district ID
- 1201770
- Math proficiency
- 40% ▼ -11.00%
- Reading proficiency
- 48% ▼ -4.00%
- Median HH income
- $44,737
- Composite
- 37.28/100
- National rank
- #4449
- State rank
- #51 of 73 in FL
Livability — Port St. Lucie
No livability data for this city. (Only ~50 U.S. cities are tracked.)
Census & demographics
- Census place
- Port St. Lucie, FL
- County
- Saint Lucie County · 337,150 people
- City population
- 221,051
- Metro
- Port St. Lucie, FL
- Population (ZIP)
- 42,655
- Household income
- $61,628
- Rent vs Own
- Severe rent burden
- 1759.0
Population outlook (St. Lucie County) Hauer SSP2
- Today (2025)
- 338,016 people
- By 2030
- 355,687 · +5.2%
- By 2040
- 385,521 · +14.1%
- By 2050
- 406,106 · +20.1%
- By 2075
- 441,054 · +30.5%
- By 2100
- 436,885 · +29.2%
Race, ethnicity, and origin ACS 2023
- Neighborhood character
- Diverse neighborhood (Simpson 0.57)
- Race & ethnicity
- White 62% Hispanic / Latino 19% Two or more races 14% Black 10% Asian 3%
- Hispanic origin (detail)
- Mexican 4% Puerto Rican 4% Cuban 2% Dominican 2%
- Common ancestry
- Romanian 3% Lithuanian 2% Hispanic 1%
- Foreign-born
- 18% · Canada, Jamaica, China
- Languages at home
- 76% English-only · Spanish 16% French/Haitian/Cajun 3% Tagalog/Filipino 2%
Political lean MEDSL · St. Lucie
- 2024 margin
- Lean R (+9.1) · D 45.1% · R 54.2%
- 2008→2024 swing
- -21.2pp toward R · 2008: 12.1pp · 2024: -9.1pp
- All cycles
- 2024: R+9.1 2020: R+1.6 2016: R+2.5 2012: D+7.9 2008: D+12.1
Not yet ingested
- Civics
- —
Market trends
- HPI YoY
- ▼ -155.80%
- Current HPI
- 371.0573
- Rent YoY
- ▲ 1.92%
- Metro
- Port St. Lucie, FL
- State GDP YoY
- ▲ 3.28%
- F500 in state
- 36
Industry mix (Fortune 500 HQ in FL)
| Industry | F500 HQs | Revenue |
|---|---|---|
| Industrial Technology | 2 | $29B |
|
||
| Insurance | 2 | $17B |
|
||
| Retail | 1 | $60B |
|
||
| Technology Distribution | 1 | $58B |
|
||
| Homebuilding | 1 | $35B |
|
||
| Technology Manufacturing | 1 | $35B |
|
||
Price history
-16.0% since first listed12 events — show timeline
- 2026-03-14 Listed $42,000 Beaches MLS
- 2026-03-11 Listing Removed — Beaches MLS
- 2025-11-07 Price Changed $44,850 Beaches MLS
- 2025-11-07 Price Changed $44,900 Beaches MLS
- 2025-09-24 Listing Removed — Beaches MLS
- 2025-09-24 Listed $45,000 Beaches MLS
- 2025-08-09 Price Changed $45,000 Beaches MLS
- 2025-08-08 Price Changed $48,678 Beaches MLS
- 2025-08-05 Price Changed $48,789 Beaches MLS
- 2025-07-21 Price Changed $48,990 Beaches MLS
- 2025-07-18 Price Changed $49,994 Beaches MLS
- 2025-07-07 Listed $49,999 Beaches MLS
Cash-flow waterfall
monthlySold comps — $/sqft
last 12 mo · ≤1 miLoading sold comps…