7716 Creek #2 · Rockford, IL
Flood risk No data
- FEMA flood zone
- —
- Chance of flooding over 30 yrs
- —
- Est. flood insurance / yr
- —
Fire risk No data
- Est. fire insurance / yr
- —
Heat risk No data
- Hot days now (above threshold)
- —
- Hot days in 30 yrs
- —
Wind risk No data
- Chance of severe wind over 30 yrs
- —
Air-quality risk No data
- Unhealthy air days now
- —
- Unhealthy air days in 30 yrs
- —
Risk factors via First Street. Map © Google.
Why this score? — see what drove the D+ grade
The composite is a weighted blend of 9 inputs, each scored 0–100. Each bar is that input's sub-score; the figure is the points it added to the 100-point composite (weight × sub-score).
- Cash flow +18.6/30.0
- ARV discount +7.5/15.0
- 1% rule +6.9/10.0
- DSCR +5.9/10.0
- Livability +3.1/5.0
- Rent growth +2.5/5.0
- Condition / age +2.2/5.0
- Schools +1.2/10.0
- Appreciation +0.0/10.0
$145,000
🖨 Deal sheet (PDF) 📄 Offer letter ✓ Due diligence
Listing remarks
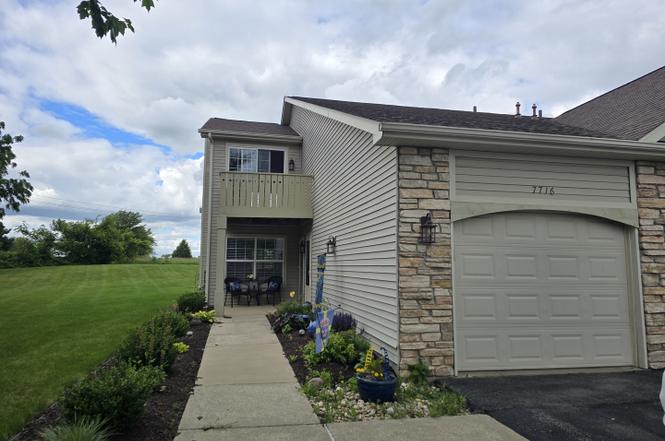
Located in highly desirable location near I-90, dining, entertainment & more. .. this 2 Br, 2 Bath, Upper Unit condo is ready for your cosmetic touches! New carpeting/flooring of your choice would transform this condo into what you've desired! Vaulted ceilings & 2 sets of sliders leading to 2 decks allow for lots of light & outdoor space to enjoy. The primary Br offers a WIC & private full bath w/ marble tile flooring & granite counter. Outside there is a large common greenspace, nearby recreation path & there's no maintenance needed since the HOA handles all the mowing & shoveling. Your water & trash removal are also included in your HOA fee.
Key facts
- Attached garage
- $225 HOA
- Garage
Tags
Property features AI
Finance
- Other: Parcel number on file; Property not currently leased; Ownership: Condo
- HOA & community: Monthly association fee of $225; Association covers water, exterior maintenance, lawn care, snow removal, and other items; Pets allowed (cats and dogs) with size limit (max 20 lbs)
Exterior
- Parking: Attached garage (garage owned) with garage door opener; Asphalt parking; 1 garage space, 1 total parking space
- Utilities: Public water; Public sewer; 100 amp electric service with circuit breakers
- Home design: Attached single condo; Entry level: 2; Interstate access nearby
- Construction: Built approximately 26–30 years ago; Vinyl siding and stone exterior; Asphalt roof; Part of a 4-unit building
- Exterior features: Deck; Balcony; Common grounds; Cul-de-sac; Level lot
Interior
- Kitchen: Galley kitchen with pantry closet; Range; Microwave; Dishwasher; Refrigerator
- Bedrooms: Master bedroom on main level (15 x 13); Second bedroom on main level (11 x 10); Additional bedrooms listed
- Flooring: Carpet in living room and bedrooms
- Bathrooms: 2 full bathrooms
- Heating & cooling: Natural gas heating; Central air conditioning
- Interior features: Walk-in closets; Open floorplan; Dining area combined with living room; Gas log fireplace in living room; 4 total rooms
- Laundry & utility: In-unit laundry with washer hookup; Washer; Dryer; Water softener (owned)
Neighborhood map
What this means for you Summary
Snapshot
- This is a 2-bed/2.0-bath condo listed at $145k. Condition is rated fair.
Deal economics
- At list price, monthly cash flow is $141 ($2k/yr) — positive.
- The deal already cash-flows at list — no discount required.
- Meets the 1% rule at list price ($2k rent vs $145k).
- Cap rate 7.5% vs local median 6.1% in Rockford — meaningfully above typical; check what's discounted (condition, days-on-market, listing class) to confirm the premium yield is real.
Location & tenants
- Location reads 62/100 on livability (#876 in IL) — a middle-class / working-renter tenant base. Strengths: cost of living A+, housing A+, health & safety A+; Watch: crime F, amenities F, commute F.
- Rockford SD 205 (urban): math 12% / reading 16% proficiency, ranked #533 of 620 in IL (top 86%) — low school quality limits family demand, transient renter base, plan for 1-2y turnover; 73% free/reduced lunch — lower-income household profile, screen leases tightly.
- Zoned schools: Spring Creek Elem School (math 17% / reading 22%, grade F, #1,054 of 2,056 statewide, top 54%, 501 students, 0% FRL); Eisenhower Middle School (math 9% / reading 17%, grade F, #540 of 665 statewide, top 82%, 961 students, 0% FRL); Guilford High School (math 15% / reading 28%, grade F, #345 of 693 statewide, top 50%, 2,071 students, 0% FRL) — zoned schools average 0% FRL vs 73% district-wide (73 pts lower); this property's tenant base skews higher-income than the district average.
- Market conditions: 74 active listings in the ZIP; 4 comparable units currently listed for rent nearby; rentals at typical pace (median 15d on market — plan ~3-4 weeks tenant-placement turnaround); 285 units permitted in Winnebago County in 2024 (0 in 5+ unit buildings).
Forward outlook
- Local home prices are declining (-3.0%/yr); year-one equity from $1k of loan paydown is wiped out by about $4k of value loss. Plan a longer hold.
- Winnebago County population projected at -20% by 2050 — secular population decline; favor cash flow + early exit over multi-decade hold.
Negotiation context
- Only 3 days on market — expect competitive offers; lowballing is unlikely to land.
Questions for the listing agent
- Have any recent inspections been done? Can we get a copy of the seller's disclosures and any deferred-maintenance estimates?
- What does the HOA fee cover, when was the last increase, and are there any pending special assessments or reserve-fund shortfalls?
- Any open or pending special assessments — roof, HVAC, plumbing, elevator, façade? What's the per-unit balance and payoff schedule, and is the seller paying it off at close or rolling it to the buyer?
- Is there a deadline driving the sale (1031 exchange, divorce, estate, relocation)? That informs how much negotiation room exists.
- Schools are F-rated, which usually means shorter tenancies and higher turnover. Who's the typical renter profile here, and what's been the actual vacancy rate?
- Crime grade is F in this area — have there been break-ins, vandalism, or insurance claims at this property in the last 3 years? What carrier currently insures it and at what premium?
- The area grade is low — what's the realistic commute time and amenity access for the typical tenant pool here? Any planned neighborhood developments (good or bad) we should know about?
- What's the average days-on-market for RENTAL listings here right now (not sales)? A rising rental-DOM trend means longer vacancies and softer asking-rent achievability than the comps imply.
- What's the recent tenant-quality profile in this submarket — average credit score on applications, eviction rate, late-payment / NSF rate, and stable-employment percentage? A property-management company in the area should have these aggregated.
- How much new apartment / multifamily construction is in the pipeline within 1–3 miles? Heavy new supply (>2% of stock underway) typically softens rents 12–24 months out; light construction supports rent growth.
Investment metrics
- 1% rule
- 1.19% ✓
- Cap rate
- 7.46%
- Cash-on-cash
- 4.17%
- DSCR
- 1.19
- GRM
- 7.0
CMA / ARV
No comps found within radius.
Projected returns pro-forma
-3.0% appreciation · 3.0% rent growth · sell at horizon
- IRR
- -9.7%
- Equity multiple
- 0.65×
- Total profit
- $-14,344
- Equity at exit
- $21,620
- IRR
- -0.1%
- Equity multiple
- 0.99×
- Total profit
- $-249
- Equity at exit
- $12,537
Cash invested: $40,600 (down + closing). Projections, not guarantees.
Landlord ↔ Tenant lean methodology
- Overall (STATE)
- 43 Moderately Tenant-Leaning
- State Illinois
- 43 Moderately Tenant-Leaning · D+7
- County
- — inherits STATE
- City
- — inherits STATE
ZIP-level market 61114
- Home prices YoY
- -27.1%
- Active inventory
- 74
- Price-to-rent
- 7.0×
Monthly cashflow live
- Estimated rent
- $1,732 medium interval (Pro) →
- Mortgage (P&I)
- −$760
- Tax est. 1.5%
- −$181 /mo · $2,175/yr
- Insurance
- −$60
- HOA
- −$225
- Vacancy / Maint / Mgmt
- −$364
- Net cashflow
- $141
Break-even live
Sensitivity live
| Price | -10% $241 | -5% $191 | +0% $141 | +5% $91 | +10% $41 |
|---|---|---|---|---|---|
| Rent | -10% $4 | -5% $73 | +0% $141 | +5% $210 | +10% $278 |
| Rate | -1.0pp $214 | -0.5pp $178 | base $141 | +0.5pp $104 | +1.0pp $65 |
UW: 25.0% down · 7.5% · 30yr · 1.5% tax · 5.0% vac · 8.0% maint · 8.0% mgmt
Financing live
Cash to close
- Down payment
- $36,250
- Closing costs
- $4,350
- Reserves months
- —
- Total cash needed
- —
Loan-product check · same deal, 3 products live
Conventional
25% down · 7.5% · 30yr
- Down + closing
- —
- Monthly P&I
- —
- Monthly cashflow
- —
- DSCR
- —
- Eligible?
- —
Personal DTI + credit; lowest rate.
DSCR
20% down · 8.5% · 30yr
- Down + closing
- —
- Monthly P&I
- —
- Monthly cashflow
- —
- DSCR
- —
- Eligible?
- —
No personal income docs; deal must DSCR.
Hard money
10% down · 12.0% · 12mo
- Down + closing
- —
- Monthly P&I
- —
- Monthly cashflow
- —
- DSCR
- —
- Eligible?
- —
Short-term bridge; refi at stabilization.
Rent comps 4 comps
| Address | Beds | Baths | Sqft | Rent | $/sqft | DOM | Units | Dist |
|---|---|---|---|---|---|---|---|---|
| 7273 Mabels Way Loves Park, IL | 3.0 | 1.5 | 1800 | $2,225 | $1.24 | 15d | 1 | 0.79mi |
| 7422 Chucks Way Caledonia, IL | 2.0 | 1.0 | 1029 | $1,800 | $1.75 | 45d | 1 | 1.04mi |
| 7494 Thomas Dr Loves Park, IL | 2.0 | 1.0 | 1029 | $1,650 | $1.60 | 15d | 1 | 1.16mi |
| 4112 Applewood Ln Loves Park, IL | 1.0 | 1.0 | 975 | $1,050 | $1.08 | 15d | 1 | 1.19mi |
HOA detail condo
- Monthly dues
- $225 · $2,700/yr
- Likely covers
- watertrash
- Assessments
- None detected in remarks — confirm with the listing agent.
Listing history 3 events
-
2026-06-21days on market $145,000 Active 3 DOM
-
2026-06-19remarks 667-char remark
-
2026-06-19$145,000 Active 1 DOM
ⓘ Source: listings_history table (triggers on properties + properties_extension) + one-shot
backfill from property_details.listing_events for pre-trigger history.
Nearby sold comps map
Loading sold comps map…
Walkable amenities ~0.75 mi
Loading nearby amenities…
Taxation est. · year 1
- Rental income
- $20,783
- − Mortgage interest
- −$8,122
- − Property taxes
- −$2,175
- − Insurance
- −$725
- − Repairs & maintenance
- −$1,663
- − Management
- −$1,663
- − HOA
- −$2,700
- − Depreciation
- −$4,218
- Taxable loss
- −$483
- Est. tax savings @ 24.0%
- +$116
- After-tax cash flow
- $1,809/yr
For passive investors: Depreciation is non-cash, so a rental often shows a tax loss while cash-flowing — sheltering income. Rental losses are passive: they offset passive income freely, and up to $25,000/yr can offset ordinary (W-2) income if you actively participate and your MAGI is under $100k (phasing out to $0 by $150k); unused losses carry forward. On sale, claimed depreciation is recaptured at up to 25%, and gains may owe capital-gains tax (a 1031 exchange can defer both). Figures are a year-1 estimate at your 24.0% rate — not tax advice; consult a CPA.
Condition & rehab AI · 13 photos
The property is in fair condition with some cosmetic repairs and maintenance needed. A touch-up of the exterior paint and trimming of the landscaping would significantly improve its curb appeal and value.
Repairs flagged
- Minor Paint touch-up — Paint on exterior appears faded in some areas, indicating the need for touch-up or repainting.
- Minor Landscaping trimming — Landscaping includes a fence and some plants, but appears somewhat unkempt and could benefit from trimming and maintenance.
Value-add opportunities
- Both Paint touch-up and landscaping trimming — Paint touch-up and landscaping trimming will improve the curb appeal and overall condition of the property, making it more attractive to potential buyers or renters.
Renovation cost estimate screening
| Repair item | Severity | Est. cost |
|---|---|---|
| Paint touch-up · Paint on exterior appears faded in some areas, indicating the need for touch-up or repainting. | Minor | $500–3,000 |
| Landscaping trimming · Landscaping includes a fence and some plants, but appears somewhat unkempt and could benefit from trimming and maintenance. | Minor | $500–3,000 |
| Total estimated repair cost · 2 items | $1,000–6,000 |
Value-add ROI direction
- Both Paint touch-up and landscaping trimming — Paint touch-up and landscaping trimming will improve the curb appeal and overall condition of the property, making it more attractive to potential buyers or renters. ↑
ⓘ Cost ranges are severity-bucket heuristics (US national rule-of-thumb). Get contractor quotes + a written scope before underwriting a rehab budget.
Schools (NCES district)
- District
- Rockford SD 205
- NCES district ID
- 1734510
- Math proficiency
- 12% ▼ -2.00%
- Reading proficiency
- 16% ▼ -3.00%
- Median HH income
- $42,533
- Composite
- 12.21/100
- National rank
- #9649
- State rank
- #533 of 620 in IL
Livability — Rockford
- Score
- 62/100
- State rank
- #876
- US rank
- #17035
Category grades
Schools grade is shown separately in the Schools card above.
Census & demographics
- Census place
- Rockford, IL
- City population
- 147,297
- Population (ZIP)
- 15,026
Population outlook (Winnebago County) Hauer SSP2
- Today (2025)
- 271,080 people
- By 2030
- 260,684 · -3.8%
- By 2040
- 238,405 · -12.1%
- By 2050
- 216,129 · -20.3%
- By 2075
- 172,882 · -36.2%
- By 2100
- 135,336 · -50.1%
Race, ethnicity, and origin ACS 2023
- Neighborhood character
- Predominantly White (72%)
- Race & ethnicity
- White 72% Hispanic / Latino 11% Black 10% Two or more races 6% Asian 4%
- Hispanic origin (detail)
- Mexican 10%
- Common ancestry
- Romanian 5% Portuguese 3% Lithuanian 2%
- Foreign-born
- 10% · Canada, Vietnam
- Languages at home
- 85% English-only · Spanish 7% Russian/Polish/Slavic 2% Other Indo-European 2%
Political lean MEDSL · Winnebago
- 2024 margin
- Toss-up / Even · D 49.5% · R 49.0% · Other 1.5%
- 2008→2024 swing
- -12.2pp toward R · 2008: 12.8pp · 2024: 0.6pp
- All cycles
- 2024: D+0.6 2020: D+2.5 2016: R+1.2 2012: D+5.7 2008: D+12.8
Not yet ingested
- Civics
- —
Market trends
- HPI YoY
- ▼ -84.00%
- Current HPI
- 225.8485
- Rent YoY
- —
- Metro
- —
- State GDP YoY
- ▲ 1.59%
- F500 in state
- 60
Industry mix (Fortune 500 HQ in IL)
| Industry | F500 HQs | Revenue |
|---|---|---|
| Insurance | 4 | $201B |
|
||
| Consumer Goods | 4 | $87B |
|
||
| Industrial Machinery | 3 | $64B |
|
||
| Healthcare | 2 | $55B |
|
||
| Retail / Pharmacy | 1 | $148B |
|
||
| Agriculture / Food | 1 | $86B |
|
||
Price history
1 event — show timeline
- 2026-06-18 Listed $145,000 MRED as Distributed by MLS Grid
Cash-flow waterfall
monthlySold comps — $/sqft
last 12 mo · ≤1 miLoading sold comps…