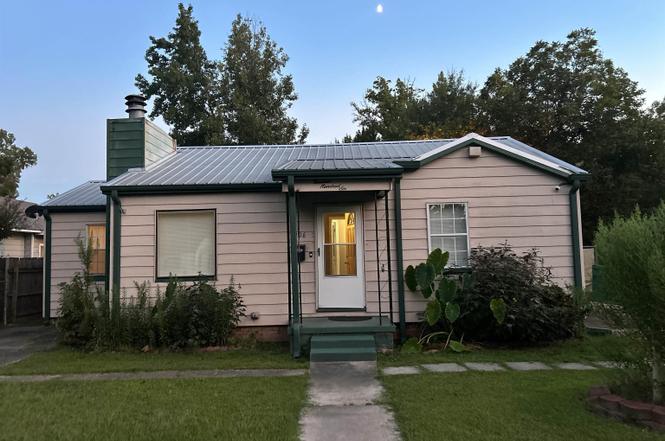
1906 W 21st Ave · Pine Bluff, AR
Flood risk 1/10 · Minimal
- FEMA flood zone
- X (unshaded)
- Chance of flooding over 30 yrs
- 0.0%
- Est. flood insurance / yr
- $507 – $1,088
Fire risk 1/10 · Minimal
- Est. fire insurance / yr
- $1,499 – $2,785
Heat risk 6/10 · Moderate
- Hot days now (above 110°F)
- 7 days/yr
- Hot days in 30 yrs
- 19 days/yr
Wind risk 4/10 · Minor
- Chance of severe wind over 30 yrs
- 24.0%
Air-quality risk 1/10 · Minimal
- Unhealthy air days now
- 0 days/yr
- Unhealthy air days in 30 yrs
- 0 days/yr
Risk factors via First Street. Map © Google.
Why this score? — see what drove the C grade
The composite is a weighted blend of 9 inputs, each scored 0–100. Each bar is that input's sub-score; the figure is the points it added to the 100-point composite (weight × sub-score).
- Cash flow +30.0/30.0
- 1% rule +10.0/10.0
- DSCR +10.0/10.0
- Rent growth +2.5/5.0
- Livability +2.5/5.0
- Condition / age +2.5/5.0
- Schools +0.6/10.0
- ARV discount +0.0/15.0
- Appreciation +0.0/10.0
$55,000
🖨 Deal sheet 📄 Offer letter ✓ Due diligence
Listing remarks
Wow! You will love this renovated family home in the center of town; renovations include updated baths & kitchen, a sunroom, wet bare, and more. There is one bonus room that could easily be converted into a third bedroom! This home is affordable and move-in ready! Don't wait, call today!!
Key facts
- Move-in ready
- Updated baths
- Wet bar
Tags
Property features AI
Exterior
- Parking: Carport for 2 cars
- Utilities: Public sewer; Public water; Municipal electric service (Entergy)
- Home design: Frame exterior
- Construction: Crawl space foundation; Metal roof
- Exterior features: Level lot; Paved road access; Inside city limits
Interior
- Kitchen: Free-standing stove
- Flooring: Vinyl flooring; Carpet
- Bathrooms: 1 full bath; 1 half bath
- Heating & cooling: Central heating (gas); Central cooling (electric)
- Interior features: Sun room; Wood-burning site-built fireplace
Neighborhood map
What this means for you Summary
Snapshot
- This is a 3-bed/1.0-bath single-family listed at $55k.
Deal economics
- At list price, monthly cash flow is $367 ($4k/yr) — positive.
- The deal already cash-flows at list — no discount required.
- Meets the 1% rule at list price ($895 rent vs $55k).
- Recommended offer: $48k (12.0% below list) — sets the bar for market timing.
- Cap rate 14.3% vs local median 9.0% in Pine Bluff — top-decile yield for the area; either an underpriced asset or a hidden risk that comps aren't pricing in. Stress-test before assuming the spread holds.
Location & tenants
- Location reads 50/100 on livability (#483 in AR) — a working-class tenant base; expect higher turnover. Strengths: cost of living A+, housing A; Watch: schools F, crime F, amenities F.
- Pine Bluff School District (urban): math 6% / reading 9% proficiency, ranked #236 of 238 in AR (top 99%) — low school quality limits family demand, transient renter base, plan for 1-2y turnover; 85% free/reduced lunch — lower-income household profile, screen leases tightly.
- Market conditions: 212 active listings in the ZIP; 2 comparable units currently listed for rent nearby; 62 units permitted in Jefferson County in 2024 (0 in 5+ unit buildings).
Forward outlook
- Local home prices are declining (-3.0%/yr); year-one equity from $380 of loan paydown is wiped out by about $2k of value loss. Plan a longer hold.
- Jefferson County population projected at -33% by 2050 — secular population decline; favor cash flow + early exit over multi-decade hold.
- At projected returns (-3.0% appreciation + 3.0% rent growth), your $15k cash investment doubles in ~5 years — after that, you're playing with house money.
Negotiation context
- It's been on market 207 days — a 12% lower offer ($48k) is reasonable based on typical stale-listing flexibility.
- 4 sale attempts since 3y ago; this cycle's ask has dropped $24k (31%) from the opening price — seller is motivated, your offer sets the floor, not the list.
Risks & watch-outs
- Watch-outs: built in 1952 — expect roof / HVAC / electrical / plumbing capex.
- Climate carrying-cost: extreme-heat days projected 7→19/yr by 2055 (HVAC capex compounding) — expect insurance premiums to compound above CPI over the hold.
Questions for the listing agent
- It's been on market 207 days. Have you received any prior offers? Is the seller open to a 12% concession, seller financing, or rate buy-down credit?
- Built in 1952 — when were the roof, HVAC, electrical panel, plumbing, and water heater last replaced?
- Why hasn't it sold? Are there any deal-killer items the seller is aware of (foundation, flood, title, zoning, code violations)?
- Is there a deadline driving the sale (1031 exchange, divorce, estate, relocation)? That informs how much negotiation room exists.
- Schools are F-rated, which usually means shorter tenancies and higher turnover. Who's the typical renter profile here, and what's been the actual vacancy rate?
- Crime grade is F in this area — have there been break-ins, vandalism, or insurance claims at this property in the last 3 years? What carrier currently insures it and at what premium?
- What's the average days-on-market for RENTAL listings here right now (not sales)? A rising rental-DOM trend means longer vacancies and softer asking-rent achievability than the comps imply.
- What's the recent tenant-quality profile in this submarket — average credit score on applications, eviction rate, late-payment / NSF rate, and stable-employment percentage? A property-management company in the area should have these aggregated.
- How much new for-sale + rental construction is in the pipeline within 1–3 miles? Heavy new supply typically softens prices + rents 12–24 months out; constrained supply supports both.
Investment metrics
- 1% rule
- 1.63% ✓
- Cap rate
- 14.31%
- Cash-on-cash
- 28.63%
- DSCR
- 2.27
- GRM
- 5.1
CMA / ARV
- ARV (on-the-fly)
- $42,444
- Comps found
- 12
Show comp detail 12 sales within ~0.75 mi
| Address | Dist | Beds/Ba | Sqft | Sold | Price | $/sf | Match |
|---|---|---|---|---|---|---|---|
| 1704 S Cedar | 0.27mi | 3/2.0 | 1,586 (+1%) | 7mo | $43,000 | $27 | 76 |
| 1504 W 18th Ave | 0.30mi | 3/2.0 | 1,530 (-3%) | 10mo | $15,000 | $10 | 69 |
| 1508 W 18th Ave | 0.29mi | 3/2.0 | 1,611 (+2%) | 11mo | $15,000 | $9 | 69 |
| 2212 S Maple St | 0.11mi | 3/1.5 | 1,340 (-15%) | 0mo | $42,000 | $31 | 68 |
| 2800 S Cherry St | 0.67mi | 3/1.5 | 1,546 (-2%) | 3mo | $90,000 | $58 | 62 |
| 2104 W 21st Ave | 0.13mi | 4/2.0 (+1) | 1,388 (-12%) | 7mo | $50,000 | $36 | 60 |
| 1705 W 29th Ave | 0.55mi | 3/2.0 | 1,599 (+2%) | 14mo | $36,500 | $23 | 56 |
| 1604 W 31st | 0.73mi | 3/2.0 | 1,728 (+10%) | 4mo | $60,000 | $35 | 42 |
| 1507 W 29th Ave | 0.58mi | 4/1.5 (+1) | 1,423 (-10%) | 17mo | $35,000 | $25 | 36 |
| 1416 W 14th | 0.55mi | 2/1.0 (-1) | 1,376 (-12%) | 20mo | $22,000 | $16 | 32 |
| 702 W 20th Ave | 0.70mi | 3/1.0 | 1,360 (-14%) | 18mo | $30,000 | $22 | 30 |
| 2408 W 26th Ave | 0.50mi | 4/1.5 (+1) | 1,336 (-15%) | 18mo | $49,500 | $37 | 29 |
Match score weights: distance 35% · size 25% · config 20% · recency 20%. Top-matched comps best support the ARV.
Projected returns pro-forma
-3.0% appreciation · 3.0% rent growth · sell at horizon
- IRR
- 22.9%
- Equity multiple
- 1.94×
- Total profit
- $14,477
- Equity at exit
- $8,201
- IRR
- 30.9%
- Equity multiple
- 3.77×
- Total profit
- $42,692
- Equity at exit
- $4,755
Cash invested: $15,400 (down + closing). Projections, not guarantees.
Landlord ↔ Tenant lean methodology
- Overall (STATE)
- 92 Strongly Landlord-Friendly
- State Arkansas
- 92 Strongly Landlord-Friendly · R+14
- County
- — inherits STATE
- City
- — inherits STATE
ZIP-level market 71603
- Home prices YoY
- -26.0%
- Active inventory
- 212
- Price-to-rent
- 5.1×
Monthly cashflow live
- Estimated rent
- $895 medium interval (Pro) →
- Mortgage (P&I)
- −$288
- Tax from tax record
- −$28 /mo · $340/yr
- Insurance
- −$23
- HOA
- −$0
- Vacancy / Maint / Mgmt
- −$188
- Net cashflow
- $367
Break-even live
UW: 25.0% down · 7.5% · 30yr · 1.5% tax · 5.0% vac · 8.0% maint · 8.0% mgmt
Financing live
Cash to close
- Down payment
- $13,750
- Closing costs
- $1,650
- Reserves months
- —
- Total cash needed
- —
Loan-product check · same deal, 3 products live
Conventional
25% down · 7.5% · 30yr
- Down + closing
- —
- Monthly P&I
- —
- Monthly cashflow
- —
- DSCR
- —
- Eligible?
- —
Personal DTI + credit; lowest rate.
DSCR
20% down · 8.5% · 30yr
- Down + closing
- —
- Monthly P&I
- —
- Monthly cashflow
- —
- DSCR
- —
- Eligible?
- —
No personal income docs; deal must DSCR.
Hard money
10% down · 12.0% · 12mo
- Down + closing
- —
- Monthly P&I
- —
- Monthly cashflow
- —
- DSCR
- —
- Eligible?
- —
Short-term bridge; refi at stabilization.
Rent comps 2 comps
| Address | Beds | Baths | Sqft | Rent | $/sqft | DOM | Units | Dist |
|---|---|---|---|---|---|---|---|---|
| 2404 S Walnut St Pine Bluff, AR | 2.0 | 1.0 | 1100 | $700 | $0.64 | 44d | 1 | 0.94mi |
| 304 W Harding Ave Unit 3 Pine Bluff, AR | 2.0 | 1.0 | 1180 | $715 | $0.61 | 44d | 1 | 1.01mi |
Listing history 26 events
-
2026-06-19days on market $55,000 Active 207 DOM
-
2026-06-18days on market $55,000 Active 206 DOM
-
2026-06-17days on market $55,000 Active 205 DOM
-
2026-06-16days on market $55,000 Active 204 DOM
-
2026-06-15days on market $55,000 Active 203 DOM
-
2026-06-14days on market $55,000 Active 201 DOM
-
2026-06-12statusdays on market $55,000 Active 200 DOM
-
2026-06-09days on market $55,000 Price Change 197 DOM
-
2026-06-08days on market $55,000 Price Change 196 DOM
-
2026-06-07pricestatusdays on market $55,000 Price Change 195 DOM
-
2026-06-05days on market $60,000 Active 192 DOM
-
2026-06-03days on market $60,000 Active 191 DOM
-
2026-06-02days on market $60,000 Active 190 DOM
-
2026-06-01days on market $60,000 Active 189 DOM
-
2026-05-31statusdays on market $60,000 Active 188 DOM
-
2026-05-30days on market $60,000 Price Change 187 DOM
-
2026-05-25price $60,000
-
2026-05-25status Price Change
-
2026-03-01historical
-
2025-08-31$79,500 New Listing
-
2023-10-23historical
-
2023-08-21price $80,000
-
2023-08-21status Back on Market
-
2023-08-05historical
-
2023-07-03price $84,000
-
2023-02-04$89,250 New Listing
ⓘ Source: listings_history table (triggers on properties + properties_extension) + one-shot
backfill from property_details.listing_events for pre-trigger history.
Tax reassessment forecast AR · Resets to sale price
- Current annual tax
- $340 · $28/mo
- Projected year-2 tax
- $352 · $29/mo
- Expected delta
- +$12/yr (+$1/mo · 3.5%)
ⓘ Screening estimate from a state-policy table — verify with the county assessor before closing.
Climate risk First Street
- Flood 1/10 Low FEMA zone X (unshaded) · 0% chance over 30 yrs
- Wildfire 1/10 Low
- Heat 6/10 Major 7 d/yr ≥110°F today · 19 d/yr by 30 yrs out
- Wind 4/10 Moderate 24% chance of damaging wind over 30 yrs
- Air quality 1/10 Low 0 unhealthy d/yr today · 0 by 30 yrs out
Nearby sold comps map
Loading sold comps map…
Walkable amenities ~0.75 mi
Loading nearby amenities…
Taxation est. · year 1
- Rental income
- $10,741
- − Mortgage interest
- −$3,081
- − Property taxes
- −$340
- − Insurance
- −$275
- − Repairs & maintenance
- −$859
- − Management
- −$859
- − Depreciation
- −$1,600
- Taxable income
- $3,726
- Est. tax owed @ 24.0%
- −$894
- After-tax cash flow
- $3,515/yr
For passive investors: Depreciation is non-cash, so a rental often shows a tax loss while cash-flowing — sheltering income. Rental losses are passive: they offset passive income freely, and up to $25,000/yr can offset ordinary (W-2) income if you actively participate and your MAGI is under $100k (phasing out to $0 by $150k); unused losses carry forward. On sale, claimed depreciation is recaptured at up to 25%, and gains may owe capital-gains tax (a 1031 exchange can defer both). Figures are a year-1 estimate at your 24.0% rate — not tax advice; consult a CPA.
Schools (NCES district)
- District
- Pine Bluff School District
- NCES district ID
- 0500026
- Math proficiency
- 6% ▼ -9.00%
- Reading proficiency
- 9% ▼ -7.00%
- Median HH income
- $32,374
- Composite
- 5.86/100
- National rank
- #10014
- State rank
- #236 of 238 in AR
Livability — Pine Bluff
- Score
- 50/100
- State rank
- #483
- US rank
- #25645
Category grades
Schools grade is shown separately in the Schools card above.
Census & demographics
- Census place
- Pine Bluff, AR
- County
- Jefferson County · 29,578 people
- City population
- 29,578
- Metro
- Pine Bluff, AR
- Population (ZIP)
- 29,578
- Household income
- $53,130
- Rent vs Own
- Severe rent burden
- 657.0
Population outlook (Jefferson County) Hauer SSP2
- Today (2025)
- 63,110 people
- By 2030
- 58,519 · -7.3%
- By 2040
- 49,740 · -21.2%
- By 2050
- 42,331 · -32.9%
- By 2075
- 29,591 · -53.1%
- By 2100
- 21,047 · -66.7%
Race, ethnicity, and origin ACS 2023
- Neighborhood character
- Majority Black (62%)
- Race & ethnicity
- Black 62% White 33% Two or more races 2% Hispanic / Latino 2%
- Common ancestry
- Italian 2% Slovak 1%
- Foreign-born
- 2% · Canada
- Languages at home
- 98% English-only · Spanish 1%
Political lean MEDSL · Jefferson
- 2024 margin
- Strong D (+20.1) · D 59.2% · R 39.2% · Other 1.6%
- 2008→2024 swing
- -6.2pp toward R · 2008: 26.3pp · 2024: 20.1pp
- All cycles
- 2024: D+20.1 2020: D+21.7 2016: D+25.3 2012: D+29.0 2008: D+26.3
Not yet ingested
- Civics
- —
Market trends
- HPI YoY
- ▼ -72.43%
- Current HPI
- 206.5994
- Rent YoY
- —
- Metro
- Pine Bluff, AR
- State GDP YoY
- ▲ 3.80%
- F500 in state
- 10
Industry mix (Fortune 500 HQ in AR)
| Industry | F500 HQs | Revenue |
|---|---|---|
| Retail | 1 | $681B |
|
||
| Food / Agriculture | 1 | $53B |
|
||
| Retail / Energy | 1 | $22B |
|
||
| Transportation / Logistics | 1 | $12B |
|
||
| Energy | 1 | $4B |
|
||
Price history
-32.8% since first listed10 events — show timeline
- 2026-05-25 Price Changed $60,000 CARMLS
- 2026-05-25 Relisted — CARMLS
- 2026-03-01 Listing Removed — CARMLS
- 2025-08-31 Listed $79,500 CARMLS
- 2023-10-23 Listing Removed — CARMLS
- 2023-08-21 Price Changed $80,000 CARMLS
- 2023-08-21 Relisted — CARMLS
- 2023-08-05 Listing Removed — CARMLS
- 2023-07-03 Price Changed $84,000 CARMLS
- 2023-02-04 Listed $89,250 CARMLS
Property tax history
+95.9%/yrLatest (2025): $340 · +8.3% YoY. Source: county tax records.
Cash-flow waterfall
monthlySold comps — $/sqft
last 12 mo · ≤1 miLoading sold comps…