3420 Balaton Ave · Mulat, FL
Flood risk 1/10 · Minimal
- FEMA flood zone
- X (unshaded)
- Chance of flooding over 30 yrs
- 0.0%
- Est. flood insurance / yr
- $507 – $1,088
Fire risk 5/10 · Moderate
- Est. fire insurance / yr
- $947 – $1,759
Heat risk 10/10 · Severe
- Hot days now (above 105°F)
- 7 days/yr
- Hot days in 30 yrs
- 23 days/yr
Wind risk 9/10 · Severe
- Chance of severe wind over 30 yrs
- 99.0%
Air-quality risk 1/10 · Minimal
- Unhealthy air days now
- 0 days/yr
- Unhealthy air days in 30 yrs
- 0 days/yr
Risk factors via First Street. Map © Google.
Why this score? — see what drove the B- grade
The composite is a weighted blend of 9 inputs, each scored 0–100. Each bar is that input's sub-score; the figure is the points it added to the 100-point composite (weight × sub-score).
- Cash flow +24.9/30.0
- ARV discount +15.0/15.0
- DSCR +8.1/10.0
- 1% rule +5.3/10.0
- Schools +5.3/10.0
- Rent growth +3.6/5.0
- Condition / age +2.5/5.0
- Livability +2.1/5.0
- Appreciation +0.0/10.0
$210,000
🖨 Deal sheet 📄 Offer letter ✓ Due diligence
Listing remarks MLS
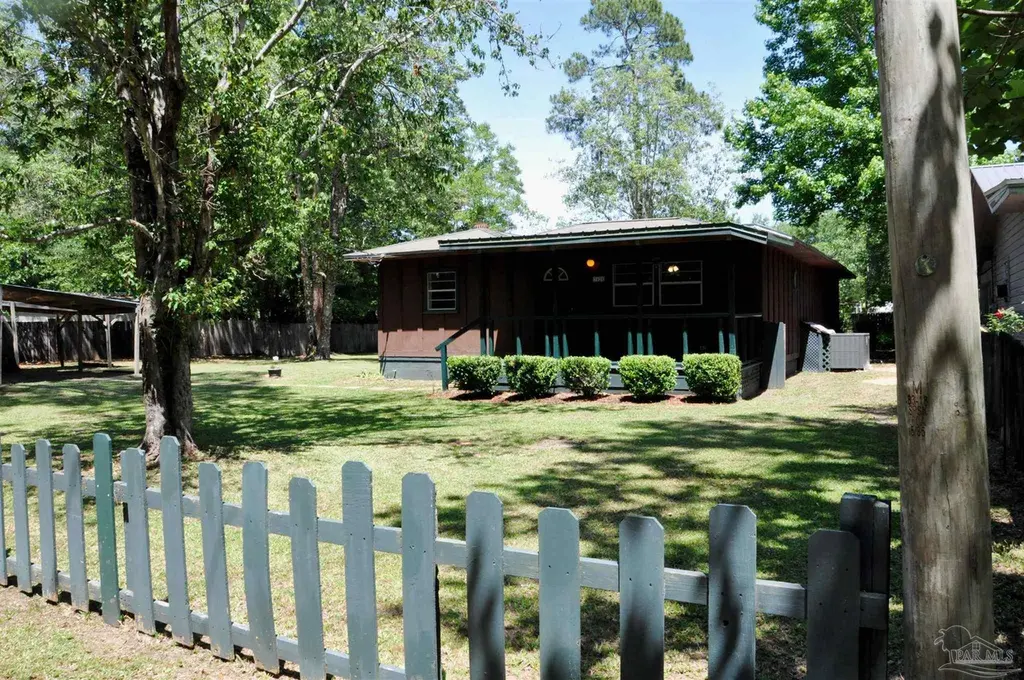
3 Bedroom, 2 Bath located in Milton, FL. This property is located in a rural area but is close to Escambia Bay. This home is in need of repair like roof, drywall, mold remediation and kitchen and bath updating. Flooring needs to be installed in some rooms and fresh paint is needed. This home would be perfect for an investor or handy buyer. Other repairs and updates may be necessary before move in ready. Property sold in its “AS-IS, WHERE-IS” condition. Seller does not prorate taxes. Buyer pays all closing costs. Seller has no knowledge of condition. It is the responsibility of the buyer to do all research.
Key facts
- Cottage off mulat rd
- 0.35 acre lot
- 2 parking spots
Tags
Property features AI
Finance
- Other: County-maintained road access; Energy-efficiency features including insulation, insulated walls, and ridge vent
- HOA & community: No homeowners association
Exterior
- Parking: Two covered parking spaces; Two-car carport
- Utilities: Public water; Public sewer (also mentions septic tank); Circuit breaker electric service; Cable available
- Home design: Single-story home; Frame construction; Resale property; Off-grade foundation
- Construction: Composition roof; Frame construction
- Exterior features: Backyard fencing; Porch; Covered deck; Workshop on the property; Interior lot
Interior
- Kitchen: Remodeled kitchen with updated flooring and cabinets; Dishwasher; ENERGY STAR qualified dishwasher and appliances; Breakfast bar and eat-in kitchen area
- Bedrooms: Primary bedroom on the first floor (approx. 16' x 14'); Two additional first-floor bedrooms (each approx. 11' x 9')
- Flooring: Carpet
- Bathrooms: Two full bathrooms; Remodeled bathrooms with updated flooring and fixtures
- Heating & cooling: Central heating; Central air conditioning; Ceiling fans for additional cooling
- Interior features: Bookcases; Ceiling fans; Vaulted ceilings; Office/Study; Double-pane windows with blinds
- Laundry & utility: Indoor laundry area with washer/dryer hookups; Electric water heater
Neighborhood map
What this means for you Summary
Snapshot
- This is a 3-bed/2.0-bath single-family listed at $210k.
Deal economics
- At list price, monthly cash flow is $454 ($5k/yr) — positive.
- The deal already cash-flows at list — no discount required.
- Meets the 1% rule at list price ($2k rent vs $210k).
Location & tenants
- Location reads 41/100 on livability (#907 in FL) — a working-class tenant base; expect higher turnover. Strengths: cost of living A+, crime A; Watch: schools F, amenities F, commute F.
- Santa Rosa (suburban): math 63% / reading 60% proficiency, ranked #8 of 73 in FL (top 11%) — acceptable for families but not a draw, mixed tenant base, ~2y average lease.
- Market conditions: Rents rising fast (+4.5%/yr); 806 active listings in the ZIP; 11 comparable units currently listed for rent nearby; rentals at typical pace (median 23d on market — plan ~3-4 weeks tenant-placement turnaround); solid renter incomes; 1,983 units permitted in Santa Rosa County in 2024 (128 in 5+ unit buildings).
- This rent runs 30% of the median local income ($85k/yr) — at the standard rent-burdened threshold; future hikes will face affordability resistance.
Forward outlook
- Local home prices are declining (-3.0%/yr); year-one equity from $1k of loan paydown is wiped out by about $6k of value loss. Plan a longer hold.
- Santa Rosa County population projected at +31% by 2050 — long-run rental-demand tailwind backs the buy-and-hold thesis.
- At projected returns (-3.0% appreciation + 4.5% rent growth), your $59k cash investment doubles in ~10 years — after that, you're playing with house money.
Negotiation context
- Only 5 days on market — expect competitive offers; lowballing is unlikely to land.
- 3 sale attempts since 10y ago with the ask held roughly flat each time — persistent listings suggest the price (not the market) is what's stuck; bring a comps-based counter.
- Current owner paid $22k; list at $210k implies a 859% gain — meaningful room to come down on a strong offer.
Risks & watch-outs
- Climate carrying-cost: severe wind risk, 99% chance of damaging wind over 30y; moderate wildfire risk; extreme-heat days projected 7→23/yr by 2055 (HVAC capex compounding) — expect insurance premiums to compound above CPI over the hold.
Questions for the listing agent
- Built in 1965 — when were the roof, HVAC, electrical panel, plumbing, and water heater last replaced?
- Is there a deadline driving the sale (1031 exchange, divorce, estate, relocation)? That informs how much negotiation room exists.
- Schools are F-rated, which usually means shorter tenancies and higher turnover. Who's the typical renter profile here, and what's been the actual vacancy rate?
- What's the average days-on-market for RENTAL listings here right now (not sales)? A rising rental-DOM trend means longer vacancies and softer asking-rent achievability than the comps imply.
- What's the recent tenant-quality profile in this submarket — average credit score on applications, eviction rate, late-payment / NSF rate, and stable-employment percentage? A property-management company in the area should have these aggregated.
- How much new for-sale + rental construction is in the pipeline within 1–3 miles? Heavy new supply typically softens prices + rents 12–24 months out; constrained supply supports both.
Investment metrics
- 1% rule
- 1.03% ✓
- Cap rate
- 8.89%
- Cash-on-cash
- 9.26%
- DSCR
- 1.41
- GRM
- 8.1
CMA / ARV
- ARV (on-the-fly)
- $275,268
- Comps found
- 11
Show comp detail 11 sales within ~0.75 mi
| Address | Dist | Beds/Ba | Sqft | Sold | Price | $/sf | Match |
|---|---|---|---|---|---|---|---|
| 5085 Carley Ct | 0.45mi | 3/2.0 | 1,571 (-1%) | 8mo | $292,900 | $186 | 71 |
| 5094 Carley Ct | 0.45mi | 3/2.0 | 1,650 (+4%) | 3mo | $295,000 | $179 | 69 |
| 5109 Carley Ct | 0.48mi | 3/2.0 | 1,657 (+5%) | 4mo | $282,500 | $170 | 66 |
| 5143 Teresa Dr | 0.55mi | 3/2.0 | 1,554 (-2%) | 6mo | $271,000 | $174 | 66 |
| 5102 Carley Ct | 0.46mi | 3/2.0 | 1,674 (+6%) | 6mo | $279,000 | $167 | 64 |
| 5054 Carley Ct | 0.41mi | 3/2.0 | 1,582 (0%) | 22mo | $270,000 | $171 | 62 |
| 3372 Childers St | 0.72mi | 3/2.0 | 1,512 (-4%) | 2mo | $349,000 | $231 | 58 |
| 5134 Carley Ct | 0.50mi | 3/2.0 | 1,657 (+5%) | 14mo | $300,000 | $181 | 57 |
| 5167 Teresa Dr | 0.58mi | 3/2.0 | 1,657 (+5%) | 15mo | $282,000 | $170 | 52 |
| 5038 Carley Ct | 0.40mi | 3/2.0 | 1,480 (-6%) | 23mo | $280,000 | $189 | 52 |
| 5159 Teresa Dr | 0.57mi | 3/2.0 | 1,664 (+5%) | 22mo | $280,000 | $168 | 46 |
Match score weights: distance 35% · size 25% · config 20% · recency 20%. Top-matched comps best support the ARV.
Projected returns pro-forma
-3.0% appreciation · 4.53% rent growth · sell at horizon
- IRR
- -0.8%
- Equity multiple
- 0.97×
- Total profit
- $-1,851
- Equity at exit
- $31,312
- IRR
- 10.2%
- Equity multiple
- 1.84×
- Total profit
- $49,485
- Equity at exit
- $18,157
Cash invested: $58,800 (down + closing). Projections, not guarantees.
Landlord ↔ Tenant lean methodology
- Overall (STATE)
- 87 Strongly Landlord-Friendly
- State Florida
- 87 Strongly Landlord-Friendly · R+3
- County
- — inherits STATE
- City
- — inherits STATE
ZIP-level market 32583
- Home prices YoY
- -11.3%
- Rents YoY
- 4.5%
- Active inventory
- 806
- Price-to-rent
- 8.1×
Monthly cashflow live
- Estimated rent
- $2,154 high interval (Pro) →
- Mortgage (P&I)
- −$1,101
- Tax from tax record
- −$59 /mo · $713/yr
- Insurance
- −$88
- HOA
- −$0
- Vacancy / Maint / Mgmt
- −$452
- Net cashflow
- $454
Break-even live
UW: 25.0% down · 7.5% · 30yr · 1.5% tax · 5.0% vac · 8.0% maint · 8.0% mgmt
Financing live
Cash to close
- Down payment
- $52,500
- Closing costs
- $6,300
- Reserves months
- —
- Total cash needed
- —
Loan-product check · same deal, 3 products live
Conventional
25% down · 7.5% · 30yr
- Down + closing
- —
- Monthly P&I
- —
- Monthly cashflow
- —
- DSCR
- —
- Eligible?
- —
Personal DTI + credit; lowest rate.
DSCR
20% down · 8.5% · 30yr
- Down + closing
- —
- Monthly P&I
- —
- Monthly cashflow
- —
- DSCR
- —
- Eligible?
- —
No personal income docs; deal must DSCR.
Hard money
10% down · 12.0% · 12mo
- Down + closing
- —
- Monthly P&I
- —
- Monthly cashflow
- —
- DSCR
- —
- Eligible?
- —
Short-term bridge; refi at stabilization.
Rent comps 11 comps
| Address | Beds | Baths | Sqft | Rent | $/sqft | DOM | Units | Dist |
|---|---|---|---|---|---|---|---|---|
| 5093 Carley Ct Milton, FL | 3.0 | 2.0 | 1657 | $1,950 | $1.18 | 13d | 1 | 0.49mi |
| 2989 N 5th Ave Milton, FL | 3.0 | 2.0 | 1144 | $2,400 | $2.10 | 23d | 1 | 0.99mi |
| 3210 Electra Dr Milton, FL | 3.0 | 2.0 | 1543 | $2,000 | $1.30 | 13d | 1 | 1.13mi |
| 5574 Peach Dr Milton, FL | 3.0 | 2.0 | 1475 | $1,900 | $1.29 | 23d | 1 | 1.26mi |
| 5508 Peach Dr Milton, FL | 3.0 | 2.0 | 1764 | $2,500 | $1.42 | 23d | 1 | 1.29mi |
| 4383 Winged Elm Ct Milton, FL | 4.0 | 2.0 | 1787 | $2,050 | $1.15 | 23d | 1 | 1.43mi |
| 5320 Cornwall Dr Milton, FL | 3.0 | 2.0 | 1703 | $2,200 | $1.29 | 13d | 1 | 1.43mi |
| 4413 Oak Vista Ln Milton, FL | 1.0–3.0 | 1.0–2.0 | 992 | $2,354 | $2.37 | 13d | 18 | 1.44mi |
| 4384 White Cedar Ct Milton, FL | 4.0 | 2.0 | 1827 | $2,100 | $1.15 | 23d | 1 | 1.45mi |
| 4328 Tiger Oak Ct Milton, FL | 4.0 | 2.0 | 1347 | $1,850 | $1.37 | 23d | 1 | 1.47mi |
| 5418 Peach Dr Milton, FL | 3.0 | 2.0 | 1611 | $2,100 | $1.30 | 23d | 1 | 1.47mi |
Listing history 6 events
-
2026-06-18days on market $210,000 Active 5 DOM
-
2026-06-17days on market $210,000 Active 4 DOM
-
2026-06-16days on market $210,000 Active 3 DOM
-
2026-06-15days on market $210,000 Active 2 DOM
-
2026-06-14remarks 699-char remark
-
2026-06-14$210,000 Active 1 DOM
ⓘ Source: listings_history table (triggers on properties + properties_extension) + one-shot
backfill from property_details.listing_events for pre-trigger history.
Tax reassessment forecast FL · Resets to sale price
- Current annual tax
- $713 · $59/mo
- Projected year-2 tax
- $1,743 · $145/mo
- Expected delta
- +$1,030/yr (+$86/mo · 144.6%)
ⓘ Screening estimate from a state-policy table — verify with the county assessor before closing.
Climate risk First Street
- Flood 1/10 Low FEMA zone X (unshaded) · 0% chance over 30 yrs
- Wildfire 5/10 Major
- Heat 10/10 Extreme 7 d/yr ≥105°F today · 23 d/yr by 30 yrs out
- Wind 9/10 Extreme 99% chance of damaging wind over 30 yrs
- Air quality 1/10 Low 0 unhealthy d/yr today · 0 by 30 yrs out
Nearby sold comps map
Loading sold comps map…
Walkable amenities ~0.75 mi
Loading nearby amenities…
Taxation est. · year 1
- Rental income
- $25,853
- − Mortgage interest
- −$11,763
- − Property taxes
- −$713
- − Insurance
- −$1,050
- − Repairs & maintenance
- −$2,068
- − Management
- −$2,068
- − Depreciation
- −$6,109
- Taxable income
- $2,081
- Est. tax owed @ 24.0%
- −$499
- After-tax cash flow
- $4,946/yr
For passive investors: Depreciation is non-cash, so a rental often shows a tax loss while cash-flowing — sheltering income. Rental losses are passive: they offset passive income freely, and up to $25,000/yr can offset ordinary (W-2) income if you actively participate and your MAGI is under $100k (phasing out to $0 by $150k); unused losses carry forward. On sale, claimed depreciation is recaptured at up to 25%, and gains may owe capital-gains tax (a 1031 exchange can defer both). Figures are a year-1 estimate at your 24.0% rate — not tax advice; consult a CPA.
Schools (NCES district)
- District
- Santa Rosa
- NCES district ID
- 1201650
- Math proficiency
- 63% ▼ -6.00%
- Reading proficiency
- 60% ▼ -5.00%
- Median HH income
- $58,161
- Composite
- 53.12/100
- National rank
- #1511
- State rank
- #8 of 73 in FL
Livability — Mulat
- Score
- 41/100
- State rank
- #907
- US rank
- #27108
Category grades
Schools grade is shown separately in the Schools card above.
Census & demographics
- Census place
- Mulat, FL
- County
- Santa Rosa County · 194,764 people
- Metro
- Pensacola-Ferry Pass-Brent, FL
- Population (ZIP)
- 31,828
- Household income
- $85,440
- Rent vs Own
- Severe rent burden
- 122.0
Population outlook (Santa Rosa County) Hauer SSP2
- Today (2025)
- 195,978 people
- By 2030
- 209,782 · +7.0%
- By 2040
- 235,293 · +20.1%
- By 2050
- 256,408 · +30.8%
- By 2075
- 298,074 · +52.1%
- By 2100
- 303,216 · +54.7%
Race, ethnicity, and origin ACS 2023
- Neighborhood character
- Predominantly White (74%)
- Race & ethnicity
- White 74% Black 11% Two or more races 10% Hispanic / Latino 6% Asian 1%
- Hispanic origin (detail)
- Mexican 3% Puerto Rican 2% Cuban 1%
- Common ancestry
- Italian 3% Slovak 2% Serbian 2%
- Foreign-born
- 3% · Canada
- Languages at home
- 94% English-only · Spanish 3%
Political lean MEDSL · Santa Rosa
- 2024 margin
- Solid R (+51.0) · D 24.1% · R 75.0%
- 2008→2024 swing
- -3.0pp toward R · 2008: -47.9pp · 2024: -51.0pp
- All cycles
- 2024: R+51.0 2020: R+46.5 2016: R+53.5 2012: R+52.6 2008: R+47.9
Not yet ingested
- Civics
- —
Market trends
- HPI YoY
- ▼ -38.35%
- Current HPI
- 301.8819
- Rent YoY
- ▲ 4.53%
- Metro
- Pensacola-Ferry Pass-Brent, FL
- State GDP YoY
- ▲ 3.28%
- F500 in state
- 36
Industry mix (Fortune 500 HQ in FL)
| Industry | F500 HQs | Revenue |
|---|---|---|
| Industrial Technology | 2 | $29B |
|
||
| Insurance | 2 | $17B |
|
||
| Retail | 1 | $60B |
|
||
| Technology Distribution | 1 | $58B |
|
||
| Homebuilding | 1 | $35B |
|
||
| Technology Manufacturing | 1 | $35B |
|
||
Price history
+1254.8% since first listed9 events — show timeline
- 2026-06-13 Listed $210,000 PARMLS
- 2017-02-22 Sold (MLS) $21,900 PARMLS
- 2016-10-17 Listed $21,900 PARMLS
- 2016-08-24 Listing Removed — PARMLS
- 2016-05-12 Listed $40,500 PARMLS
- 2006-10-03 Sold (Public Records) $81,500 Public Records
- 1992-07-01 Sold (Public Records) $15,000 Public Records
- 1987-02-01 Sold (Public Records) $15,000 Public Records
- 1984-11-01 Sold (Public Records) $15,500 Public Records
Property tax history
-2.1%/yrLatest (2025): $713 · +8.9% YoY. Source: county tax records.
Cash-flow waterfall
monthlySold comps — $/sqft
last 12 mo · ≤1 miLoading sold comps…