 Duplex
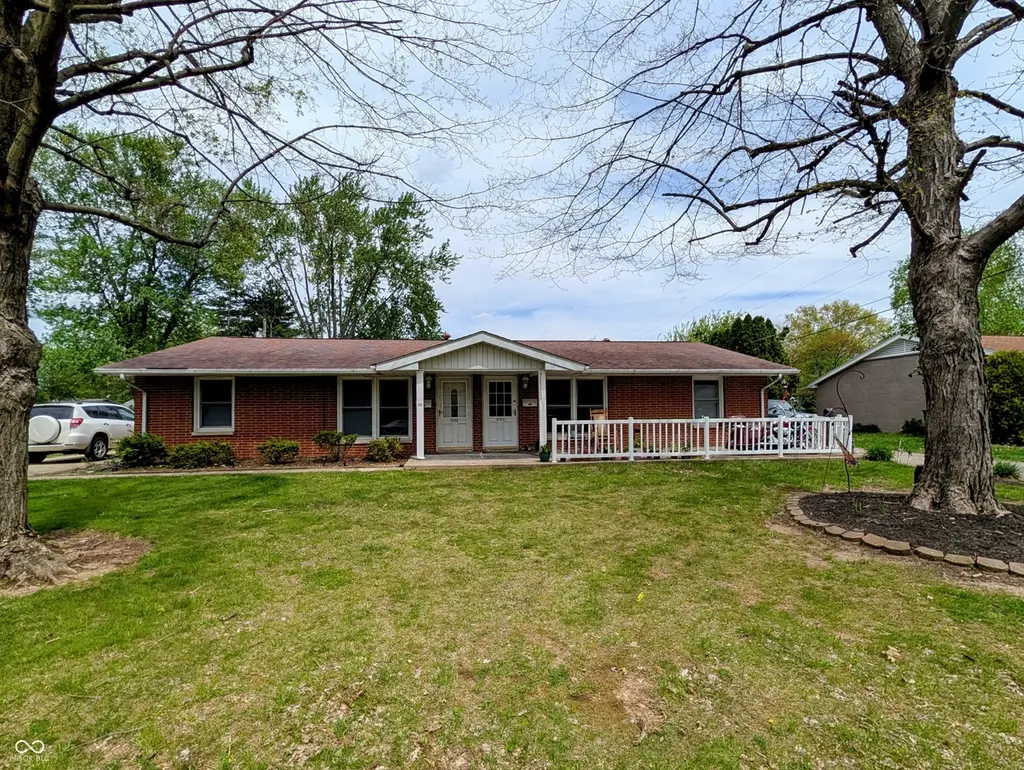
3720 Camelot Ln · Columbus, IN
Flood risk 1/10 · Minimal
- FEMA flood zone
- X (unshaded)
- Chance of flooding over 30 yrs
- 0.0%
- Est. flood insurance / yr
- $473 – $860
Fire risk 1/10 · Minimal
- Est. fire insurance / yr
- $717 – $1,331
Heat risk 4/10 · Minor
- Hot days now (above 103°F)
- 7 days/yr
- Hot days in 30 yrs
- 19 days/yr
Wind risk 2/10 · Minimal
- Chance of severe wind over 30 yrs
- 1.0%
Air-quality risk 2/10 · Minimal
- Unhealthy air days now
- 1 days/yr
- Unhealthy air days in 30 yrs
- 2 days/yr
Risk factors via First Street. Map © Google.
Why this score? — see what drove the D grade
The composite is a weighted blend of 9 inputs, each scored 0–100. Each bar is that input's sub-score; the figure is the points it added to the 100-point composite (weight × sub-score).
- Cash flow +13.3/30.0
- ARV discount +7.5/15.0
- DSCR +4.0/10.0
- Livability +4.0/5.0
- 1% rule +3.9/10.0
- Schools +3.6/10.0
- Rent growth +2.5/5.0
- Condition / age +2.5/5.0
- Appreciation +0.0/10.0
$299,900
🖨 Deal sheet (PDF) 📄 Offer letter ✓ Due diligence
Multi-family units
County records classify this as Multi-Family (2-4 Unit). Listing-text estimate: 2 units. confirmed
Listing remarks
Attention investors! This brick duplex on Camelot is now available! Not often available. A fully rented duplex in Crump Estates!
Key facts
- 0.3 acre lot
- Built 1964
- Listed 34 days
Property features AI
Finance
- Financial info: Two-unit property; Gross income reported at $31,200; Expenses reported at $719; Unit 1 rent reported at $1,250 per month (single-level); Unit 2 rent reported at $1,350 per month (two-level)
Exterior
- Utilities: No solid waste service (as reported)
- Home design: Duplex (Residential Income property); Approximately 1/4–1/2 acre lot
- Exterior features: Residential use; Road access: see remarks
Interior
- Kitchen: Kitchen in each unit
- Interior features: Basement
Neighborhood map
What this means for you Summary
Snapshot
- This is a 2 × 2-bed/1.0-bath units multifamily listed at $300k.
Deal economics
- At list price, monthly cash flow is $-1 ($-9/yr) — negative. Per door: $0/mo.
- To cash-flow at today's rent, offer at most $300k (0.0% below list).
- To meet the 1% rule (rent ≥ 1% of price), the offer needs to be $267k (10.9% below list).
- Recommended offer: $267k (10.9% below list) — sets the bar for 1% rule.
- Cap rate 6.3% vs local median 3.5% in Columbus — top-decile yield for the area; either an underpriced asset or a hidden risk that comps aren't pricing in. Stress-test before assuming the spread holds.
Location & tenants
- Location reads 79/100 on livability (#24 in IN, #1,978 nationally) — a middle-class / working-renter tenant base. Strengths: crime A+, cost of living A+, housing A+; Watch: amenities D+, commute F.
- Bartholomew Consolidated School Corporation (urban): math 38% / reading 45% proficiency, ranked #119 of 301 in IN (top 40%) — families likely to look elsewhere, expect single-tenant / working-renter base with shorter leases.
- Market conditions: 149 active listings in the ZIP; 195 units permitted in Bartholomew County in 2024 (0 in 5+ unit buildings).
- This rent runs 44% of the median local income ($72k/yr) — at the standard rent-burdened threshold; future hikes will face affordability resistance.
Forward outlook
- Local home prices are declining (-3.0%/yr); year-one equity from $2k of loan paydown is wiped out by about $9k of value loss. Plan a longer hold.
- Bartholomew County population projected at +22% by 2050 — long-run rental-demand tailwind backs the buy-and-hold thesis.
Negotiation context
- It's been on market 34 days — a 3% lower offer ($291k) is reasonable based on typical stale-listing flexibility.
- 3 sale attempts since 10y ago with the ask held roughly flat each time — persistent listings suggest the price (not the market) is what's stuck; bring a comps-based counter.
- Current owner paid $130k; list at $300k implies a 130% gain — meaningful room to come down on a strong offer.
Questions for the listing agent
- What do current leases actually rent for vs. the listed asking? Can we see a recent rent roll and the last 12 months of T-12 income?
- It's been on market 34 days. Have you received any prior offers? Is the seller open to a 11% concession, seller financing, or rate buy-down credit?
- Can we see the unit-by-unit rent roll, current vacancy, and any below-market leases? What's the average tenancy length?
- What capital expenditures (roof, boiler, parking lot, exteriors) have been made in the last 5 years, and what's planned in the next 2?
- Built in 1964 — when were the roof, HVAC, electrical panel, plumbing, and water heater last replaced?
- Is there a deadline driving the sale (1031 exchange, divorce, estate, relocation)? That informs how much negotiation room exists.
- Schools are B-rated — typically a magnet for longer-tenancy family renters. What's the average tenant stay here, and is there a school-zone premium baked into asking?
- The area grade is low — what's the realistic commute time and amenity access for the typical tenant pool here? Any planned neighborhood developments (good or bad) we should know about?
- What's the average days-on-market for RENTAL listings here right now (not sales)? A rising rental-DOM trend means longer vacancies and softer asking-rent achievability than the comps imply.
- What's the recent tenant-quality profile in this submarket — average credit score on applications, eviction rate, late-payment / NSF rate, and stable-employment percentage? A property-management company in the area should have these aggregated.
- How much new apartment / multifamily construction is in the pipeline within 1–3 miles? Heavy new supply (>2% of stock underway) typically softens rents 12–24 months out; light construction supports rent growth.
Investment metrics
- 1% rule
- 0.89% ✗
- Cap rate
- 6.29%
- Cash-on-cash
- -0.01%
- DSCR
- 1.00
- GRM
- 9.4
CMA / ARV
No comps found within radius.
Projected returns pro-forma
-3.0% appreciation · 3.0% rent growth · sell at horizon
- IRR
- -16.3%
- Equity multiple
- 0.42×
- Total profit
- $-48,578
- Equity at exit
- $44,716
- IRR
- -8.0%
- Equity multiple
- 0.50×
- Total profit
- $-42,098
- Equity at exit
- $25,930
Cash invested: $83,972 (down + closing). Projections, not guarantees.
Landlord ↔ Tenant lean methodology
- Overall (STATE)
- 90 Strongly Landlord-Friendly
- State Indiana
- 90 Strongly Landlord-Friendly · R+11
- County
- — inherits STATE
- City
- — inherits STATE
ZIP-level market 47203
- Active inventory
- 149
- Price-to-rent
- 18.7×
Monthly cashflow live
- Estimated rent
- $2,672 medium interval (Pro) →
- Mortgage (P&I)
- −$1,573
- Tax from tax record
- −$414 /mo · $4,967/yr
- Insurance
- −$125
- HOA
- −$0
- Vacancy / Maint / Mgmt
- −$561
- Net cashflow
- $-1
Break-even live
Sensitivity live
| Price | -10% $169 | -5% $84 | +0% $-1 | +5% $-86 | +10% $-170 |
|---|---|---|---|---|---|
| Rent | -10% $-212 | -5% $-106 | +0% $-1 | +5% $105 | +10% $210 |
| Rate | -1.0pp $150 | -0.5pp $76 | base $-1 | +0.5pp $-78 | +1.0pp $-157 |
2-unit breakdown (identical units grouped — click to expand)
| Units | Beds | Baths | Est. rent |
|---|---|---|---|
| 2× units | 2 | 1 | $2,672 |
| #1 | 2 | 1 | $1,336 |
| #2 | 2 | 1 | $1,336 |
| Total (2 units) | $2,672 | ||
UW: 25.0% down · 7.5% · 30yr · 1.5% tax · 5.0% vac · 8.0% maint · 8.0% mgmt
Financing live
Cash to close
- Down payment
- $74,975
- Closing costs
- $8,997
- Reserves months
- —
- Total cash needed
- —
Loan-product check · same deal, 3 products live
Conventional
25% down · 7.5% · 30yr
- Down + closing
- —
- Monthly P&I
- —
- Monthly cashflow
- —
- DSCR
- —
- Eligible?
- —
Personal DTI + credit; lowest rate.
DSCR
20% down · 8.5% · 30yr
- Down + closing
- —
- Monthly P&I
- —
- Monthly cashflow
- —
- DSCR
- —
- Eligible?
- —
No personal income docs; deal must DSCR.
Hard money
10% down · 12.0% · 12mo
- Down + closing
- —
- Monthly P&I
- —
- Monthly cashflow
- —
- DSCR
- —
- Eligible?
- —
Short-term bridge; refi at stabilization.
Listing history 4 events
-
2026-04-22$299,900 Active
-
2016-03-22soldstatus $130,400
-
2016-02-29$134,900
-
2016-02-29$134,900
ⓘ Source: listings_history table (triggers on properties + properties_extension) + one-shot
backfill from property_details.listing_events for pre-trigger history.
Tax reassessment forecast IN · Partial reset (capped growth)
- Current annual tax
- $4,967 · $414/mo
- Projected year-2 tax
- $4,967 · $414/mo
- Expected delta
- $0/yr ($0/mo · 0.0%)
ⓘ Screening estimate from a state-policy table — verify with the county assessor before closing.
Climate risk First Street
- Flood 1/10 Low FEMA zone X (unshaded) · 0% chance over 30 yrs
- Wildfire 1/10 Low
- Heat 4/10 Moderate 7 d/yr ≥103°F today · 19 d/yr by 30 yrs out
- Wind 2/10 Low 100% chance of damaging wind over 30 yrs
- Air quality 2/10 Low 1 unhealthy d/yr today · 2 by 30 yrs out
Nearby sold comps map
Loading sold comps map…
Walkable amenities ~0.75 mi
Loading nearby amenities…
Taxation est. · year 1
- Rental income
- $32,064
- − Mortgage interest
- −$16,799
- − Property taxes
- −$4,967
- − Insurance
- −$1,500
- − Repairs & maintenance
- −$2,565
- − Management
- −$2,565
- − Depreciation
- −$8,724
- Taxable loss
- −$5,056
- Est. tax savings @ 24.0%
- +$1,214
- After-tax cash flow
- $1,205/yr
For passive investors: Depreciation is non-cash, so a rental often shows a tax loss while cash-flowing — sheltering income. Rental losses are passive: they offset passive income freely, and up to $25,000/yr can offset ordinary (W-2) income if you actively participate and your MAGI is under $100k (phasing out to $0 by $150k); unused losses carry forward. On sale, claimed depreciation is recaptured at up to 25%, and gains may owe capital-gains tax (a 1031 exchange can defer both). Figures are a year-1 estimate at your 24.0% rate — not tax advice; consult a CPA.
Schools (NCES district)
- District
- Bartholomew Consolidated School Corporation
- NCES district ID
- 1800360
- Math proficiency
- 38% ▼ -11.00%
- Reading proficiency
- 45% ▼ -7.00%
- Median HH income
- $54,685
- Composite
- 36.16/100
- National rank
- #4736
- State rank
- #119 of 301 in IN
Livability — Columbus
- Score
- 79/100
- State rank
- #24
- US rank
- #1978
Category grades
Schools grade is shown separately in the Schools card above.
Census & demographics
- Census place
- Columbus, IN
- County
- Bartholomew County · 74,100 people
- City population
- 74,100
- Metro
- Columbus, IN
- Population (ZIP)
- 26,200
- Household income
- $72,112
- Rent vs Own
- Severe rent burden
- 504.0
Population outlook (Bartholomew County) Hauer SSP2
- Today (2025)
- 90,162 people
- By 2030
- 94,432 · +4.7%
- By 2040
- 102,659 · +13.9%
- By 2050
- 109,794 · +21.8%
- By 2075
- 123,419 · +36.9%
- By 2100
- 121,047 · +34.3%
Race, ethnicity, and origin ACS 2023
- Neighborhood character
- Predominantly White (79%)
- Race & ethnicity
- White 79% Hispanic / Latino 8% Asian 7% Two or more races 5% Black 2%
- Hispanic origin (detail)
- Mexican 6%
- Common ancestry
- Slovak 2% Iranian 2% Serbian 2%
- Foreign-born
- 8% · Canada, China, South Korea
- Languages at home
- 89% English-only · Spanish 4% Other Asian/Pacific 2% Other Indo-European 2%
Political lean MEDSL · Bartholomew
- 2024 margin
- Strong R (+27.3) · D 35.3% · R 62.7% · Other 2.0%
- 2008→2024 swing
- -16.1pp toward R · 2008: -11.3pp · 2024: -27.3pp
- All cycles
- 2024: R+27.3 2020: R+26.2 2016: R+33.3 2012: R+25.4 2008: R+11.3
Not yet ingested
- Civics
- —
Market trends
- HPI YoY
- ▼ -179.47%
- Current HPI
- 138.8115
- Rent YoY
- —
- Metro
- Columbus, IN
- State GDP YoY
- ▲ 2.90%
- F500 in state
- 18
Industry mix (Fortune 500 HQ in IN)
| Industry | F500 HQs | Revenue |
|---|---|---|
| Industrial Machinery | 2 | $37B |
|
||
| Healthcare | 1 | $177B |
|
||
| Pharmaceuticals | 1 | $45B |
|
||
| Metals / Steel | 1 | $18B |
|
||
| Agriculture | 1 | $17B |
|
||
| Packaging | 1 | $12B |
|
||
Price history
+122.3% since first listed4 events — show timeline
- 2026-04-22 Listed $299,900 MIBOR as Distributed by MLS Grid
- 2016-03-22 Sold (MLS) $130,400 MIBOR as Distributed by MLS Grid
- 2016-02-29 Listed $134,900 MIBOR as Distributed by MLS Grid
- 2016-02-29 Listed $134,900 MIBOR as Distributed by MLS Grid
Property tax history
+19.9%/yrLatest (2024): $4,967 · -6.1% YoY. Source: county tax records.
Cash-flow waterfall
monthlySold comps — $/sqft
last 12 mo · ≤1 miLoading sold comps…