93 Day Farm Dr · Lillington, NC
Flood risk No data
- FEMA flood zone
- —
- Chance of flooding over 30 yrs
- —
- Est. flood insurance / yr
- —
Fire risk No data
- Est. fire insurance / yr
- —
Heat risk No data
- Hot days now (above threshold)
- —
- Hot days in 30 yrs
- —
Wind risk No data
- Chance of severe wind over 30 yrs
- —
Air-quality risk No data
- Unhealthy air days now
- —
- Unhealthy air days in 30 yrs
- —
Risk factors via First Street. Map © Google.
Why this score? — see what drove the D- grade
The composite is a weighted blend of 9 inputs, each scored 0–100. Each bar is that input's sub-score; the figure is the points it added to the 100-point composite (weight × sub-score).
- Cash flow +13.2/30.0
- ARV discount +7.5/15.0
- DSCR +4.0/10.0
- Livability +3.6/5.0
- Schools +3.0/10.0
- 1% rule +2.7/10.0
- Rent growth +2.5/5.0
- Condition / age +2.5/5.0
- Appreciation +0.0/10.0
$289,990
🖨 Deal sheet (PDF) 📄 Offer letter ✓ Due diligence
Listing remarks
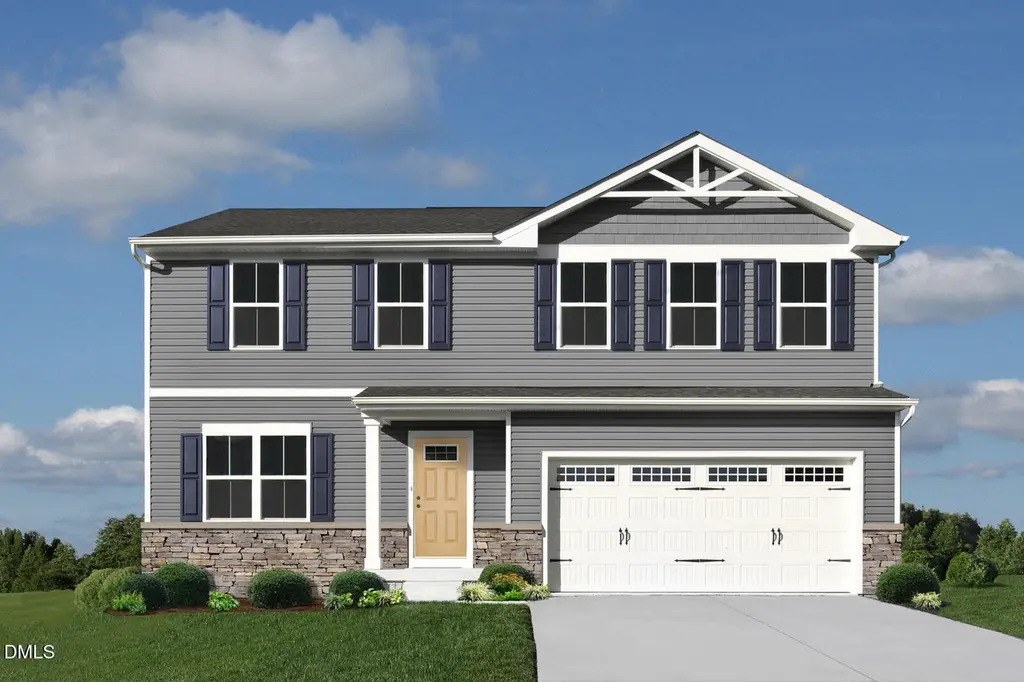
Time to Design: Welcome to Ryan Homes at Partridge Village in Lillington. This captivating Cedar home offers 1,918 sq ft of living space, featuring 4 bedrooms, 2.5 baths, and a 2-car garage. This stunning single-family home offers an open concept main floor that connects the great room, kitchen, and dining area. The kitchen features granite countertops, and an island. Tucked away, you'll find a powder room and a versatile flex space, perfect for an office or playroom. Luxury vinyl plank and carpet can be found throughout the home. Upstairs, there are four spacious bedrooms, three with walk-in closets, and a second-floor laundry room equipped with a washer and dryer. The owner's suite featu
Key facts
- Versatile flex space
- Granite countertops
- Double vanity bath
Tags
Property features AI
Finance
- HOA & community: Homeowner association (monthly fee $50) - maintains grounds
Exterior
- Parking: Attached garage (2 cars); Concrete driveway; Garage faces front
- Utilities: Public water; Public sewer
- Home design: Site-built home; Two levels
- Construction: Board & batten siding; Vinyl siding; Architectural shingle roof; Slab foundation; Built by Ryan Homes (Cedar model)
- Exterior features: Patio; Sidewalks
Interior
- Kitchen: Dishwasher; Electric range; Microwave; Refrigerator
- Bedrooms: 4 bedrooms
- Flooring: Carpet; Luxury vinyl
- Bathrooms: 2 full bathrooms; 1 half bathroom
- Heating & cooling: Natural gas heating; Central air conditioning
- Interior features: Granite counters; Kitchen island; Smart thermostat; Walk-in closet(s); Walk-in shower
- Laundry & utility: Washer; Dryer; Laundry room on upper level
Neighborhood map
What this means for you Summary
Snapshot
- This is a 4-bed/2.5-bath other listed at $290k.
Deal economics
- At list price, monthly cash flow is $-4 ($-44/yr) — negative.
- To cash-flow at today's rent, offer at most $289k (0.2% below list).
- To meet the 1% rule (rent ≥ 1% of price), the offer needs to be $223k (23.2% below list).
- Recommended offer: $223k (23.2% below list) — sets the bar for 1% rule.
- Cap rate 6.3% vs local median 4.0% in Lillington — top-decile yield for the area; either an underpriced asset or a hidden risk that comps aren't pricing in. Stress-test before assuming the spread holds.
Location & tenants
- Location reads 71/100 on livability (#101 in NC) — a middle-class / working-renter tenant base. Strengths: cost of living A+, housing A+, health & safety A+; Watch: employment C-, amenities F, commute F.
- Harnett County Schools (rural): math 31% / reading 39% proficiency, ranked #130 of 178 in NC (top 73%) — families likely to look elsewhere, expect single-tenant / working-renter base with shorter leases.
- Zoned schools: Harnett Central Middle (math 25% / reading 38%, grade F, #323 of 475 statewide, top 68%, 1,024 students, 63% FRL); Harnett Central High (math 43% / reading 51%, grade D-, #334 of 535 statewide, top 64%, 1,474 students, 56% FRL).
- Market conditions: 834 active listings in the ZIP; 9 comparable units currently listed for rent nearby; rentals at typical pace (median 25d on market — plan ~3-4 weeks tenant-placement turnaround); 2,080 units permitted in Harnett County in 2024 (12 in 5+ unit buildings).
- This rent runs 40% of the median local income ($67k/yr) — at the standard rent-burdened threshold; future hikes will face affordability resistance.
Forward outlook
- Local home prices are declining (-3.0%/yr); year-one equity from $2k of loan paydown is wiped out by about $9k of value loss. Plan a longer hold.
- Harnett County population projected at +42% by 2050 — long-run rental-demand tailwind backs the buy-and-hold thesis.
Negotiation context
- It's been on market 38 days — a 3% lower offer ($281k) is reasonable based on typical stale-listing flexibility.
- 3 sale attempts with the ask held roughly flat each time — persistent listings suggest the price (not the market) is what's stuck; bring a comps-based counter.
Questions for the listing agent
- What do current leases actually rent for vs. the listed asking? Can we see a recent rent roll and the last 12 months of T-12 income?
- It's been on market 38 days. Have you received any prior offers? Is the seller open to a 23% concession, seller financing, or rate buy-down credit?
- What does the HOA fee cover, when was the last increase, and are there any pending special assessments or reserve-fund shortfalls?
- Is there a deadline driving the sale (1031 exchange, divorce, estate, relocation)? That informs how much negotiation room exists.
- Schools are F-rated, which usually means shorter tenancies and higher turnover. Who's the typical renter profile here, and what's been the actual vacancy rate?
- The area grade is low — what's the realistic commute time and amenity access for the typical tenant pool here? Any planned neighborhood developments (good or bad) we should know about?
- What's the average days-on-market for RENTAL listings here right now (not sales)? A rising rental-DOM trend means longer vacancies and softer asking-rent achievability than the comps imply.
- What's the recent tenant-quality profile in this submarket — average credit score on applications, eviction rate, late-payment / NSF rate, and stable-employment percentage? A property-management company in the area should have these aggregated.
- How much new for-sale + rental construction is in the pipeline within 1–3 miles? Heavy new supply typically softens prices + rents 12–24 months out; constrained supply supports both.
Investment metrics
- 1% rule
- 0.77% ✗
- Cap rate
- 6.28%
- Cash-on-cash
- -0.05%
- DSCR
- 1.00
- GRM
- 10.9
CMA / ARV
No comps found within radius.
Projected returns pro-forma
-3.0% appreciation · 3.0% rent growth · sell at horizon
- IRR
- -16.5%
- Equity multiple
- 0.42×
- Total profit
- $-47,338
- Equity at exit
- $43,238
- IRR
- -8.3%
- Equity multiple
- 0.48×
- Total profit
- $-41,986
- Equity at exit
- $25,073
Cash invested: $81,197 (down + closing). Projections, not guarantees.
Landlord ↔ Tenant lean methodology
- Overall (STATE)
- 85 Strongly Landlord-Friendly
- State North Carolina
- 85 Strongly Landlord-Friendly · R+3
- County
- — inherits STATE
- City
- — inherits STATE
ZIP-level market 27546
- Home prices YoY
- -14.4%
- Active inventory
- 834
- Price-to-rent
- 10.9×
Monthly cashflow live
- Estimated rent
- $2,227 high interval (Pro) →
- Mortgage (P&I)
- −$1,521
- Tax from tax record
- −$71 /mo · $854/yr
- Insurance
- −$121
- HOA
- −$50
- Vacancy / Maint / Mgmt
- −$468
- Net cashflow
- $-4
Break-even live
Sensitivity live
| Price | -10% $161 | -5% $78 | +0% $-4 | +5% $-86 | +10% $-168 |
|---|---|---|---|---|---|
| Rent | -10% $-180 | -5% $-92 | +0% $-4 | +5% $84 | +10% $172 |
| Rate | -1.0pp $142 | -0.5pp $70 | base $-4 | +0.5pp $-79 | +1.0pp $-155 |
UW: 25.0% down · 7.5% · 30yr · 1.5% tax · 5.0% vac · 8.0% maint · 8.0% mgmt
Financing live
Cash to close
- Down payment
- $72,498
- Closing costs
- $8,700
- Reserves months
- —
- Total cash needed
- —
Loan-product check · same deal, 3 products live
Conventional
25% down · 7.5% · 30yr
- Down + closing
- —
- Monthly P&I
- —
- Monthly cashflow
- —
- DSCR
- —
- Eligible?
- —
Personal DTI + credit; lowest rate.
DSCR
20% down · 8.5% · 30yr
- Down + closing
- —
- Monthly P&I
- —
- Monthly cashflow
- —
- DSCR
- —
- Eligible?
- —
No personal income docs; deal must DSCR.
Hard money
10% down · 12.0% · 12mo
- Down + closing
- —
- Monthly P&I
- —
- Monthly cashflow
- —
- DSCR
- —
- Eligible?
- —
Short-term bridge; refi at stabilization.
Rent comps 9 comps
| Address | Beds | Baths | Sqft | Rent | $/sqft | DOM | Units | Dist |
|---|---|---|---|---|---|---|---|---|
| 231 Day Farm Dr Lillington, NC | 5.0 | 3.0 | 2541 | $2,500 | $0.98 | 24d | 1 | 0.16mi |
| 19 Virgo Dr Angier, NC | 3.0 | 2.5 | 1418 | $1,850 | $1.30 | 24d | 1 | 0.47mi |
| 265 Royal Meadow Dr Angier, NC | 4.0 | 2.5 | 1800 | $1,830 | $1.02 | 24d | 1 | 0.72mi |
| 50 Chedworth Dr Angier, NC | 3.0 | 2.0 | 1384 | $2,095 | $1.51 | 24d | 1 | 1.06mi |
| 59 Ivy Bank Dr Angier, NC | 3.0 | 2.0 | 1316 | $1,729 | $1.31 | 24d | 1 | 1.12mi |
| 59 Ivy Bank Dr Angier, NC | 3.0 | 2.0 | 1316 | $1,729 | $1.31 | 22d | 1 | 1.12mi |
| 18 March Creek Dr Fuquay Varina, NC | 3.0 | 2.5 | 1418 | $1,800 | $1.27 | 24d | 1 | 1.28mi |
| 198 Moore Creek Dr Fuquay Varina, NC | 4.0 | 2.0 | 1764 | $2,195 | $1.24 | 15d | 1 | 1.35mi |
| 135 Moore Creek Dr Fuquay Varina, NC | 3.0 | 3.0 | 2286 | $2,200 | $0.96 | 24d | 1 | 1.41mi |
HOA detail
- Monthly dues
- $50 · $600/yr
Listing history 28 events
-
2026-06-21days on market $289,990 Active 38 DOM
-
2026-06-18days on market $289,990 Active 35 DOM
-
2026-06-17days on market $289,990 Active 34 DOM
-
2026-06-16days on market $289,990 Active 33 DOM
-
2026-06-15days on market $289,990 Active 32 DOM
-
2026-06-14days on market $289,990 Active 30 DOM
-
2026-06-10days on market $289,990 Active 27 DOM
-
2026-06-09days on market $289,990 Active 26 DOM
-
2026-06-08days on market $289,990 Active 25 DOM
-
2026-06-07days on market $289,990 Active 24 DOM
-
2026-06-05days on market $289,990 Active 21 DOM
-
2026-06-03days on market $289,990 Active 20 DOM
-
2026-06-02days on market $289,990 Active 19 DOM
-
2026-06-01days on market $289,990 Active 18 DOM
-
2026-05-31days on market $289,990 Active 17 DOM
-
2026-05-30days on market $289,990 Active 16 DOM
-
2026-05-14historical
-
2026-05-14$289,990 Active
-
2026-05-13price $289,990
-
2026-05-13price $289,990
-
2026-04-29price $294,990
-
2026-04-29price $294,990
-
2026-02-18$299,990 Active
-
2026-01-08price $299,990
-
2025-12-18price $289,990
-
2025-12-06price $299,990
-
2025-11-20price $289,990
-
2025-10-31$299,990 Active
ⓘ Source: listings_history table (triggers on properties + properties_extension) + one-shot
backfill from property_details.listing_events for pre-trigger history.
Tax reassessment forecast NC · Resets to sale price
- Current annual tax
- $854 · $71/mo
- Projected year-2 tax
- $2,378 · $198/mo
- Expected delta
- +$1,524/yr (+$127/mo · 178.5%)
ⓘ Screening estimate from a state-policy table — verify with the county assessor before closing.
Nearby sold comps map
Loading sold comps map…
Walkable amenities ~0.75 mi
Loading nearby amenities…
Taxation est. · year 1
- Rental income
- $26,720
- − Mortgage interest
- −$16,244
- − Property taxes
- −$854
- − Insurance
- −$1,450
- − Repairs & maintenance
- −$2,138
- − Management
- −$2,138
- − HOA
- −$600
- − Depreciation
- −$8,436
- Taxable loss
- −$5,139
- Est. tax savings @ 24.0%
- +$1,233
- After-tax cash flow
- $1,190/yr
For passive investors: Depreciation is non-cash, so a rental often shows a tax loss while cash-flowing — sheltering income. Rental losses are passive: they offset passive income freely, and up to $25,000/yr can offset ordinary (W-2) income if you actively participate and your MAGI is under $100k (phasing out to $0 by $150k); unused losses carry forward. On sale, claimed depreciation is recaptured at up to 25%, and gains may owe capital-gains tax (a 1031 exchange can defer both). Figures are a year-1 estimate at your 24.0% rate — not tax advice; consult a CPA.
Schools (NCES district)
- District
- Harnett County Schools
- NCES district ID
- 3702010
- Math proficiency
- 31% ▼ -2.00%
- Reading proficiency
- 39% ▼ -1.00%
- Median HH income
- $45,400
- Composite
- 29.88/100
- National rank
- #6397
- State rank
- #130 of 178 in NC
Livability — Lillington
- Score
- 71/100
- State rank
- #101
- US rank
- #6653
Category grades
Schools grade is shown separately in the Schools card above.
Census & demographics
- Census place
- Lillington, NC
- County
- Harnett County · 125,715 people
- City population
- 21,419
- Metro
- Fayetteville, NC
- Population (ZIP)
- 21,419
- Household income
- $66,746
- Rent vs Own
- Severe rent burden
- 642.0
Population outlook (Harnett County) Hauer SSP2
- Today (2025)
- 153,758 people
- By 2030
- 166,581 · +8.3%
- By 2040
- 192,741 · +25.4%
- By 2050
- 218,332 · +42.0%
- By 2075
- 275,422 · +79.1%
- By 2100
- 313,511 · +103.9%
Race, ethnicity, and origin ACS 2023
- Neighborhood character
- Diverse neighborhood (Simpson 0.55)
- Race & ethnicity
- White 64% Black 16% Hispanic / Latino 14% Two or more races 9% Asian 1%
- Hispanic origin (detail)
- Mexican 8% Puerto Rican 3%
- Common ancestry
- Slovak 3% Serbian 2% Italian 2%
- Foreign-born
- 5% · Canada, Jamaica, China
- Languages at home
- 90% English-only · Spanish 9%
Political lean MEDSL · Harnett
- 2024 margin
- Strong R (+25.1) · D 36.9% · R 62.0% · Other 1.1%
- 2008→2024 swing
- -8.4pp toward R · 2008: -16.7pp · 2024: -25.1pp
- All cycles
- 2024: R+25.1 2020: R+22.4 2016: R+24.1 2012: R+19.4 2008: R+16.7
Not yet ingested
- Civics
- —
Market trends
- HPI YoY
- ▼ -33.35%
- Current HPI
- 198.2885
- Rent YoY
- —
- Metro
- Fayetteville, NC
- State GDP YoY
- ▲ 3.28%
- F500 in state
- 26
Industry mix (Fortune 500 HQ in NC)
| Industry | F500 HQs | Revenue |
|---|---|---|
| Financial Services | 2 | $213B |
|
||
| Retail | 2 | $95B |
|
||
| Industrial Conglomerate | 1 | $38B |
|
||
| Metals / Steel | 1 | $35B |
|
||
| Utilities | 1 | $30B |
|
||
| Industrial Machinery | 1 | $19B |
|
||
Price history
-3.3% since first listed12 events — show timeline
- 2026-05-14 Listed $289,990 TMLS
- 2026-05-14 Listing Removed — TMLS
- 2026-05-13 Price Changed $289,990 Hive MLS
- 2026-05-13 Price Changed $289,990 TMLS
- 2026-04-29 Price Changed $294,990 Hive MLS
- 2026-04-29 Price Changed $294,990 TMLS
- 2026-02-18 Listed $299,990 Hive MLS
- 2026-01-08 Price Changed $299,990 TMLS
- 2025-12-18 Price Changed $289,990 TMLS
- 2025-12-06 Price Changed $299,990 TMLS
- 2025-11-20 Price Changed $289,990 TMLS
- 2025-10-31 Listed $299,990 TMLS
Property tax history
+1226.0%/yrLatest (2025): $854 · +1226.0% YoY. Source: county tax records.
Cash-flow waterfall
monthlySold comps — $/sqft
last 12 mo · ≤1 miLoading sold comps…