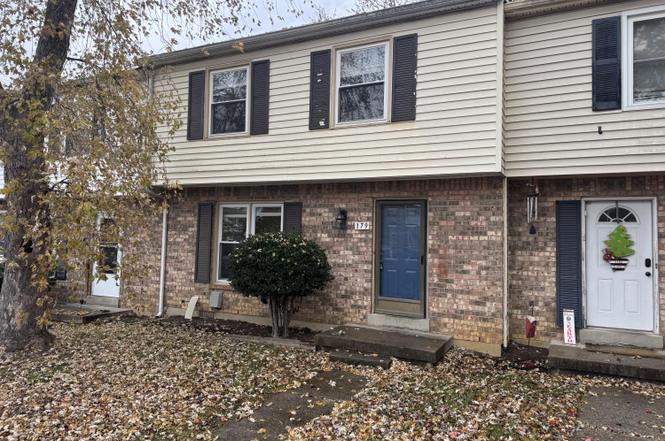
179 Hedgewood Ct · Lexington-Fayette, KY
Flood risk 1/10 · Minimal
- FEMA flood zone
- X (unshaded)
- Chance of flooding over 30 yrs
- 0.0%
- Est. flood insurance / yr
- $507 – $1,088
Fire risk 1/10 · Minimal
- Est. fire insurance / yr
- $839 – $1,559
Heat risk 4/10 · Minor
- Hot days now (above 101°F)
- 7 days/yr
- Hot days in 30 yrs
- 19 days/yr
Wind risk 2/10 · Minimal
- Chance of severe wind over 30 yrs
- 2.0%
Air-quality risk 1/10 · Minimal
- Unhealthy air days now
- 0 days/yr
- Unhealthy air days in 30 yrs
- 0 days/yr
Risk factors via First Street. Map © Google.
Why this score? — see what drove the B- grade
The composite is a weighted blend of 9 inputs, each scored 0–100. Each bar is that input's sub-score; the figure is the points it added to the 100-point composite (weight × sub-score).
- Cash flow +26.5/30.0
- ARV discount +15.0/15.0
- DSCR +9.0/10.0
- 1% rule +6.6/10.0
- Schools +3.4/10.0
- Rent growth +3.1/5.0
- Livability +2.5/5.0
- Condition / age +2.5/5.0
- Appreciation +0.0/10.0
$149,500
🖨 Deal sheet (PDF) 📄 Offer letter ✓ Due diligence
Listing remarks
With fresh paint and new flooring throughout, this updated unit in the Woodhill area offers a great floorplan with a large bedroom at the front of the upstairs and two good size bedrooms at the rear. Newly installed luxury vinyl plank flooring throughout the townhome makes for easy upkeep. There is a small fenced backyard that opens to community green space with a playground and basketball court. Could be a perfect fit for a first time homebuyer or for an investor looking to add a quality rental unit. Call today for your private tour of this property!
Key facts
- New flooring
- Basketball court
- Fenced backyard
Tags
Property features AI
Finance
- Other: Property in Woodhill subdivision, Fayette County
- HOA & community: Homeowners association with monthly fee
Exterior
- Utilities: Public sewer
- Home design: Two levels
- Construction: Brick veneer and vinyl siding exterior; Block foundation; Built area about 1,040 (building area total provided)
- Exterior features: Neighborhood view; Public water
Interior
- Kitchen: Refrigerator; Range
- Bathrooms: 1 full bathroom; 1 half bathroom
- Heating & cooling: Electric heating; Heat pump heating; Electric cooling; Heat pump cooling
- Interior features: Refrigerator; Range; Crawl space basement; No fireplace; 11 total rooms
Neighborhood map
What this means for you Summary
Snapshot
- This is a 3-bed/1.5-bath townhouse listed at $150k.
Deal economics
- At list price, monthly cash flow is $394 ($5k/yr) — positive.
- The deal already cash-flows at list — no discount required.
- Meets the 1% rule at list price ($2k rent vs $150k).
- Recommended offer: $132k (12.0% below list) — sets the bar for market timing.
- Cap rate 9.5% vs local median 3.8% in Lexington-Fayette — top-decile yield for the area; either an underpriced asset or a hidden risk that comps aren't pricing in. Stress-test before assuming the spread holds.
Location & tenants
- Location reads: area grade B — affects rentability + tenant quality, not the cash-flow math above.
- Fayette County (urban): math 35% / reading 45% proficiency, ranked #27 of 165 in KY (top 16%) — families likely to look elsewhere, expect single-tenant / working-renter base with shorter leases.
- Zoned schools: Madeline M Breckinridge Elem School (math 27% / reading 37%, grade F, #348 of 676 statewide, top 55%, 509 students, 78% FRL); Crawford Middle School (math 15% / reading 31%, grade F, #197 of 217 statewide, top 92%, 751 students, 68% FRL); Henry Clay High School (math 43% / reading 49%, grade D-, #20 of 254 statewide, top 8%, 2,031 students, 47% FRL) — zoned schools average 64% FRL vs 44% district-wide (20 pts higher); higher-poverty schools than district average — tighter screening recommended.
- Market conditions: Rents rising (+2.2%/yr); 280 active listings in the ZIP; 40 comparable units currently listed for rent nearby; rentals at typical pace (median 25d on market — plan ~3-4 weeks tenant-placement turnaround); solid renter incomes; 1,036 units permitted in Fayette County in 2024 (542 in 5+ unit buildings).
Forward outlook
- Local home prices are declining (-3.0%/yr); year-one equity from $1k of loan paydown is wiped out by about $4k of value loss. Plan a longer hold.
- Fayette County population projected at +35% by 2050 — long-run rental-demand tailwind backs the buy-and-hold thesis.
Negotiation context
- It's been on market 199 days — a 12% lower offer ($132k) is reasonable based on typical stale-listing flexibility.
- 2 sale attempts with the ask held roughly flat each time — persistent listings suggest the price (not the market) is what's stuck; bring a comps-based counter.
Questions for the listing agent
- It's been on market 199 days. Have you received any prior offers? Is the seller open to a 12% concession, seller financing, or rate buy-down credit?
- Built in 1974 — when were the roof, HVAC, electrical panel, plumbing, and water heater last replaced?
- What does the HOA fee cover, when was the last increase, and are there any pending special assessments or reserve-fund shortfalls?
- Why hasn't it sold? Are there any deal-killer items the seller is aware of (foundation, flood, title, zoning, code violations)?
- Is there a deadline driving the sale (1031 exchange, divorce, estate, relocation)? That informs how much negotiation room exists.
- What's the average days-on-market for RENTAL listings here right now (not sales)? A rising rental-DOM trend means longer vacancies and softer asking-rent achievability than the comps imply.
- What's the recent tenant-quality profile in this submarket — average credit score on applications, eviction rate, late-payment / NSF rate, and stable-employment percentage? A property-management company in the area should have these aggregated.
- How much new for-sale + rental construction is in the pipeline within 1–3 miles? Heavy new supply typically softens prices + rents 12–24 months out; constrained supply supports both.
Investment metrics
- 1% rule
- 1.16% ✓
- Cap rate
- 9.45%
- Cash-on-cash
- 11.28%
- DSCR
- 1.50
- GRM
- 7.2
CMA / ARV
- ARV (on-the-fly)
- $197,600
- Comps found
- 12
Show comp detail 12 sales within ~0.75 mi
| Address | Dist | Beds/Ba | Sqft | Sold | Price | $/sf | Match |
|---|---|---|---|---|---|---|---|
| 277 Osage Ct | 0.13mi | 3/1.5 | 1,080 (+4%) | 2mo | $115,000 | $106 | 86 |
| 292 Osage Ct | 0.10mi | 3/1.5 | 1,080 (+4%) | 5mo | $149,900 | $139 | 85 |
| 209 Old Todds Rd #2109 | 0.35mi | 2/1.5 (-1) | 1,008 (-3%) | 4mo | $197,500 | $196 | 70 |
| 2804 Hanna Pl | 0.29mi | 2/2.5 (-1) | 1,088 (+5%) | 2mo | $150,000 | $138 | 68 |
| 209 Old Todds Rd #11101 | 0.35mi | 2/1.5 (-1) | 1,064 (+2%) | 16mo | $210,000 | $197 | 62 |
| 3042 Bonanza Dr | 0.50mi | 2/2.0 (-1) | 1,100 (+6%) | 1mo | $190,000 | $173 | 59 |
| 2925 Rio Dosa Dr | 0.54mi | 2/2.0 (-1) | 1,071 (+3%) | 7mo | $203,000 | $190 | 57 |
| 943 Mcclanahan Ln Ln | 0.20mi | 2/2.0 (-1) | 1,156 (+11%) | 11mo | $225,000 | $195 | 56 |
| 2931 Rio Dosa Dr | 0.55mi | 2/2.0 (-1) | 1,125 (+8%) | 3mo | $228,500 | $203 | 52 |
| 2927 Rio Dosa Dr | 0.54mi | 2/2.0 (-1) | 1,071 (+3%) | 14mo | $188,400 | $176 | 51 |
| 309 Santa Fe Ct | 0.58mi | 2/2.0 (-1) | 1,082 (+4%) | 11mo | $175,000 | $162 | 50 |
| 307 Santa Fe Ct | 0.58mi | 2/2.0 (-1) | 1,140 (+10%) | 5mo | $225,000 | $197 | 46 |
Match score weights: distance 35% · size 25% · config 20% · recency 20%. Top-matched comps best support the ARV.
Projected returns pro-forma
-3.0% appreciation · 2.22% rent growth · sell at horizon
- IRR
- -0.3%
- Equity multiple
- 0.99×
- Total profit
- $-515
- Equity at exit
- $22,291
- IRR
- 8.5%
- Equity multiple
- 1.63×
- Total profit
- $26,340
- Equity at exit
- $12,926
Cash invested: $41,860 (down + closing). Projections, not guarantees.
Landlord ↔ Tenant lean methodology
- Overall (STATE)
- 83 Strongly Landlord-Friendly
- State Kentucky
- 83 Strongly Landlord-Friendly · R+16
- County
- — inherits STATE
- City
- — inherits STATE
ZIP-level market 40509
- Home prices YoY
- -20.6%
- Rents YoY
- 2.2%
- Active inventory
- 280
- Price-to-rent
- 7.2×
Monthly cashflow live
- Estimated rent
- $1,738 high interval (Pro) →
- Mortgage (P&I)
- −$784
- Tax from tax record
- −$41 /mo · $495/yr
- Insurance
- −$62
- HOA
- −$92
- Vacancy / Maint / Mgmt
- −$365
- Net cashflow
- $394
Break-even live
Sensitivity live
| Price | -10% $478 | -5% $436 | +0% $394 | +5% $351 | +10% $309 |
|---|---|---|---|---|---|
| Rent | -10% $256 | -5% $325 | +0% $394 | +5% $462 | +10% $531 |
| Rate | -1.0pp $469 | -0.5pp $432 | base $394 | +0.5pp $355 | +1.0pp $315 |
UW: 25.0% down · 7.5% · 30yr · 1.5% tax · 5.0% vac · 8.0% maint · 8.0% mgmt
Financing live
Cash to close
- Down payment
- $37,375
- Closing costs
- $4,485
- Reserves months
- —
- Total cash needed
- —
Loan-product check · same deal, 3 products live
Conventional
25% down · 7.5% · 30yr
- Down + closing
- —
- Monthly P&I
- —
- Monthly cashflow
- —
- DSCR
- —
- Eligible?
- —
Personal DTI + credit; lowest rate.
DSCR
20% down · 8.5% · 30yr
- Down + closing
- —
- Monthly P&I
- —
- Monthly cashflow
- —
- DSCR
- —
- Eligible?
- —
No personal income docs; deal must DSCR.
Hard money
10% down · 12.0% · 12mo
- Down + closing
- —
- Monthly P&I
- —
- Monthly cashflow
- —
- DSCR
- —
- Eligible?
- —
Short-term bridge; refi at stabilization.
Rent comps 40 comps
| Address | Beds | Baths | Sqft | Rent | $/sqft | DOM | Units | Dist |
|---|---|---|---|---|---|---|---|---|
| 179 Hedgewood Ct Unit 1 Lexington, KY | 3.0 | 1.5 | 1080 | $1,375 | $1.27 | 25d | 1 | 0.02mi |
| 262 Osage Ct Unit 1 Lexington, KY | 3.0 | 1.5 | 1080 | $1,475 | $1.37 | 25d | 1 | 0.08mi |
| 308 Larkwood Dr Unit Z1 Lexington, KY | 4.0 | 2.0 | 1361 | $1,849 | $1.36 | 15d | 1 | 0.11mi |
| 200 Alsab Ct Lexington, KY | 2.0–3.0 | 1.5 | 940 | $1,445 | $1.54 | 25d | 10 | 0.18mi |
| 2400 Woodhill Dr Lexington, KY | 3.0 | 1.0 | 1000 | $1,250 | $1.25 | 25d | 1 | 0.28mi |
| 175 N Mount Tabor Rd Lexington, KY | 1.0–2.0 | 1.0–2.0 | 847 | $1,362 | $1.61 | 15d | 9 | 0.36mi |
| 2409 Timberhill Ct Unit 4 Lexington, KY | 2.0 | 1.5 | 990 | $1,150 | $1.16 | 25d | 1 | 0.37mi |
| 300 Quinton Ct Lexington, KY | 1.0–3.0 | 1.0–2.0 | 927 | $1,557 | $1.68 | 15d | 38 | 0.38mi |
| 2716 Chelsea Woods Ct Lexington, KY | 2.0 | 1.0 | 861 | $1,400 | $1.63 | 15d | 1 | 0.48mi |
| 2720 Chelsea Woods Ct Lexington, KY | 3.0 | 2.0 | 1018 | $1,595 | $1.57 | 25d | 1 | 0.49mi |
| 649 Hugging Bear Dr Lexington, KY | 3.0 | 2.0 | 1253 | $1,750 | $1.40 | 22d | 1 | 0.62mi |
| 2334 Lake Park Rd Lexington, KY | 1.0–2.0 | 1.0–2.0 | 837 | $1,448 | $1.73 | 15d | 7 | 0.68mi |
| 2116 Saint Teresa Dr Lexington, KY | 3.0 | 1.0 | 999 | $1,900 | $1.90 | 25d | 1 | 0.76mi |
| 2414 Lake Park Rd Lexington, KY | 1.0–3.0 | 1.0–2.0 | 1123 | $2,200 | $1.96 | 22d | 3 | 0.77mi |
| 2414 Lake Park Rd Lexington, KY | 2.0–3.0 | 2.0 | 1352 | $2,200 | $1.63 | 15d | 2 | 0.77mi |
| 151 S Locust Hill Dr Lexington, KY | 1.0–2.0 | 1.0–2.0 | 761 | $1,348 | $1.77 | 15d | 19 | 0.79mi |
| 175 N Locust Hill Dr Lexington, KY | 1.0–2.0 | 1.0–2.0 | 700 | $1,170 | $1.67 | 15d | 11 | 0.82mi |
| 2360 Liberty Rd Lexington, KY | 3.0 | 2.0 | 1415 | $1,895 | $1.34 | 15d | 1 | 0.82mi |
| 251 Chippendale Cir Lexington, KY | 1.0–2.0 | 1.0–2.0 | 842 | $1,450 | $1.72 | 15d | 12 | 0.85mi |
| 2052 Saint Christopher Dr Lexington, KY | 4.0 | 2.0 | 1008 | $2,050 | $2.03 | 15d | 1 | 0.90mi |
| 2041 Saint Michael Dr Unit 5 Lexington, KY | 2.0 | 1.0 | 900 | $1,250 | $1.39 | 25d | 1 | 0.94mi |
| 2240 Kenwood Dr Lexington, KY | 3.0 | 2.0 | 1264 | $1,795 | $1.42 | 15d | 1 | 0.97mi |
| 2021 Saint Christopher Dr Lexington, KY | 3.0 | 1.0 | 1025 | $2,100 | $2.05 | 15d | 1 | 0.98mi |
| 100 Lakeshore Dr Lexington, KY | 1.0–3.0 | 1.0–2.0 | 925 | $1,560 | $1.69 | 15d | 14 | 1.07mi |
| 409 Darby Creek Rd Unit Z1 Lexington, KY | 2.0 | 1.5 | 1144 | $1,299 | $1.14 | 25d | 1 | 1.08mi |
| 365 Darby Creek Rd Lexington, KY | 2.0 | 1.5 | 1200 | $1,299 | $1.08 | 25d | 1 | 1.08mi |
| 2561 Mackenzie Ln Lexington, KY | 2.0 | 2.5 | 1250 | $1,395 | $1.12 | 15d | 1 | 1.09mi |
| 2082 Fairmont Ct Lexington, KY | 2.0 | 1.5 | 900 | $925 | $1.03 | 25d | 1 | 1.10mi |
| 531 Laketower Dr Unit 506 Lexington, KY | 2.0 | 2.0 | 1326 | $4,699 | $3.54 | 25d | 1 | 1.12mi |
| 531 Laketower Dr Unit 522 Lexington, KY | 2.0 | 2.0 | 1367 | $5,699 | $4.17 | 25d | 1 | 1.12mi |
| 531 Laketower Dr Unit 502 Lexington, KY | 2.0 | 2.0 | 1457 | $5,499 | $3.77 | 25d | 1 | 1.12mi |
| 531 Laketower Dr Unit 519 Lexington, KY | 2.0 | 2.0 | 1441 | $4,599 | $3.19 | 25d | 1 | 1.12mi |
| 531 Laketower Dr Unit 418 Lexington, KY | 2.0 | 2.0 | 1175 | $3,799 | $3.23 | 25d | 1 | 1.12mi |
| 531 Laketower Dr Unit 308 Lexington, KY | 2.0 | 2.0 | 1326 | $3,699 | $2.79 | 25d | 1 | 1.12mi |
| 531 Laketower Dr Unit 316 Lexington, KY | 2.0 | 2.0 | 1175 | $3,199 | $2.72 | 25d | 1 | 1.12mi |
| 531 Laketower Dr Unit 414 Lexington, KY | 2.0 | 2.0 | 1147 | $3,499 | $3.05 | 25d | 1 | 1.12mi |
| 531 Laketower Dr Unit 518 Lexington, KY | 2.0 | 2.0 | 1175 | $4,299 | $3.66 | 25d | 1 | 1.12mi |
| 531 Laketower Dr Unit 314 Lexington, KY | 2.0 | 2.0 | 1147 | $2,999 | $2.61 | 15d | 1 | 1.12mi |
| 2548 Danielle Ln Lexington, KY | 2.0 | 2.0 | 1050 | $1,200 | $1.14 | 15d | 1 | 1.14mi |
| 2543 Danielle Ln Lexington, KY | 3.0 | 2.0 | 1400 | $1,600 | $1.14 | 25d | 1 | 1.15mi |
HOA detail
- Monthly dues
- $92 · $1,104/yr
Listing history 23 events
-
2026-06-22days on market $149,500 Active 199 DOM
-
2026-06-18days on market $149,500 Active 196 DOM
-
2026-06-17days on market $149,500 Active 195 DOM
-
2026-06-16days on market $149,500 Active 194 DOM
-
2026-06-15days on market $149,500 Active 193 DOM
-
2026-06-14days on market $149,500 Active 191 DOM
-
2026-06-13days on market $149,500 Active 190 DOM
-
2026-06-10days on market $149,500 Active 188 DOM
-
2026-06-09days on market $149,500 Active 187 DOM
-
2026-06-08days on market $149,500 Active 186 DOM
-
2026-06-07days on market $149,500 Active 185 DOM
-
2026-06-05days on market $149,500 Active 182 DOM
-
2026-06-03days on market $149,500 Active 181 DOM
-
2026-06-02days on market $149,500 Active 180 DOM
-
2026-06-01days on market $149,500 Active 179 DOM
-
2026-05-31days on market $149,500 Active 178 DOM
-
2026-05-08status Active
-
2026-04-21status Pending
-
2025-07-01$149,500 Active
-
2023-10-19soldstatus $882,680
-
2019-10-25soldstatus $2,008,336
-
2018-07-03soldstatus $3,703,040
-
2017-01-20soldstatus $270,000
ⓘ Source: listings_history table (triggers on properties + properties_extension) + one-shot
backfill from property_details.listing_events for pre-trigger history.
Tax reassessment forecast KY · Resets to sale price
- Current annual tax
- $495 · $41/mo
- Projected year-2 tax
- $1,286 · $107/mo
- Expected delta
- +$791/yr (+$66/mo · 159.7%)
ⓘ Screening estimate from a state-policy table — verify with the county assessor before closing.
Climate risk First Street
- Flood 1/10 Low FEMA zone X (unshaded) · 0% chance over 30 yrs
- Wildfire 1/10 Low
- Heat 4/10 Moderate 7 d/yr ≥101°F today · 19 d/yr by 30 yrs out
- Wind 2/10 Low 2% chance of damaging wind over 30 yrs
- Air quality 1/10 Low 0 unhealthy d/yr today · 0 by 30 yrs out
Nearby sold comps map
Loading sold comps map…
Walkable amenities ~0.75 mi
Loading nearby amenities…
Taxation est. · year 1
- Rental income
- $20,859
- − Mortgage interest
- −$8,374
- − Property taxes
- −$495
- − Insurance
- −$748
- − Repairs & maintenance
- −$1,669
- − Management
- −$1,669
- − HOA
- −$1,104
- − Depreciation
- −$4,349
- Taxable income
- $2,451
- Est. tax owed @ 24.0%
- −$588
- After-tax cash flow
- $4,135/yr
For passive investors: Depreciation is non-cash, so a rental often shows a tax loss while cash-flowing — sheltering income. Rental losses are passive: they offset passive income freely, and up to $25,000/yr can offset ordinary (W-2) income if you actively participate and your MAGI is under $100k (phasing out to $0 by $150k); unused losses carry forward. On sale, claimed depreciation is recaptured at up to 25%, and gains may owe capital-gains tax (a 1031 exchange can defer both). Figures are a year-1 estimate at your 24.0% rate — not tax advice; consult a CPA.
Schools (NCES district)
- District
- Fayette County
- NCES district ID
- 2101860
- Math proficiency
- 35% ▼ -16.00%
- Reading proficiency
- 45% ▼ -13.00%
- Median HH income
- $49,245
- Composite
- 34.38/100
- National rank
- #5211
- State rank
- #27 of 165 in KY
Livability — Lexington-Fayette
No livability data for this city. (Only ~50 U.S. cities are tracked.)
Census & demographics
- Census place
- Lexington-Fayette, KY
- County
- Fayette County · 317,143 people
- City population
- 321,882
- Metro
- Lexington-Fayette, KY
- Population (ZIP)
- 47,036
- Household income
- $94,804
- Rent vs Own
- Severe rent burden
- 1763.0
Population outlook (Fayette County) Hauer SSP2
- Today (2025)
- 363,454 people
- By 2030
- 388,270 · +6.8%
- By 2040
- 438,688 · +20.7%
- By 2050
- 490,667 · +35.0%
- By 2075
- 625,394 · +72.1%
- By 2100
- 721,354 · +98.5%
Race, ethnicity, and origin ACS 2023
- Neighborhood character
- Predominantly White (67%)
- Race & ethnicity
- White 67% Black 14% Two or more races 8% Asian 7% Hispanic / Latino 7%
- Hispanic origin (detail)
- Mexican 4%
- Common ancestry
- Italian 2% Slovak 2% Romanian 2%
- Foreign-born
- 12% · Canada, China
- Languages at home
- 84% English-only · Spanish 6% Other Indo-European 3% Other Asian/Pacific 2%
Political lean MEDSL · Fayette
- 2024 margin
- D (+18.1) · D 58.0% · R 39.9% · Other 2.1%
- 2008→2024 swing
- +13.3pp toward D · 2008: 4.8pp · 2024: 18.1pp
- All cycles
- 2024: D+18.1 2020: D+20.8 2016: D+9.5 2012: D+1.0 2008: D+4.8
Not yet ingested
- Civics
- —
Market trends
- HPI YoY
- ▼ -58.72%
- Current HPI
- 226.8663
- Rent YoY
- ▲ 2.22%
- Metro
- Lexington-Fayette, KY
- State GDP YoY
- ▲ 1.81%
- F500 in state
- 4
Industry mix (Fortune 500 HQ in KY)
| Industry | F500 HQs | Revenue |
|---|---|---|
| Healthcare | 1 | $118B |
|
||
| Food / Beverage | 1 | $7B |
|
||
Price history
-44.6% since first listed7 events — show timeline
- 2026-05-08 Relisted — ImagineMLS
- 2026-04-21 Pending — ImagineMLS
- 2025-07-01 Listed $149,500 ImagineMLS
- 2023-10-19 Sold (Public Records) $882,680 Public Records
- 2019-10-25 Sold (Public Records) $2,008,336 Public Records
- 2018-07-03 Sold (Public Records) $3,703,040 Public Records
- 2017-01-20 Sold (Public Records) $270,000 Public Records
Property tax history
+1.9%/yrLatest (2015): $495 · +1.9% YoY. Source: county tax records.
Cash-flow waterfall
monthlySold comps — $/sqft
last 12 mo · ≤1 miLoading sold comps…