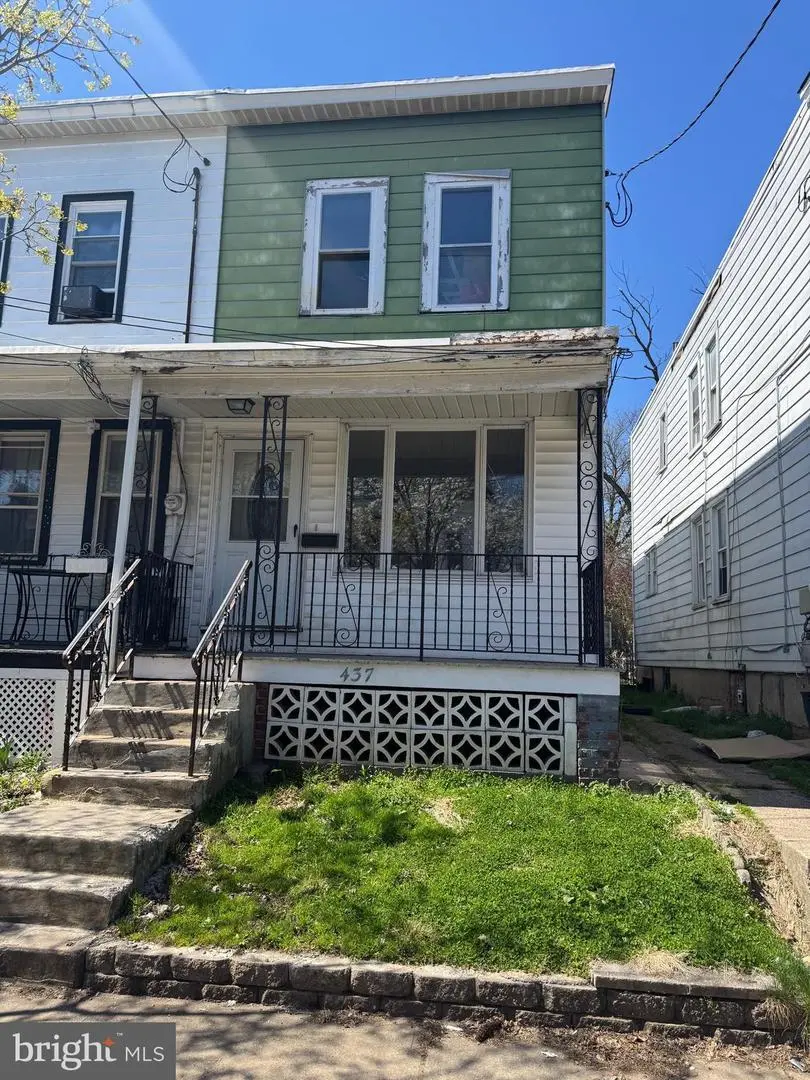
437 Home Ave · Trenton, NJ
Flood risk 1/10 · Minimal
- FEMA flood zone
- X (unshaded)
- Chance of flooding over 30 yrs
- 0.0%
- Est. flood insurance / yr
- $507 – $1,088
Fire risk 1/10 · Minimal
- Est. fire insurance / yr
- $526 – $976
Heat risk 6/10 · Moderate
- Hot days now (above 102°F)
- 7 days/yr
- Hot days in 30 yrs
- 15 days/yr
Wind risk 6/10 · Moderate
- Chance of severe wind over 30 yrs
- 27.0%
Air-quality risk 5/10 · Moderate
- Unhealthy air days now
- 6 days/yr
- Unhealthy air days in 30 yrs
- 8 days/yr
Risk factors via First Street. Map © Google.
Why this score? — see what drove the C grade
The composite is a weighted blend of 9 inputs, each scored 0–100. Each bar is that input's sub-score; the figure is the points it added to the 100-point composite (weight × sub-score).
- Cash flow +25.0/30.0
- ARV discount +9.4/15.0
- DSCR +8.2/10.0
- 1% rule +6.4/10.0
- Livability +3.8/5.0
- Rent growth +3.7/5.0
- Condition / age +2.5/5.0
- Schools +0.7/10.0
- Appreciation +0.0/10.0
$189,900
🖨 Deal sheet 📄 Offer letter ✓ Due diligence
Listing remarks MLS
Welcome home! This lovely three bedroom end of row in nice area is waiting for you. Huge living room with new carpet, crown moldings, woodwork and staircase. Wonderful picture window looks out over rocking chair front porch. Large modern kitchen leads to sunporch. Three good sized bedrooms with lots of closets. There's also a newly finished basement and the whole home has been freshly painted inside.
Key facts
- Covered front porch
- Hardwood flooring
- Huge living room
Tags
Property features AI
Finance
- Other: Not in a federal flood zone; Pets allowed with no restrictions
- Financial info: Fee simple ownership
- HOA & community: No HOA information provided
Exterior
- Parking: Parking details not provided
- Security: No security features listed
- Utilities: Public water; Public sewer; Electric available; Natural gas available; Cable TV available; Phone available
- Home design: Semi-detached home; Shingle roof; Built date per assessor (year not specified); Average condition
- Construction: Aluminum siding; Other foundation type
- Exterior features: Lot approximately 14.10 x 100.00; No tidal water
Interior
- Kitchen: Kitchen (appliances not listed)
- Bedrooms: Three bedrooms on the first upper level
- Flooring: Wood flooring; Ceramic tile flooring; Laminate flooring
- Bathrooms: One full bathroom
- Heating & cooling: Forced air heating (natural gas); Window air conditioning units; Natural gas hot water
- Interior features: Partially finished basement; Bay/Bow windows
- Laundry & utility: Laundry in the basement
Neighborhood map
What this means for you Summary
Snapshot
- This is a 3-bed/1.0-bath townhouse listed at $190k.
Deal economics
- At list price, monthly cash flow is $415 ($5k/yr) — positive.
- The deal already cash-flows at list — no discount required.
- Meets the 1% rule at list price ($2k rent vs $190k).
- Cap rate 8.9% vs local median 6.3% in Trenton — top-decile yield for the area; either an underpriced asset or a hidden risk that comps aren't pricing in. Stress-test before assuming the spread holds.
Location & tenants
- Location reads 76/100 on livability (#133 in NJ, #3,533 nationally) — a middle-class / working-renter tenant base. Strengths: amenities A+, commute A+, health & safety A+; Watch: schools F, crime F, employment F.
- Trenton Public School District (urban): math 2% / reading 16% proficiency, ranked #471 of 472 in NJ (top 100%) — low school quality limits family demand, transient renter base, plan for 1-2y turnover; 80% free/reduced lunch — lower-income household profile, screen leases tightly.
- Market conditions: Rents rising fast (+4.7%/yr); 84 active listings in the ZIP; 20 comparable units currently listed for rent nearby; rentals at typical pace (median 21d on market — plan ~3-4 weeks tenant-placement turnaround); 2,256 units permitted in Mercer County in 2024 (1,303 in 5+ unit buildings).
- At $2,173/mo this rent would consume 46% of the median local household income ($57k/yr) (locally 2147% of renters already pay >50% of income on rent) — very limited rent-growth headroom before tenants either downsize or default.
Forward outlook
- Local home prices are declining (-3.0%/yr); year-one equity from $1k of loan paydown is wiped out by about $6k of value loss. Plan a longer hold.
- Mercer County population projected at +4% by 2050 — modest demand growth; plan on rents tracking national, not racing it.
- At projected returns (-3.0% appreciation + 4.7% rent growth), your $53k cash investment doubles in ~10 years — after that, you're playing with house money.
Negotiation context
- Only 14 days on market — expect competitive offers; lowballing is unlikely to land.
- 3 sale attempts since 25y ago; this cycle's ask has dropped $10k (5%) from the opening price — seller is motivated, your offer sets the floor, not the list.
- Current owner paid $120k; list at $190k implies a 58% gain — meaningful room to come down on a strong offer.
Risks & watch-outs
- Watch-outs: built in 1927 — expect roof / HVAC / electrical / plumbing capex.
- Climate carrying-cost: major wind risk, 27% chance of damaging wind over 30y; extreme-heat days projected 7→15/yr by 2055 (HVAC capex compounding) — expect insurance premiums to compound above CPI over the hold.
Questions for the listing agent
- Built in 1927 — when were the roof, HVAC, electrical panel, plumbing, and water heater last replaced?
- Is there a deadline driving the sale (1031 exchange, divorce, estate, relocation)? That informs how much negotiation room exists.
- Schools are F-rated, which usually means shorter tenancies and higher turnover. Who's the typical renter profile here, and what's been the actual vacancy rate?
- Crime grade is F in this area — have there been break-ins, vandalism, or insurance claims at this property in the last 3 years? What carrier currently insures it and at what premium?
- What's the average days-on-market for RENTAL listings here right now (not sales)? A rising rental-DOM trend means longer vacancies and softer asking-rent achievability than the comps imply.
- What's the recent tenant-quality profile in this submarket — average credit score on applications, eviction rate, late-payment / NSF rate, and stable-employment percentage? A property-management company in the area should have these aggregated.
- How much new for-sale + rental construction is in the pipeline within 1–3 miles? Heavy new supply typically softens prices + rents 12–24 months out; constrained supply supports both.
Investment metrics
- 1% rule
- 1.14% ✓
- Cap rate
- 8.92%
- Cash-on-cash
- 9.37%
- DSCR
- 1.42
- GRM
- 7.3
CMA / ARV
- ARV (on-the-fly)
- $198,240
- Comps found
- 12
Show comp detail 12 sales within ~0.75 mi
| Address | Dist | Beds/Ba | Sqft | Sold | Price | $/sf | Match |
|---|---|---|---|---|---|---|---|
| 632 Lalor St | 0.14mi | 3/1.0 | 1,120 (0%) | 2mo | $215,000 | $192 | 92 |
| 35 Jersey St | 0.29mi | 4/1.0 (+1) | 1,131 (+1%) | 0mo | $210,000 | $186 | 80 |
| 345 Genesee St | 0.43mi | 3/1.0 | 1,080 (-4%) | 1mo | $110,000 | $102 | 74 |
| 1210 Chestnut Ave | 0.39mi | 3/1.0 | 1,047 (-6%) | 1mo | $170,000 | $162 | 70 |
| 859 Centre St | 0.56mi | 3/1.0 | 1,100 (-2%) | 2mo | $261,000 | $237 | 69 |
| 108 Fitz Randolph | 0.39mi | 3/1.5 | 1,218 (+9%) | 3mo | $215,000 | $177 | 63 |
| 1447 S Clinton Ave | 0.47mi | 3/1.0 | 1,200 (+7%) | 5mo | $201,000 | $168 | 62 |
| 57 New Cedar Ln | 0.75mi | 3/1.0 | 1,120 (0%) | 5mo | $141,000 | $126 | 61 |
| 203 3rd St | 0.50mi | 3/1.0 | 1,248 (+11%) | 1mo | $195,000 | $156 | 57 |
| 327 Woodland St | 0.55mi | 3/1.0 | 1,007 (-10%) | 3mo | $182,000 | $181 | 55 |
| 224 Gibbs Ave | 0.59mi | 3/1.0 | 976 (-13%) | 3mo | $193,250 | $198 | 49 |
| 1072 Lamberton St | 0.55mi | 2/2.0 (-1) | 1,275 (+14%) | 5mo | $202,000 | $158 | 38 |
Match score weights: distance 35% · size 25% · config 20% · recency 20%. Top-matched comps best support the ARV.
Projected returns pro-forma
-3.0% appreciation · 4.71% rent growth · sell at horizon
- IRR
- -0.2%
- Equity multiple
- 0.99×
- Total profit
- $-497
- Equity at exit
- $28,315
- IRR
- 11.1%
- Equity multiple
- 1.94×
- Total profit
- $49,887
- Equity at exit
- $16,419
Cash invested: $53,172 (down + closing). Projections, not guarantees.
Landlord ↔ Tenant lean methodology
- Overall (STATE)
- 21 Tenant-Leaning
- State New Jersey
- 21 Tenant-Leaning · D+6
- County
- — inherits STATE
- City
- — inherits STATE
ZIP-level market 08611
- Rents YoY
- 4.7%
- Active inventory
- 84
- Price-to-rent
- 7.3×
Monthly cashflow live
- Estimated rent
- $2,173 high interval (Pro) →
- Mortgage (P&I)
- −$996
- Tax from tax record
- −$227 /mo · $2,721/yr
- Insurance
- −$79
- HOA
- −$0
- Vacancy / Maint / Mgmt
- −$456
- Net cashflow
- $415
Break-even live
UW: 25.0% down · 7.5% · 30yr · 1.5% tax · 5.0% vac · 8.0% maint · 8.0% mgmt
Financing live
Cash to close
- Down payment
- $47,475
- Closing costs
- $5,697
- Reserves months
- —
- Total cash needed
- —
Loan-product check · same deal, 3 products live
Conventional
25% down · 7.5% · 30yr
- Down + closing
- —
- Monthly P&I
- —
- Monthly cashflow
- —
- DSCR
- —
- Eligible?
- —
Personal DTI + credit; lowest rate.
DSCR
20% down · 8.5% · 30yr
- Down + closing
- —
- Monthly P&I
- —
- Monthly cashflow
- —
- DSCR
- —
- Eligible?
- —
No personal income docs; deal must DSCR.
Hard money
10% down · 12.0% · 12mo
- Down + closing
- —
- Monthly P&I
- —
- Monthly cashflow
- —
- DSCR
- —
- Eligible?
- —
Short-term bridge; refi at stabilization.
Rent comps 20 comps
| Address | Beds | Baths | Sqft | Rent | $/sqft | DOM | Units | Dist |
|---|---|---|---|---|---|---|---|---|
| 244 Jersey St Trenton, NJ | 3.0 | 1.5 | 1368 | $2,300 | $1.68 | 13d | 1 | 0.13mi |
| 313 Home Ave Trenton, NJ | 3.0 | 1.0 | 1112 | $2,100 | $1.89 | 13d | 1 | 0.14mi |
| 233 Virginia Ave Trenton, NJ | 3.0 | 1.0 | 1302 | $2,500 | $1.92 | 12d | 1 | 0.23mi |
| 225 Home Ave Trenton, NJ | 2.0 | 1.0 | 800 | $1,750 | $2.19 | 21d | 1 | 0.24mi |
| 1103 Division St Trenton, NJ | 4.0 | 1.0 | 1296 | $2,000 | $1.54 | 21d | 1 | 0.36mi |
| 837 Genesee St Trenton, NJ | 2.0 | 1.0 | 850 | $1,700 | $2.00 | 21d | 1 | 0.43mi |
| 1049 Genesee St Trenton, NJ | 3.0 | 1.0 | 1270 | $2,300 | $1.81 | 21d | 1 | 0.53mi |
| 203 Genesee St Unit 2 Trenton, NJ | 2.0 | 1.0 | 1452 | $1,700 | $1.17 | 21d | 1 | 0.53mi |
| 705 Anderson St Trenton, NJ | 3.0 | 1.0 | 1132 | $1,800 | $1.59 | 13d | 1 | 0.57mi |
| 547 Centre St Trenton, NJ | 3.0 | 1.0 | 1060 | $1,850 | $1.75 | 21d | 1 | 0.58mi |
| 1132 Genesee St Unit 1132 Trenton, NJ | 3.0 | 1.0 | 1198 | $2,500 | $2.09 | 21d | 1 | 0.59mi |
| 1078 Lalor St Unit 1 Trenton, NJ | 2.0 | 1.0 | 1488 | $1,895 | $1.27 | 21d | 1 | 0.61mi |
| 1078 Lalor St Unit 2 Trenton, NJ | 2.0 | 1.0 | 1488 | $1,785 | $1.20 | 21d | 1 | 0.61mi |
| 176 Division St Apt 106 Trenton, NJ | 2.0 | 1.0 | 975 | $1,700 | $1.74 | 21d | 1 | 0.80mi |
| 71 Clark St Trenton, NJ | 1.0–2.0 | 1.0–2.0 | 975 | $2,350 | $2.41 | 13d | 4 | 0.85mi |
| 635 Chambers St Trenton, NJ | 4.0 | 2.0 | 1312 | $2,500 | $1.91 | 13d | 1 | 1.09mi |
| 720 Monmouth St Unit 204 Trenton, NJ | 2.0 | 1.0 | 1011 | $1,750 | $1.73 | 21d | 1 | 1.13mi |
| 121 Columbus Ave Trenton, NJ | 3.0 | 1.0 | 1050 | $1,900 | $1.81 | 21d | 1 | 1.16mi |
| 105 Walnut Ave Unit 1 Trenton, NJ | 2.0 | 1.0 | 1200 | $2,000 | $1.67 | 21d | 1 | 1.36mi |
| 234 Walnut Ave Trenton, NJ | 4.0 | 1.0 | 1480 | $2,200 | $1.49 | 21d | 1 | 1.48mi |
Listing history 10 events
-
2026-06-18days on market $189,900 Active 14 DOM
-
2026-06-17days on market $189,900 Active 13 DOM
-
2026-06-16pricedays on market $189,900 Active 12 DOM
-
2026-06-15days on market $199,900 Active 11 DOM
-
2026-06-14days on market $199,900 Active 9 DOM
-
2026-06-10days on market $199,900 Active 6 DOM
-
2026-06-09days on market $199,900 Active 5 DOM
-
2026-06-08days on market $199,900 Active 4 DOM
-
2026-06-07remarks 447-char remark
-
2026-06-07$199,900 Active 3 DOM
ⓘ Source: listings_history table (triggers on properties + properties_extension) + one-shot
backfill from property_details.listing_events for pre-trigger history.
Tax reassessment forecast NJ · Partial reset (capped growth)
- Current annual tax
- $2,721 · $227/mo
- Projected year-2 tax
- $3,725 · $310/mo
- Expected delta
- +$1,004/yr (+$84/mo · 36.9%)
ⓘ Screening estimate from a state-policy table — verify with the county assessor before closing.
Climate risk First Street
- Flood 1/10 Low FEMA zone X (unshaded) · 0% chance over 30 yrs
- Wildfire 1/10 Low
- Heat 6/10 Major 7 d/yr ≥102°F today · 15 d/yr by 30 yrs out
- Wind 6/10 Major 27% chance of damaging wind over 30 yrs
- Air quality 5/10 Major 6 unhealthy d/yr today · 8 by 30 yrs out
Nearby sold comps map
Loading sold comps map…
Walkable amenities ~0.75 mi
Loading nearby amenities…
Taxation est. · year 1
- Rental income
- $26,081
- − Mortgage interest
- −$10,637
- − Property taxes
- −$2,721
- − Insurance
- −$950
- − Repairs & maintenance
- −$2,086
- − Management
- −$2,086
- − Depreciation
- −$5,524
- Taxable income
- $2,075
- Est. tax owed @ 24.0%
- −$498
- After-tax cash flow
- $4,485/yr
For passive investors: Depreciation is non-cash, so a rental often shows a tax loss while cash-flowing — sheltering income. Rental losses are passive: they offset passive income freely, and up to $25,000/yr can offset ordinary (W-2) income if you actively participate and your MAGI is under $100k (phasing out to $0 by $150k); unused losses carry forward. On sale, claimed depreciation is recaptured at up to 25%, and gains may owe capital-gains tax (a 1031 exchange can defer both). Figures are a year-1 estimate at your 24.0% rate — not tax advice; consult a CPA.
Schools (NCES district)
- District
- Trenton Public School District
- NCES district ID
- 3416290
- Math proficiency
- 2% ▼ -8.00%
- Reading proficiency
- 16% ▼ -4.00%
- Median HH income
- $35,078
- Composite
- 7.31/100
- National rank
- #9956
- State rank
- #471 of 472 in NJ
Livability — Trenton
- Score
- 76/100
- State rank
- #133
- US rank
- #3533
Category grades
Schools grade is shown separately in the Schools card above.
Census & demographics
- Census place
- Trenton, NJ
- County
- Mercer County · 327,655 people
- City population
- 177,819
- Metro
- Trenton-Princeton, NJ
- Population (ZIP)
- 31,995
- Household income
- $56,788
- Rent vs Own
- Severe rent burden
- 2147.0
Population outlook (Mercer County) Hauer SSP2
- Today (2025)
- 381,395 people
- By 2030
- 384,640 · +0.9%
- By 2040
- 391,431 · +2.6%
- By 2050
- 397,845 · +4.3%
- By 2075
- 417,281 · +9.4%
- By 2100
- 420,327 · +10.2%
Race, ethnicity, and origin ACS 2023
- Neighborhood character
- Diverse neighborhood (Simpson 0.56)
- Race & ethnicity
- Hispanic / Latino 62% Black 20% Two or more races 18% White 14% Native American 4%
- Hispanic origin (detail)
- Mexican 2% Puerto Rican 12% Dominican 8%
- Common ancestry
- Romanian 2% Swiss 1% Hispanic 1%
- Foreign-born
- 37% · Canada, Jamaica, Guatemala
- Languages at home
- 41% English-only · Spanish 57% French/Haitian/Cajun 2%
Political lean MEDSL · Mercer
- 2024 margin
- Solid D (+33.9) · D 65.9% · R 32.0% · Other 2.1%
- 2008→2024 swing
- -2.2pp toward R · 2008: 36.1pp · 2024: 33.9pp
- All cycles
- 2024: D+33.9 2020: D+40.0 2016: D+36.2 2012: D+36.8 2008: D+36.1
Not yet ingested
- Civics
- —
Market trends
- HPI YoY
- ▼ -267.62%
- Current HPI
- 276.5427
- Rent YoY
- ▲ 4.71%
- Metro
- Trenton-Princeton, NJ
- State GDP YoY
- ▲ 2.05%
- F500 in state
- 34
Industry mix (Fortune 500 HQ in NJ)
| Industry | F500 HQs | Revenue |
|---|---|---|
| Consumer Goods | 3 | $31B |
|
||
| Pharmaceuticals | 2 | $153B |
|
||
| Technology | 2 | $21B |
|
||
| Insurance | 2 | $20B |
|
||
| Healthcare | 2 | $19B |
|
||
| Financial Services | 1 | $70B |
|
||
Price history
+228.8% since first listed9 events — show timeline
- 2026-06-04 Listed $199,900 BRIGHT MLS
- 2006-03-29 Sold (Public Records) $119,900 Public Records
- 2005-08-23 Sold (MLS) $119,900 BRIGHT MLS
- 2005-06-28 Listing Removed — BRIGHT MLS
- 2005-06-21 Listed $119,900 BRIGHT MLS
- 2002-01-03 Sold (Public Records) $60,800 Public Records
- 2001-11-27 Sold (MLS) $60,800 BRIGHT MLS
- 2001-10-03 Listing Removed — BRIGHT MLS
- 2001-09-11 Listed $60,800 BRIGHT MLS
Property tax history
+0.3%/yrLatest (2025): $2,721 · +1.5% YoY. Source: county tax records.
Cash-flow waterfall
monthlySold comps — $/sqft
last 12 mo · ≤1 miLoading sold comps…