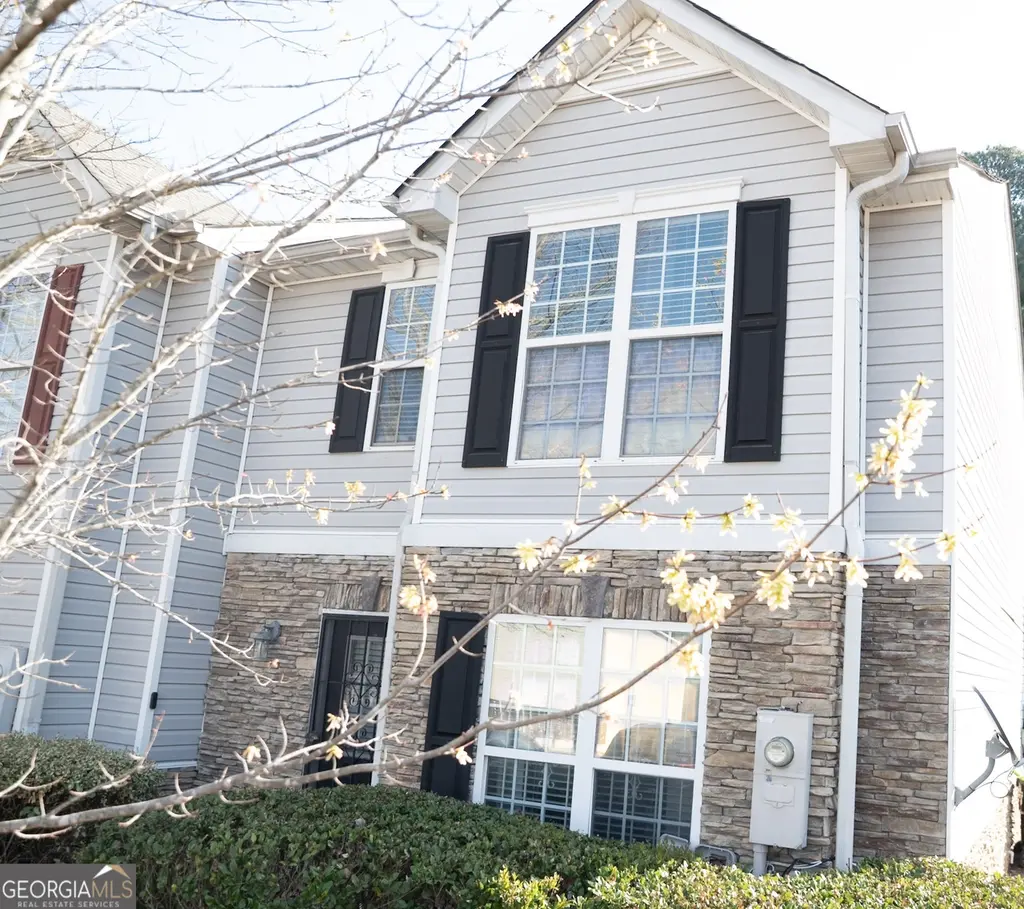
5800 Union Walk Dr · Union City, GA
Flood risk 1/10 · Minimal
- FEMA flood zone
- X (unshaded)
- Chance of flooding over 30 yrs
- 0.0%
- Est. flood insurance / yr
- $507 – $1,088
Fire risk 3/10 · Minor
- Est. fire insurance / yr
- $963 – $1,789
Heat risk 6/10 · Moderate
- Hot days now (above 103°F)
- 7 days/yr
- Hot days in 30 yrs
- 18 days/yr
Wind risk 5/10 · Moderate
- Chance of severe wind over 30 yrs
- 25.0%
Air-quality risk 3/10 · Minor
- Unhealthy air days now
- 3 days/yr
- Unhealthy air days in 30 yrs
- 4 days/yr
Risk factors via First Street. Map © Google.
Why this score? — see what drove the C+ grade
The composite is a weighted blend of 9 inputs, each scored 0–100. Each bar is that input's sub-score; the figure is the points it added to the 100-point composite (weight × sub-score).
- Cash flow +17.0/30.0
- ARV discount +11.6/15.0
- Appreciation +10.0/10.0
- DSCR +5.3/10.0
- 1% rule +4.6/10.0
- Schools +4.5/10.0
- Rent growth +3.1/5.0
- Livability +2.9/5.0
- Condition / age +2.5/5.0
$210,000
🖨 Deal sheet 📄 Offer letter ✓ Due diligence
Listing remarks
Get ready to fall in love with 5800 Union Walk in Union City! - an incredible end-unit opportunity that delivers the space, privacy, and comfort buyers are looking for! From the moment you arrive, this home stands out with its desirable end-unit location, offering added privacy and a more open feel. Inside, you'll find a spacious layout perfect for both everyday living and entertaining, while the oversized owner's suite creates a true retreat with plenty of room to relax and recharge. Ideally located near major interstates, shopping, dining, and Hartsfield-Jackson Atlanta International Airport, this home offers the perfect blend of convenience and lifestyle. Whether you're searching for you
Key facts
- Built 2006
- Listed 20 days
Neighborhood map
What this means for you Summary
Snapshot
- This is a 3-bed/2.5-bath townhouse listed at $210k.
Deal economics
- At list price, monthly cash flow is $141 ($2k/yr) — positive.
- The deal already cash-flows at list — no discount required.
- To meet the 1% rule (rent ≥ 1% of price), the offer needs to be $202k (3.7% below list).
- Recommended offer: $202k (3.7% below list) — sets the bar for 1% rule.
- Cap rate 7.1% vs local median 5.4% in Union City — top-decile yield for the area; either an underpriced asset or a hidden risk that comps aren't pricing in. Stress-test before assuming the spread holds.
Location & tenants
- Location reads 58/100 on livability (#443 in GA) — a working-class tenant base; expect higher turnover. Strengths: cost of living A+, housing A+; Watch: crime D+, amenities F, commute F.
- Fulton County (suburban): math 49% / reading 53% proficiency, ranked #12 of 174 in GA (top 7%) — acceptable for families but not a draw, mixed tenant base, ~2y average lease.
- Zoned schools: Campbell Elementary School (math 27% / reading 22%, grade F, #753 of 1,228 statewide, top 64%, 568 students, 100% FRL); Renaissance Middle School (math 22% / reading 27%, grade F, #301 of 470 statewide, top 66%, 1,166 students, 71% FRL); Creekside High School (math 30% / reading 24%, grade F, #160 of 424 statewide, top 38%, 1,768 students, 100% FRL) — zoned schools average 90% FRL vs 41% district-wide (49 pts higher); higher-poverty schools than district average — tighter screening recommended.
- Zoned-school proficiency averages 25% at this address vs 51% district-wide (-26 pts) — the specific schools serving this property underperform the Fulton County average; the district grade overstates school quality for this exact location.
- Market conditions: Rents rising (+2.2%/yr); 167 active listings in the ZIP; 40 comparable units currently listed for rent nearby; rentals at typical pace (median 24d on market — plan ~3-4 weeks tenant-placement turnaround); 40% of comp listings sitting > 30 days — soft ceiling on asking rent; 11,565 units permitted in Fulton County in 2024 (8,159 in 5+ unit buildings).
Forward outlook
- In year one you build about $22k of equity ($1k loan paydown + $21k appreciation (10.0% local appreciation)).
- Fulton County population projected at +38% by 2050 — long-run rental-demand tailwind backs the buy-and-hold thesis.
- At projected returns (10.0% appreciation + 2.2% rent growth), your $59k cash investment doubles in ~3 years — after that, you're playing with house money.
- By year 2, paydown + projected appreciation supports a ~$36k cash-out refi (75% LTV) — recoverable capital for the next deal without selling this one.
Negotiation context
- It's been on market 20 days — a 2% lower offer ($207k) is reasonable based on typical stale-listing flexibility.
- 4 sale attempts since 3y ago with the ask held roughly flat each time — persistent listings suggest the price (not the market) is what's stuck; bring a comps-based counter.
Risks & watch-outs
- Climate carrying-cost: moderate wind risk, 25% chance of damaging wind over 30y; extreme-heat days projected 7→18/yr by 2055 (HVAC capex compounding) — expect insurance premiums to compound above CPI over the hold.
Questions for the listing agent
- Is there a deadline driving the sale (1031 exchange, divorce, estate, relocation)? That informs how much negotiation room exists.
- Schools are F-rated, which usually means shorter tenancies and higher turnover. Who's the typical renter profile here, and what's been the actual vacancy rate?
- Crime grade is D in this area — have there been break-ins, vandalism, or insurance claims at this property in the last 3 years? What carrier currently insures it and at what premium?
- What's the average days-on-market for RENTAL listings here right now (not sales)? A rising rental-DOM trend means longer vacancies and softer asking-rent achievability than the comps imply.
- What's the recent tenant-quality profile in this submarket — average credit score on applications, eviction rate, late-payment / NSF rate, and stable-employment percentage? A property-management company in the area should have these aggregated.
- How much new for-sale + rental construction is in the pipeline within 1–3 miles? Heavy new supply typically softens prices + rents 12–24 months out; constrained supply supports both.
Investment metrics
- 1% rule
- 0.96% ✗
- Cap rate
- 7.10%
- Cash-on-cash
- 2.87%
- DSCR
- 1.13
- GRM
- 8.7
CMA / ARV
- ARV (on-the-fly)
- $231,264
- Comps found
- 7
Show comp detail 7 sales within ~0.75 mi
| Address | Dist | Beds/Ba | Sqft | Sold | Price | $/sf | Match |
|---|---|---|---|---|---|---|---|
| 5800 Union Walk Dr | 0.00mi | 3/2.5 | 1,520 (-4%) | 0mo | $199,000 | $131 | 93 |
| 5634 Union Pointe Dr | 0.04mi | 3/2.5 | 1,516 (-4%) | 11mo | $245,000 | $162 | 82 |
| 5696 Union Pointe Dr | 0.14mi | 3/2.5 | 1,536 (-3%) | 10mo | $242,000 | $158 | 80 |
| 5604 Union Pointe Dr | 0.05mi | 3/2.5 | 1,644 (+4%) | 22mo | $239,900 | $146 | 73 |
| 5625 Union Pointe Dr | 0.05mi | 3/2.5 | 1,668 (+5%) | 20mo | $207,000 | $124 | 73 |
| 5704 Union Pointe Dr | 0.15mi | 3/2.5 | 1,536 (-3%) | 23mo | $265,000 | $173 | 69 |
| 5195 Lincoln Dr | 0.73mi | 3/2.5 | 1,458 (-8%) | 5mo | $213,500 | $146 | 49 |
Match score weights: distance 35% · size 25% · config 20% · recency 20%. Top-matched comps best support the ARV.
Projected returns pro-forma
10.0% appreciation · 2.2% rent growth · sell at horizon
- IRR
- 26.1%
- Equity multiple
- 3.07×
- Total profit
- $121,753
- Equity at exit
- $189,185
- IRR
- 22.7%
- Equity multiple
- 6.93×
- Total profit
- $348,391
- Equity at exit
- $407,984
Cash invested: $58,800 (down + closing). Projections, not guarantees.
Landlord ↔ Tenant lean methodology
- Overall (STATE)
- 90 Strongly Landlord-Friendly
- State Georgia
- 90 Strongly Landlord-Friendly · R+3
- County
- — inherits STATE
- City
- — inherits STATE
ZIP-level market 30291
- Home prices YoY
- 11.1%
- Rents YoY
- 2.2%
- Active inventory
- 167
- Price-to-rent
- 8.7×
Monthly cashflow live
- Estimated rent
- $2,022 high interval (Pro) →
- Mortgage (P&I)
- −$1,101
- Tax from tax record
- −$268 /mo · $3,216/yr
- Insurance
- −$88
- HOA
- −$0
- Vacancy / Maint / Mgmt
- −$425
- Net cashflow
- $141
Break-even live
UW: 25.0% down · 7.5% · 30yr · 1.5% tax · 5.0% vac · 8.0% maint · 8.0% mgmt
Financing live
Cash to close
- Down payment
- $52,500
- Closing costs
- $6,300
- Reserves months
- —
- Total cash needed
- —
Loan-product check · same deal, 3 products live
Conventional
25% down · 7.5% · 30yr
- Down + closing
- —
- Monthly P&I
- —
- Monthly cashflow
- —
- DSCR
- —
- Eligible?
- —
Personal DTI + credit; lowest rate.
DSCR
20% down · 8.5% · 30yr
- Down + closing
- —
- Monthly P&I
- —
- Monthly cashflow
- —
- DSCR
- —
- Eligible?
- —
No personal income docs; deal must DSCR.
Hard money
10% down · 12.0% · 12mo
- Down + closing
- —
- Monthly P&I
- —
- Monthly cashflow
- —
- DSCR
- —
- Eligible?
- —
Short-term bridge; refi at stabilization.
Rent comps 40 comps
| Address | Beds | Baths | Sqft | Rent | $/sqft | DOM | Units | Dist |
|---|---|---|---|---|---|---|---|---|
| 5616 Union Pointe Dr Union City, GA | 2.0 | 2.5 | 1387 | $1,545 | $1.11 | 43d | 1 | 0.05mi |
| 5530 Union Pointe Pl Union City, GA | 3.0 | 2.0 | 1293 | $1,650 | $1.28 | 17d | 1 | 0.06mi |
| 5548 Union Pointe Pl Union City, GA | 4.0 | 2.5 | 1763 | $2,400 | $1.36 | 43d | 1 | 0.09mi |
| 5458 Union Hill Ct Union City, GA | 3.0 | 2.5 | 1650 | $2,096 | $1.27 | 24d | 1 | 0.15mi |
| 6115 Forrest Ave Union City, GA | 4.0 | 2.0 | 1368 | $1,690 | $1.24 | 43d | 1 | 0.32mi |
| 4497 Ravenwood Dr Union City, GA | 3.0 | 2.5 | 1694 | $2,000 | $1.18 | 20d | 1 | 0.42mi |
| 4497 Ravenwood Dr Union City, GA | 3.0 | 2.5 | 1694 | $2,000 | $1.18 | 43d | 1 | 0.42mi |
| 5791 Blacktop Ct Fairburn, GA | 4.0 | 2.5 | 1991 | $2,423 | $1.22 | 43d | 1 | 0.42mi |
| 4681 Ravenwood Loop Union City, GA | 4.0 | 2.5 | 1593 | $1,999 | $1.25 | 43d | 1 | 0.51mi |
| 3234 Diamond Blf Union City, GA | 4.0 | 2.5 | 1922 | $2,360 | $1.23 | 5d | 1 | 0.54mi |
| 4666 Ravenwood Loop Union City, GA | 4.0 | 3.0 | 1916 | $2,175 | $1.14 | 24d | 1 | 0.55mi |
| 3228 Diamond Blf Union City, GA | 4.0 | 2.5 | 1922 | $2,195 | $1.14 | 43d | 1 | 0.58mi |
| 6325 Raymond Ter Union City, GA | 2.0 | 1.0 | 1624 | $1,150 | $0.71 | 43d | 1 | 0.63mi |
| 5207 Dixie Lake Rd Union City, GA | 3.0 | 2.0 | 1516 | $1,950 | $1.29 | 43d | 1 | 0.71mi |
| 6540 Capitol Knl Fairburn, GA | 3.0 | 3.5 | 1458 | $1,920 | $1.32 | 5d | 1 | 0.74mi |
| 5950 Stonewall Dr Unit 2 Union City, GA | 3.0 | 1.5 | 1320 | $1,495 | $1.13 | 15d | 1 | 0.75mi |
| 5950 Stonewall Dr Unit 4 Union City, GA | 3.0 | 1.0 | 1320 | $1,445 | $1.09 | 2d | 1 | 0.75mi |
| 6120 Longino Dr Union City, GA | 4.0 | 2.0 | 1608 | $1,835 | $1.14 | 12d | 1 | 0.77mi |
| 6045 Capitol Knl Fairburn, GA | 3.0 | 2.5 | 1366 | $1,600 | $1.17 | 43d | 1 | 0.78mi |
| 5140 Highpoint Rd Apt 27 Union City, GA | 2.0 | 2.5 | 1290 | $1,295 | $1.00 | 12d | 1 | 0.78mi |
| 12076 Crosswicks Rd Union City, GA | 3.0–4.0 | 2.0–2.5 | 1617 | $2,731 | $1.69 | 1d | 6 | 0.79mi |
| 4509 Ravenwood Pl Union City, GA | 3.0 | 2.5 | 1394 | $1,970 | $1.41 | 12d | 1 | 0.86mi |
| 165 Fireside Way Fairburn, GA | 4.0 | 3.0 | 2230 | $2,396 | $1.07 | 43d | 1 | 0.87mi |
| 12006 Crosswicks Rd Unit Sunshine Union City, GA | 4.0 | 2.5 | 1821 | $2,770 | $1.52 | 3d | 1 | 0.87mi |
| 4037 Ravenwood Ct Union City, GA | 2.0 | 2.5 | 1394 | $1,595 | $1.14 | 1d | 1 | 0.88mi |
| 4037 Ravenwood Ct Union City, GA | 2.0 | 2.5 | 1394 | $1,595 | $1.14 | 15d | 1 | 0.88mi |
| 4037 Ravenwood Ct Union City, GA | 2.0 | 2.5 | 1394 | $1,595 | $1.14 | 24d | 1 | 0.88mi |
| 4037 Ravenwood Ct Union City, GA | 2.0 | 2.5 | 1394 | $1,625 | $1.17 | 43d | 1 | 0.88mi |
| 4122 Ravenwood Ct Union City, GA | 3.0 | 3.0 | 1394 | $1,849 | $1.33 | 24d | 1 | 0.88mi |
| 8317 Hunters Grove Rd Union City, GA | 4.0 | 2.5 | 1821 | $5,500 | $3.02 | 43d | 1 | 0.94mi |
| 220 Splitwood Ln Fairburn, GA | 3.0 | 2.0 | 1424 | $1,850 | $1.30 | 43d | 1 | 0.98mi |
| 220 Splitwood Ln Fairburn, GA | 3.0 | 2.0 | 1424 | $1,850 | $1.30 | 20d | 1 | 0.98mi |
| 220 Splitwood Ln Fairburn, GA | 3.0 | 2.0 | 1424 | $1,850 | $1.30 | 5d | 1 | 0.98mi |
| 220 Splitwood Ln Fairburn, GA | 3.0 | 2.0 | 1424 | $1,850 | $1.30 | 24d | 1 | 0.98mi |
| 12006 Crosswicks Rd Unit 105 Union City, GA | 3.0 | 2.5 | 1413 | $2,455 | $1.74 | 43d | 1 | 0.99mi |
| 12006 Crosswicks Rd Union City, GA | 4.0 | 3.0 | 1821 | $3,468 | $1.90 | 44d | 1 | 0.99mi |
| 12006 Crosswicks Rd Union City, GA | 3.0 | 2.0 | 1413 | $2,545 | $1.80 | 15d | 1 | 0.99mi |
| 365 Elder St Fairburn, GA | 3.0 | 2.5 | 1084 | $1,625 | $1.50 | 24d | 1 | 1.06mi |
| 4056 Robin Cir Atlanta, GA | 3.0 | 2.5 | 1174 | $1,895 | $1.61 | 24d | 1 | 1.15mi |
| 4062 Robin Cir Atlanta, GA | 3.0 | 3.0 | 1874 | $1,910 | $1.02 | 24d | 1 | 1.16mi |
Listing history 11 events
-
2026-04-14status Under Contract
-
2026-03-26$210,000 New
-
2026-03-24historical $210,000
-
2024-05-01historical $1,650
-
2024-04-30historical
-
2024-04-30historical
-
2024-04-11$1,650
-
2024-03-24price $235,999
-
2024-03-24price $235,999
-
2023-11-08$255,000 Active
-
2023-11-08$255,000 New
ⓘ Source: listings_history table (triggers on properties + properties_extension) + one-shot
backfill from property_details.listing_events for pre-trigger history.
Tax reassessment forecast GA · Resets to sale price
- Current annual tax
- $3,216 · $268/mo
- Projected year-2 tax
- $3,216 · $268/mo
- Expected delta
- $0/yr ($0/mo · 0.0%)
ⓘ Screening estimate from a state-policy table — verify with the county assessor before closing.
Climate risk First Street
- Flood 1/10 Low FEMA zone X (unshaded) · 0% chance over 30 yrs
- Wildfire 3/10 Moderate
- Heat 6/10 Major 7 d/yr ≥103°F today · 18 d/yr by 30 yrs out
- Wind 5/10 Major 25% chance of damaging wind over 30 yrs
- Air quality 3/10 Moderate 3 unhealthy d/yr today · 4 by 30 yrs out
Nearby sold comps map
Loading sold comps map…
Walkable amenities ~0.75 mi
Loading nearby amenities…
Taxation est. · year 1
- Rental income
- $24,266
- − Mortgage interest
- −$11,763
- − Property taxes
- −$3,216
- − Insurance
- −$1,050
- − Repairs & maintenance
- −$1,941
- − Management
- −$1,941
- − Depreciation
- −$6,109
- Taxable loss
- −$1,755
- Est. tax savings @ 24.0%
- +$421
- After-tax cash flow
- $2,110/yr
For passive investors: Depreciation is non-cash, so a rental often shows a tax loss while cash-flowing — sheltering income. Rental losses are passive: they offset passive income freely, and up to $25,000/yr can offset ordinary (W-2) income if you actively participate and your MAGI is under $100k (phasing out to $0 by $150k); unused losses carry forward. On sale, claimed depreciation is recaptured at up to 25%, and gains may owe capital-gains tax (a 1031 exchange can defer both). Figures are a year-1 estimate at your 24.0% rate — not tax advice; consult a CPA.
Schools (NCES district)
- District
- Fulton County
- NCES district ID
- 1302280
- Math proficiency
- 49% ▼ -2.00%
- Reading proficiency
- 53% ▬ 0.00%
- Median HH income
- $68,035
- Composite
- 45.33/100
- National rank
- #2640
- State rank
- #12 of 174 in GA
Livability — Union City
- Score
- 58/100
- State rank
- #443
- US rank
- #21281
Category grades
Schools grade is shown separately in the Schools card above.
Census & demographics
- Census place
- Union City, GA
- County
- Fulton County · 1,094,430 people
- City population
- 25,130
- Metro
- Atlanta-Sandy Springs-Alpharetta, GA
- Population (ZIP)
- 25,130
- Household income
- $48,184
- Rent vs Own
- Severe rent burden
- 1778.0
Population outlook (Fulton County) Hauer SSP2
- Today (2025)
- 1,203,707 people
- By 2030
- 1,299,706 · +8.0%
- By 2040
- 1,488,256 · +23.6%
- By 2050
- 1,664,580 · +38.3%
- By 2075
- 2,036,072 · +69.2%
- By 2100
- 2,222,402 · +84.6%
Race, ethnicity, and origin ACS 2023
- Neighborhood character
- Predominantly Black (86%)
- Race & ethnicity
- Black 86% Hispanic / Latino 7% Two or more races 6% White 3%
- Hispanic origin (detail)
- Mexican 4%
- Common ancestry
- Italian 1%
- Foreign-born
- 5% · Canada
- Languages at home
- 92% English-only · Spanish 6%
Political lean MEDSL · Fulton
- 2024 margin
- Solid D (+44.9) · D 71.9% · R 27.0% · Other 1.1%
- 2008→2024 swing
- +9.8pp toward D · 2008: 35.0pp · 2024: 44.9pp
- All cycles
- 2024: D+44.9 2020: D+46.4 2016: D+42.1 2012: D+29.6 2008: D+35.0
Not yet ingested
- Civics
- —
Market trends
- HPI YoY
- ▲ 23.98%
- Current HPI
- 239.3471
- Rent YoY
- ▲ 2.20%
- Metro
- Atlanta-Sandy Springs-Alpharetta, GA
- State GDP YoY
- ▲ 2.66%
- F500 in state
- 28
Industry mix (Fortune 500 HQ in GA)
| Industry | F500 HQs | Revenue |
|---|---|---|
| Paper / Packaging | 2 | $29B |
|
||
| Retail | 1 | $160B |
|
||
| Transportation / Logistics | 1 | $91B |
|
||
| Airlines | 1 | $62B |
|
||
| Consumer Goods | 1 | $47B |
|
||
| Utilities | 1 | $25B |
|
||
Price history
-17.6% since first listed11 events — show timeline
- 2026-04-14 Pending — GAMLS
- 2026-03-26 Listed $210,000 GAMLS
- 2026-03-24 Coming Soon $210,000 GAMLS
- 2024-05-01 Rental Removed $1,650 GAMLS
- 2024-04-30 Listing Removed — GAMLS
- 2024-04-30 Listing Removed — FMLS
- 2024-04-11 Listed for Rent $1,650 GAMLS
- 2024-03-24 Price Changed $235,999 FMLS
- 2024-03-24 Price Changed $235,999 GAMLS
- 2023-11-08 Listed $255,000 GAMLS
- 2023-11-08 Listed $255,000 FMLS
Property tax history
+5.3%/yrLatest (2025): $3,216 · +40.4% YoY. Source: county tax records.
Cash-flow waterfall
monthlySold comps — $/sqft
last 12 mo · ≤1 miLoading sold comps…