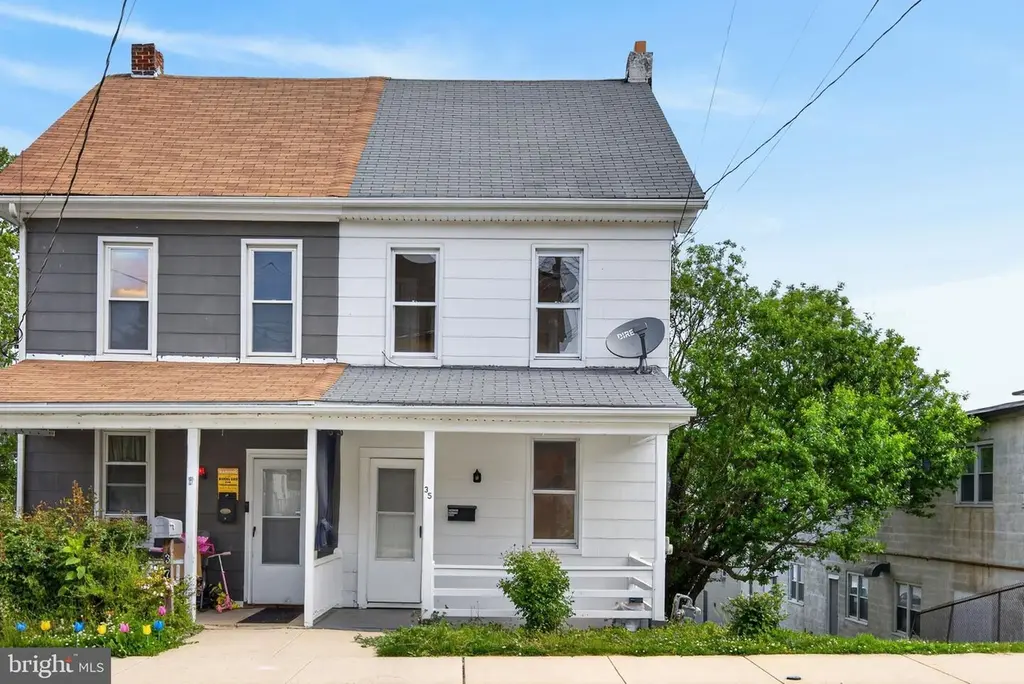
35 W Maple St · Dallastown, PA
Flood risk 4/10 · Minor
- FEMA flood zone
- X (unshaded)
- Chance of flooding over 30 yrs
- 0.22%
- Est. flood insurance / yr
- $473 – $860
Fire risk 1/10 · Minimal
- Est. fire insurance / yr
- $511 – $949
Heat risk 5/10 · Moderate
- Hot days now (above 100°F)
- 7 days/yr
- Hot days in 30 yrs
- 15 days/yr
Wind risk 4/10 · Minor
- Chance of severe wind over 30 yrs
- 12.0%
Air-quality risk 3/10 · Minor
- Unhealthy air days now
- 2 days/yr
- Unhealthy air days in 30 yrs
- 5 days/yr
Risk factors via First Street. Map © Google.
Why this score? — see what drove the D- grade
The composite is a weighted blend of 9 inputs, each scored 0–100. Each bar is that input's sub-score; the figure is the points it added to the 100-point composite (weight × sub-score).
- Cash flow +10.8/30.0
- ARV discount +6.2/15.0
- Schools +4.8/10.0
- Livability +3.5/5.0
- DSCR +3.1/10.0
- 1% rule +2.8/10.0
- Rent growth +2.5/5.0
- Condition / age +2.5/5.0
- Appreciation +0.0/10.0
$199,000
🖨 Deal sheet (PDF) 📄 Offer letter ✓ Due diligence
Listing remarks
Welcome to 35 W Maple St in the heart of Dallastown! Located in the highly sought-after Dallastown Area School District, this charming home offers plenty of space and versatility across three levels of living. Featuring 4 bedrooms and 1 full bathroom, this home combines character, functionality, and opportunity for its next owner. The partially finished basement provides additional living space perfect for a family room, home office, gym, or entertainment area, while still offering extra storage. The main living areas are filled with natural light and flow comfortably for everyday living. With four spacious bedrooms spread throughout the home, there’s room for everyone to enjoy their
Key facts
- Built 1920
- Listed 17 days
Property features AI
Exterior
- Parking: Off-street parking
- Utilities: Public water; Public sewer
- Home design: Semi-detached; Fee simple ownership
- Construction: Permanent foundation; Above-grade and below-grade structures; Above-grade finished area approximately 1,800
- Exterior features: Not in a federal flood zone
Interior
- Bedrooms: Four bedrooms on the first upper level
- Bathrooms: One full bathroom
- Heating & cooling: Central heating; Natural gas heating; Window cooling units (electric); Natural gas hot water
- Interior features: Estimated living area; Partially finished basement; Accessible switches and outlets; One fireplace
Neighborhood map
What this means for you Summary
Snapshot
- This is a 4-bed/1.0-bath townhouse listed at $199k.
Deal economics
- At list price, monthly cash flow is $-91 ($-1k/yr) — negative.
- To cash-flow at today's rent, offer at most $183k (8.1% below list).
- To meet the 1% rule (rent ≥ 1% of price), the offer needs to be $155k (21.9% below list).
- Recommended offer: $155k (21.9% below list) — sets the bar for 1% rule.
Location & tenants
- Location reads 69/100 on livability (#854 in PA) — a middle-class / working-renter tenant base. Strengths: cost of living A+, health & safety A+, crime A; Watch: employment D+, amenities F, commute F.
- Dallastown Area SD (suburban): math 47% / reading 63% proficiency, ranked #102 of 539 in PA (top 19%) — acceptable for families but not a draw, mixed tenant base, ~2y average lease.
- Market conditions: 42 active listings in the ZIP; 1,328 units permitted in York County in 2024 (338 in 5+ unit buildings).
Forward outlook
- Local home prices are declining (-3.0%/yr); year-one equity from $1k of loan paydown is wiped out by about $6k of value loss. Plan a longer hold.
Negotiation context
- It's been on market 18 days — a 2% lower offer ($196k) is reasonable based on typical stale-listing flexibility.
- Current owner paid $125k; list at $199k implies a 60% gain — meaningful room to come down on a strong offer.
Risks & watch-outs
- Watch-outs: built in 1920 — expect roof / HVAC / electrical / plumbing capex.
- Climate carrying-cost: extreme-heat days projected 7→15/yr by 2055 (HVAC capex compounding) — expect insurance premiums to compound above CPI over the hold.
Questions for the listing agent
- What do current leases actually rent for vs. the listed asking? Can we see a recent rent roll and the last 12 months of T-12 income?
- Built in 1920 — when were the roof, HVAC, electrical panel, plumbing, and water heater last replaced?
- Is there a deadline driving the sale (1031 exchange, divorce, estate, relocation)? That informs how much negotiation room exists.
- Schools are B-rated — typically a magnet for longer-tenancy family renters. What's the average tenant stay here, and is there a school-zone premium baked into asking?
- The area grade is low — what's the realistic commute time and amenity access for the typical tenant pool here? Any planned neighborhood developments (good or bad) we should know about?
- What's the average days-on-market for RENTAL listings here right now (not sales)? A rising rental-DOM trend means longer vacancies and softer asking-rent achievability than the comps imply.
- What's the recent tenant-quality profile in this submarket — average credit score on applications, eviction rate, late-payment / NSF rate, and stable-employment percentage? A property-management company in the area should have these aggregated.
- How much new for-sale + rental construction is in the pipeline within 1–3 miles? Heavy new supply typically softens prices + rents 12–24 months out; constrained supply supports both.
Investment metrics
- 1% rule
- 0.78% ✗
- Cap rate
- 5.74%
- Cash-on-cash
- -1.97%
- DSCR
- 0.91
- GRM
- 10.7
CMA / ARV
- ARV (on-the-fly)
- $193,536
- Comps found
- 1
Show comp detail 1 sale within ~0.75 mi
| Address | Dist | Beds/Ba | Sqft | Sold | Price | $/sf | Match |
|---|---|---|---|---|---|---|---|
| 68 W Maple St | 0.07mi | 3/1.0 (-1) | 996 (+11%) | 12mo | $214,900 | $216 | 64 |
Match score weights: distance 35% · size 25% · config 20% · recency 20%. Top-matched comps best support the ARV.
Projected returns pro-forma
-3.0% appreciation · 3.0% rent growth · sell at horizon
- IRR
- -19.6%
- Equity multiple
- 0.32×
- Total profit
- $-38,084
- Equity at exit
- $29,672
- IRR
- -12.4%
- Equity multiple
- 0.27×
- Total profit
- $-40,709
- Equity at exit
- $17,206
Cash invested: $55,720 (down + closing). Projections, not guarantees.
Landlord ↔ Tenant lean methodology
- Overall (STATE)
- 62 Landlord-Friendly
- State Pennsylvania
- 62 Landlord-Friendly · EVEN
- County
- — inherits STATE
- City
- — inherits STATE
ZIP-level market 17313
- Home prices YoY
- -26.5%
- Active inventory
- 42
- Price-to-rent
- 10.7×
Monthly cashflow live
- Estimated rent
- $1,554 medium interval (Pro) →
- Mortgage (P&I)
- −$1,044
- Tax from tax record
- −$193 /mo · $2,314/yr
- Insurance
- −$83
- HOA
- −$0
- Vacancy / Maint / Mgmt
- −$326
- Net cashflow
- $-91
Break-even live
Sensitivity live
| Price | -10% $21 | -5% $-35 | +0% $-91 | +5% $-148 | +10% $-204 |
|---|---|---|---|---|---|
| Rent | -10% $-214 | -5% $-153 | +0% $-91 | +5% $-30 | +10% $31 |
| Rate | -1.0pp $9 | -0.5pp $-41 | base $-91 | +0.5pp $-143 | +1.0pp $-196 |
UW: 25.0% down · 7.5% · 30yr · 1.5% tax · 5.0% vac · 8.0% maint · 8.0% mgmt
Financing live
Cash to close
- Down payment
- $49,750
- Closing costs
- $5,970
- Reserves months
- —
- Total cash needed
- —
Loan-product check · same deal, 3 products live
Conventional
25% down · 7.5% · 30yr
- Down + closing
- —
- Monthly P&I
- —
- Monthly cashflow
- —
- DSCR
- —
- Eligible?
- —
Personal DTI + credit; lowest rate.
DSCR
20% down · 8.5% · 30yr
- Down + closing
- —
- Monthly P&I
- —
- Monthly cashflow
- —
- DSCR
- —
- Eligible?
- —
No personal income docs; deal must DSCR.
Hard money
10% down · 12.0% · 12mo
- Down + closing
- —
- Monthly P&I
- —
- Monthly cashflow
- —
- DSCR
- —
- Eligible?
- —
Short-term bridge; refi at stabilization.
Listing history 9 events
-
2026-06-03days on market $199,000 Active 18 DOM
-
2026-06-02days on market $199,000 Active 17 DOM
-
2026-06-01days on market $199,000 Active 16 DOM
-
2026-05-31days on market $199,000 Active 15 DOM
-
2026-05-30days on market $199,000 Active 14 DOM
-
2026-05-17$199,000 Active
-
2026-05-16historical $199,000
-
2025-02-21soldstatus $124,598
-
1990-08-16soldstatus $49,900
ⓘ Source: listings_history table (triggers on properties + properties_extension) + one-shot
backfill from property_details.listing_events for pre-trigger history.
Tax reassessment forecast PA · Partial reset (capped growth)
- Current annual tax
- $2,314 · $193/mo
- Projected year-2 tax
- $2,729 · $227/mo
- Expected delta
- +$415/yr (+$35/mo · 17.9%)
ⓘ Screening estimate from a state-policy table — verify with the county assessor before closing.
Climate risk First Street
- Flood 4/10 Moderate FEMA zone X (unshaded) · 22% chance over 30 yrs
- Wildfire 1/10 Low
- Heat 5/10 Major 7 d/yr ≥100°F today · 15 d/yr by 30 yrs out
- Wind 4/10 Moderate 12% chance of damaging wind over 30 yrs
- Air quality 3/10 Moderate 2 unhealthy d/yr today · 5 by 30 yrs out
Nearby sold comps map
Loading sold comps map…
Walkable amenities ~0.75 mi
Loading nearby amenities…
Taxation est. · year 1
- Rental income
- $18,651
- − Mortgage interest
- −$11,147
- − Property taxes
- −$2,314
- − Insurance
- −$995
- − Repairs & maintenance
- −$1,492
- − Management
- −$1,492
- − Depreciation
- −$5,789
- Taxable loss
- −$4,578
- Est. tax savings @ 24.0%
- +$1,099
- After-tax cash flow
- $1/yr
For passive investors: Depreciation is non-cash, so a rental often shows a tax loss while cash-flowing — sheltering income. Rental losses are passive: they offset passive income freely, and up to $25,000/yr can offset ordinary (W-2) income if you actively participate and your MAGI is under $100k (phasing out to $0 by $150k); unused losses carry forward. On sale, claimed depreciation is recaptured at up to 25%, and gains may owe capital-gains tax (a 1031 exchange can defer both). Figures are a year-1 estimate at your 24.0% rate — not tax advice; consult a CPA.
Schools (NCES district)
- District
- Dallastown Area SD
- NCES district ID
- 4207230
- Math proficiency
- 47% ▼ -5.00%
- Reading proficiency
- 63% ▼ -9.00%
- Median HH income
- $61,805
- Composite
- 48.0/100
- National rank
- #2199
- State rank
- #102 of 539 in PA
Livability — Dallastown
- Score
- 69/100
- State rank
- #854
- US rank
- #8965
Category grades
Schools grade is shown separately in the Schools card above.
Census & demographics
- Census place
- Dallastown, PA
- Population (ZIP)
- 11,263
Population outlook (York County) Hauer SSP2
- Today (2025)
- 454,205 people
- By 2030
- 457,407 · +0.7%
- By 2040
- 457,529 · +0.7%
- By 2050
- 448,261 · -1.3%
- By 2075
- 427,388 · -5.9%
- By 2100
- 384,218 · -15.4%
Race, ethnicity, and origin ACS 2023
- Neighborhood character
- Predominantly White (81%)
- Race & ethnicity
- White 81% Two or more races 9% Hispanic / Latino 5% Black 5%
- Common ancestry
- Romanian 5% Serbian 2% Iranian 2%
- Foreign-born
- 3% · China, Canada
- Languages at home
- 96% English-only · Spanish 2% Other Indo-European 1%
Political lean MEDSL · York
- 2024 margin
- Strong R (+25.3) · D 36.9% · R 62.1%
- 2008→2024 swing
- -11.7pp toward R · 2008: -13.6pp · 2024: -25.3pp
- All cycles
- 2024: R+25.3 2020: R+24.6 2016: R+29.3 2012: R+21.2 2008: R+13.6
Not yet ingested
- Civics
- —
Market trends
- HPI YoY
- ▼ -93.45%
- Current HPI
- 258.6397
- Rent YoY
- —
- Metro
- —
- State GDP YoY
- ▲ 1.68%
- F500 in state
- 34
Industry mix (Fortune 500 HQ in PA)
| Industry | F500 HQs | Revenue |
|---|---|---|
| Healthcare | 2 | $309B |
|
||
| Insurance | 2 | $27B |
|
||
| Telecommunications / Media | 1 | $124B |
|
||
| Industrial Distribution | 1 | $22B |
|
||
| Financial Services | 1 | $20B |
|
||
| Chemicals / Materials | 1 | $18B |
|
||
Price history
+298.8% since first listed4 events — show timeline
- 2026-05-17 Listed $199,000 BRIGHT MLS
- 2026-05-16 Coming Soon $199,000 BRIGHT MLS
- 2025-02-21 Sold (Public Records) $124,598 Public Records
- 1990-08-16 Sold (Public Records) $49,900 Public Records
Property tax history
+1.8%/yrLatest (2025): $2,314 · +0.0% YoY. Source: county tax records.
Cash-flow waterfall
monthlySold comps — $/sqft
last 12 mo · ≤1 miLoading sold comps…