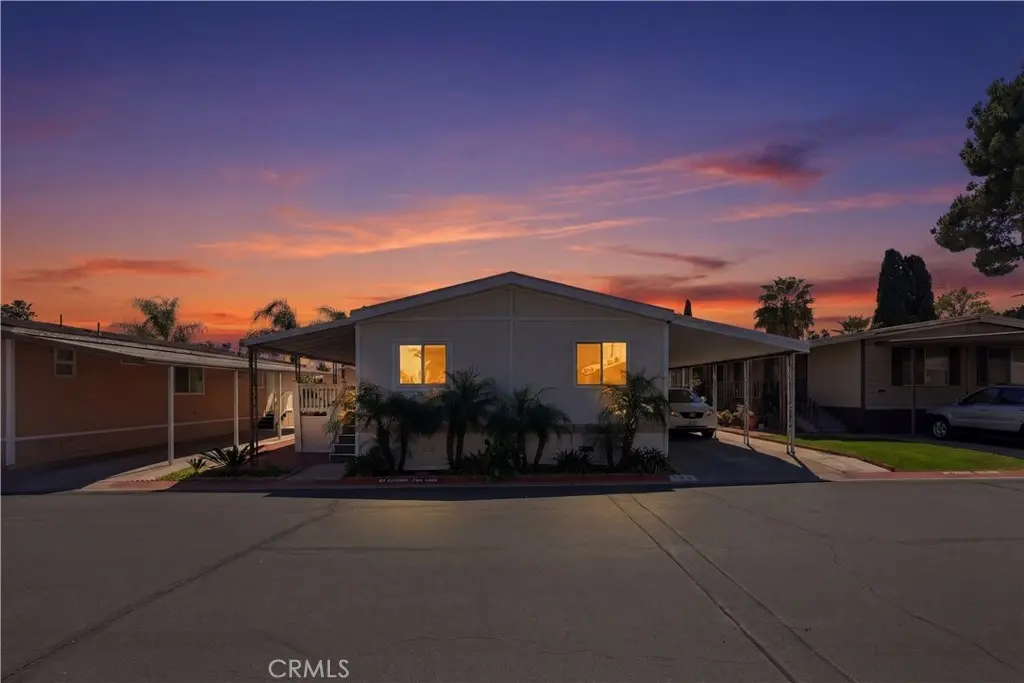
1855 E Riverside Dr #158 · Ontario, CA
Flood risk 1/10 · Minimal
- FEMA flood zone
- X (shaded)
- Chance of flooding over 30 yrs
- 0.0%
- Est. flood insurance / yr
- $507 – $1,088
Fire risk 3/10 · Minor
- Est. fire insurance / yr
- $659 – $1,223
Heat risk 8/10 · Major
- Hot days now (above 101°F)
- 7 days/yr
- Hot days in 30 yrs
- 18 days/yr
Wind risk 1/10 · Minimal
- Chance of severe wind over 30 yrs
- —
Air-quality risk 9/10 · Severe
- Unhealthy air days now
- 23 days/yr
- Unhealthy air days in 30 yrs
- 26 days/yr
Risk factors via First Street. Map © Google.
Why this score? — see what drove the C+ grade
The composite is a weighted blend of 9 inputs, each scored 0–100. Each bar is that input's sub-score; the figure is the points it added to the 100-point composite (weight × sub-score).
- Cash flow +30.0/30.0
- 1% rule +10.0/10.0
- DSCR +10.0/10.0
- Schools +5.0/10.0
- Livability +3.2/5.0
- Rent growth +3.1/5.0
- Condition / age +2.5/5.0
- ARV discount +0.0/15.0
- Appreciation +0.0/10.0
$150,000
🖨 Deal sheet (PDF) 📄 Offer letter ✓ Due diligence
Listing remarks MLS
Welcome to this beautifully updated 3-bedroom, 2-bathroom home offering 1,344 sq ft of thoughtfully renovated living space in a well maintained all age community. From the moment you step inside, you'll notice the attention to detail, fresh tile flooring flows throughout, complemented by recessed lighting, ceiling fans, and a bright, open feel that makes every room feel larger than it is. The spacious open concept living area connects seamlessly to a fully updated kitchen featuring new countertops, a striking stainless range hood, and ample cabinetry, perfect for cooking and entertaining. A separate dining area adds functionality and charm. The primary suite offers a private en suite bathroom, providing a true retreat at the end of the day. Two additional bedrooms offer flexibility for family, guests, or a home office. Both bathrooms have been updated and the home features newly updated plumbing and HVAC throughout, giving buyers true peace of mind. One of the standout features is the dedicated interior laundry room, a rare find, complete with built-in shelving, butcher block countertops, and room for full size appliances. Additional storage has also been added to the exterior. Step outside to a covered porch perfect for relaxing, with a well-kept yard and carport. All of this just a short walk to the community pool, jacuzzi, recreation area, and community center. This is an exceptional opportunity for first-time buyers or those looking to downsize without sacrificing comfort or style.
Key facts
- Community pool
- Built 1981
- Listed 62 days
Neighborhood map
What this means for you Summary
Snapshot
- This is a 3-bed/2.0-bath manufactured listed at $150k.
Deal economics
- At list price, monthly cash flow is $2k ($21k/yr) — positive.
- The deal already cash-flows at list — no discount required.
- Meets the 1% rule at list price ($4k rent vs $150k).
- Recommended offer: $141k (6.0% below list) — sets the bar for market timing.
- Cap rate 20.3% vs local median 2.7% in Ontario — top-decile yield for the area; either an underpriced asset or a hidden risk that comps aren't pricing in. Stress-test before assuming the spread holds.
Location & tenants
- Location reads 63/100 on livability (#435 in CA) — a middle-class / working-renter tenant base. Strengths: commute A-, housing B+; Watch: cost of living F, health & safety F.
- Chino Valley Unified (suburban): math 46% / reading 58% proficiency, ranked #334 of 1,400 in CA (top 24%) — acceptable for families but not a draw, mixed tenant base, ~2y average lease.
- Zoned schools: Lyle S. Briggs Fundamental (644 students, 68% FRL); Woodcrest Junior High (math 10% / reading 10%, grade F, #474 of 498 statewide, top 99%, 334 students, 84% FRL); Chino High (1,900 students, 77% FRL) — zoned schools average 76% FRL vs 37% district-wide (40 pts higher); higher-poverty schools than district average — tighter screening recommended.
- Zoned-school proficiency averages 10% at this address vs 52% district-wide (-42 pts) — the specific schools serving this property underperform the Chino Valley Unified average; the district grade overstates school quality for this exact location.
- Market conditions: Rents rising (+2.4%/yr); 321 active listings in the ZIP; 10 comparable units currently listed for rent nearby; rentals leasing fast (median 0d on market — plan ~1-2 weeks tenant-placement turnaround); solid renter incomes; 5,458 units permitted in San Bernardino County in 2024 (1,500 in 5+ unit buildings).
- This rent runs 42% of the median local income ($101k/yr) — at the standard rent-burdened threshold; future hikes will face affordability resistance.
Forward outlook
- Local home prices are declining (-3.0%/yr); year-one equity from $1k of loan paydown is wiped out by about $4k of value loss. Plan a longer hold.
- San Bernardino County population projected at +15% by 2050 — modest demand growth; plan on rents tracking national, not racing it.
- At projected returns (-3.0% appreciation + 2.4% rent growth), your $42k cash investment doubles in ~3 years — after that, you're playing with house money.
Negotiation context
- It's been on market 62 days — a 6% lower offer ($141k) is reasonable based on typical stale-listing flexibility.
Risks & watch-outs
- Climate carrying-cost: extreme-heat days projected 7→18/yr by 2055 (HVAC capex compounding) — expect insurance premiums to compound above CPI over the hold.
Questions for the listing agent
- It's been on market 62 days. Have you received any prior offers? Is the seller open to a 6% concession, seller financing, or rate buy-down credit?
- Why hasn't it sold? Are there any deal-killer items the seller is aware of (foundation, flood, title, zoning, code violations)?
- Is there a deadline driving the sale (1031 exchange, divorce, estate, relocation)? That informs how much negotiation room exists.
- Schools are F-rated, which usually means shorter tenancies and higher turnover. Who's the typical renter profile here, and what's been the actual vacancy rate?
- What's the average days-on-market for RENTAL listings here right now (not sales)? A rising rental-DOM trend means longer vacancies and softer asking-rent achievability than the comps imply.
- What's the recent tenant-quality profile in this submarket — average credit score on applications, eviction rate, late-payment / NSF rate, and stable-employment percentage? A property-management company in the area should have these aggregated.
- How much new for-sale + rental construction is in the pipeline within 1–3 miles? Heavy new supply typically softens prices + rents 12–24 months out; constrained supply supports both.
Investment metrics
- 1% rule
- 2.35% ✓
- Cap rate
- 20.30%
- Cash-on-cash
- 50.02%
- DSCR
- 3.23
- GRM
- 3.5
CMA / ARV
- ARV (median comp)
- $105,856
- List price
- $150,000
- Delta
- 41.70%
- Verdict
- OVERPRICED
- Comps
- 10 within 1.0 mi
Show comp detail 12 sales within ~0.75 mi
| Address | Dist | Beds/Ba | Sqft | Sold | Price | $/sf | Match |
|---|---|---|---|---|---|---|---|
| 1855 E Riverside Dr #155 | 0.00mi | 3/2.0 | 1,344 (0%) | 15mo | $100,000 | $74 | 88 |
| 1855 Riverside Dr E #128 | 0.00mi | 3/2.0 | 1,260 (-6%) | 6mo | $85,000 | $67 | 85 |
| 1855 E Riverside Dr #110 | 0.00mi | 3/2.0 | 1,272 (-5%) | 9mo | $100,000 | $79 | 84 |
| 1855 E Riverside Dr #293 | 0.00mi | 3/2.0 | 1,440 (+7%) | 5mo | $117,000 | $81 | 84 |
| 1855 E Riverside Dr #348 | 0.00mi | 3/2.0 | 1,272 (-5%) | 10mo | $145,000 | $114 | 82 |
| 1855 E Riverside Dr #232 | 0.00mi | 3/2.0 | 1,272 (-5%) | 12mo | $102,000 | $80 | 81 |
| 1855 E Riverside Dr #266 | 0.06mi | 3/2.0 | 1,440 (+7%) | 9mo | $115,000 | $80 | 78 |
| 1855 E Riverside Dr #9 | 0.00mi | 3/2.0 | 1,176 (-12%) | 6mo | $116,300 | $99 | 74 |
| 1855 E Riverside Dr #133 | 0.00mi | 3/2.0 | 1,176 (-12%) | 8mo | $98,100 | $83 | 72 |
| 1855 RIVERSIDE Dr #43 | 0.00mi | 4/2.0 (+1) | 1,456 (+8%) | 14mo | $95,000 | $65 | 70 |
| 1855 E Riverside Dr #229 | 0.00mi | 4/2.0 (+1) | 1,512 (+12%) | 14mo | $115,000 | $76 | 62 |
| 1855 E Riverside Dr #370 | 0.16mi | 3/2.0 | 1,152 (-14%) | 16mo | $85,000 | $74 | 55 |
Match score weights: distance 35% · size 25% · config 20% · recency 20%. Top-matched comps best support the ARV.
Projected returns pro-forma
-3.0% appreciation · 2.39% rent growth · sell at horizon
- IRR
- 47.0%
- Equity multiple
- 3.03×
- Total profit
- $85,107
- Equity at exit
- $22,365
- IRR
- 52.5%
- Equity multiple
- 5.98×
- Total profit
- $209,191
- Equity at exit
- $12,969
Cash invested: $42,000 (down + closing). Projections, not guarantees.
Landlord ↔ Tenant lean methodology
- Overall (STATE)
- 18 Strongly Tenant-Friendly
- State California
- 18 Strongly Tenant-Friendly · D+13
- County
- — inherits STATE
- City
- — inherits STATE
ZIP-level market 91761
- Rents YoY
- 2.4%
- Active inventory
- 321
- Price-to-rent
- 3.5×
Monthly cashflow live
- Estimated rent
- $3,528 high interval (Pro) →
- Mortgage (P&I)
- −$787
- Tax est. 1.5%
- −$188 /mo · $2,250/yr
- Insurance
- −$62
- HOA
- −$0
- Vacancy / Maint / Mgmt
- −$741
- Net cashflow
- $1,751
Break-even live
Sensitivity live
| Price | -10% $1,855 | -5% $1,803 | +0% $1,751 | +5% $1,699 | +10% $1,647 |
|---|---|---|---|---|---|
| Rent | -10% $1,472 | -5% $1,611 | +0% $1,751 | +5% $1,890 | +10% $2,030 |
| Rate | -1.0pp $1,826 | -0.5pp $1,789 | base $1,751 | +0.5pp $1,712 | +1.0pp $1,672 |
UW: 25.0% down · 7.5% · 30yr · 1.5% tax · 5.0% vac · 8.0% maint · 8.0% mgmt
Financing live
Cash to close
- Down payment
- $37,500
- Closing costs
- $4,500
- Reserves months
- —
- Total cash needed
- —
Loan-product check · same deal, 3 products live
Conventional
25% down · 7.5% · 30yr
- Down + closing
- —
- Monthly P&I
- —
- Monthly cashflow
- —
- DSCR
- —
- Eligible?
- —
Personal DTI + credit; lowest rate.
DSCR
20% down · 8.5% · 30yr
- Down + closing
- —
- Monthly P&I
- —
- Monthly cashflow
- —
- DSCR
- —
- Eligible?
- —
No personal income docs; deal must DSCR.
Hard money
10% down · 12.0% · 12mo
- Down + closing
- —
- Monthly P&I
- —
- Monthly cashflow
- —
- DSCR
- —
- Eligible?
- —
Short-term bridge; refi at stabilization.
Rent comps 10 comps
| Address | Beds | Baths | Sqft | Rent | $/sqft | DOM | Units | Dist |
|---|---|---|---|---|---|---|---|---|
| 2815 S Augusta Ave Ontario, CA | 4.0 | 2.0 | 1524 | $3,600 | $2.36 | 0d | 1 | 0.32mi |
| 2714 S Pebble Beach Ct Ontario, CA | 4.0 | 2.0 | 1318 | $3,500 | $2.66 | 0d | 1 | 0.34mi |
| 2509 E Canterbury Trl Unit NA Ontario, CA | 3.0 | 2.0 | 1500 | $4,300 | $2.87 | 0d | 1 | 0.93mi |
| 2550 E Riverside Dr Ontario, CA | 1.0–2.0 | 1.0–2.0 | 835 | $2,795 | $3.35 | 1d | 8 | 1.03mi |
| 2631 S Cucamonga Ave Ontario, CA | 3.0 | 2.5 | 1726 | $3,400 | $1.97 | 45d | 1 | 1.15mi |
| 1110 E Philadelphia St Ontario, CA | 1.0–2.0 | 1.0–2.0 | 904 | $3,207 | $3.55 | 0d | 13 | 1.27mi |
| 3303 S Archibald Ave Ontario, CA | 1.0–2.0 | 1.0–2.0 | 877 | $2,831 | $3.23 | 0d | 27 | 1.29mi |
| 2432 S Garfield Pl Ontario, CA | 3.0 | 2.0 | 1118 | $3,150 | $2.82 | 0d | 1 | 1.36mi |
| 2652 S Arcadian Shores Rd Ontario, CA | 4.0 | 2.0 | 1520 | $3,900 | $2.57 | 14d | 1 | 1.42mi |
| 2686 Dolomite St Ontario, CA | 3.0 | 2.5 | 1800 | $5,000 | $2.78 | 0d | 1 | 1.46mi |
Listing history 16 events
-
2026-06-21days on market $150,000 Active 62 DOM
-
2026-06-18days on market $150,000 Active 59 DOM
-
2026-06-17days on market $150,000 Active 58 DOM
-
2026-06-16days on market $150,000 Active 57 DOM
-
2026-06-15days on market $150,000 Active 56 DOM
-
2026-06-13days on market $150,000 Active 54 DOM
-
2026-06-09days on market $150,000 Active 50 DOM
-
2026-06-08days on market $150,000 Active 49 DOM
-
2026-06-07days on market $150,000 Active 48 DOM
-
2026-06-04days on market $150,000 Active 45 DOM
-
2026-06-03days on market $150,000 Active 44 DOM
-
2026-06-02days on market $150,000 Active 43 DOM
-
2026-06-01days on market $150,000 Active 42 DOM
-
2026-05-31days on market $150,000 Active 41 DOM
-
2026-04-20$150,000 Active 1510-char remark
Show marketing remark (1510 chars)
Welcome to this beautifully updated 3-bedroom, 2-bathroom home offering 1,344 sq ft of thoughtfully renovated living space in a well maintained all age community. From the moment you step inside, you'll notice the attention to detail, fresh tile flooring flows throughout, complemented by recessed lighting, ceiling fans, and a bright, open feel that makes every room feel larger than it is. The spacious open concept living area connects seamlessly to a fully updated kitchen featuring new countertops, a striking stainless range hood, and ample cabinetry, perfect for cooking and entertaining. A separate dining area adds functionality and charm. The primary suite offers a private en suite bathroom, providing a true retreat at the end of the day. Two additional bedrooms offer flexibility for family, guests, or a home office. Both bathrooms have been updated and the home features newly updated plumbing and HVAC throughout, giving buyers true peace of mind. One of the standout features is the dedicated interior laundry room, a rare find, complete with built-in shelving, butcher block countertops, and room for full size appliances. Additional storage has also been added to the exterior. Step outside to a covered porch perfect for relaxing, with a well-kept yard and carport. All of this just a short walk to the community pool, jacuzzi, recreation area, and community center. This is an exceptional opportunity for first-time buyers or those looking to downsize without sacrificing comfort or style.
-
2026-04-17historical $150,000 1510-char remark
Show marketing remark (1510 chars)
Welcome to this beautifully updated 3-bedroom, 2-bathroom home offering 1,344 sq ft of thoughtfully renovated living space in a well maintained all age community. From the moment you step inside, you'll notice the attention to detail, fresh tile flooring flows throughout, complemented by recessed lighting, ceiling fans, and a bright, open feel that makes every room feel larger than it is. The spacious open concept living area connects seamlessly to a fully updated kitchen featuring new countertops, a striking stainless range hood, and ample cabinetry, perfect for cooking and entertaining. A separate dining area adds functionality and charm. The primary suite offers a private en suite bathroom, providing a true retreat at the end of the day. Two additional bedrooms offer flexibility for family, guests, or a home office. Both bathrooms have been updated and the home features newly updated plumbing and HVAC throughout, giving buyers true peace of mind. One of the standout features is the dedicated interior laundry room, a rare find, complete with built-in shelving, butcher block countertops, and room for full size appliances. Additional storage has also been added to the exterior. Step outside to a covered porch perfect for relaxing, with a well-kept yard and carport. All of this just a short walk to the community pool, jacuzzi, recreation area, and community center. This is an exceptional opportunity for first-time buyers or those looking to downsize without sacrificing comfort or style.
ⓘ Source: listings_history table (triggers on properties + properties_extension) + one-shot
backfill from property_details.listing_events for pre-trigger history.
Climate risk First Street
- Flood 1/10 Low FEMA zone X (shaded) · 0% chance over 30 yrs
- Wildfire 3/10 Moderate
- Heat 8/10 Severe 7 d/yr ≥101°F today · 18 d/yr by 30 yrs out
- Wind 1/10 Low
- Air quality 9/10 Extreme 23 unhealthy d/yr today · 26 by 30 yrs out
Nearby sold comps map
Loading sold comps map…
Walkable amenities ~0.75 mi
Loading nearby amenities…
Taxation est. · year 1
- Rental income
- $42,341
- − Mortgage interest
- −$8,402
- − Property taxes
- −$2,250
- − Insurance
- −$750
- − Repairs & maintenance
- −$3,387
- − Management
- −$3,387
- − Depreciation
- −$4,364
- Taxable income
- $19,801
- Est. tax owed @ 24.0%
- −$4,752
- After-tax cash flow
- $16,258/yr
For passive investors: Depreciation is non-cash, so a rental often shows a tax loss while cash-flowing — sheltering income. Rental losses are passive: they offset passive income freely, and up to $25,000/yr can offset ordinary (W-2) income if you actively participate and your MAGI is under $100k (phasing out to $0 by $150k); unused losses carry forward. On sale, claimed depreciation is recaptured at up to 25%, and gains may owe capital-gains tax (a 1031 exchange can defer both). Figures are a year-1 estimate at your 24.0% rate — not tax advice; consult a CPA.
Schools (NCES district)
- District
- Chino Valley Unified
- NCES district ID
- 0608460
- Math proficiency
- 46% ▲ 1.00%
- Reading proficiency
- 58% ▲ 1.00%
- Median HH income
- $83,575
- Composite
- 49.56/100
- National rank
- #4275
- State rank
- #334 of 1400 in CA
Livability — Ontario
- Score
- 63/100
- State rank
- #435
- US rank
- #14949
Category grades
Schools grade is shown separately in the Schools card above.
Census & demographics
- Census place
- Ontario, CA
- County
- San Bernardino County · 2,030,291 people
- City population
- 183,440
- Metro
- Riverside-San Bernardino-Ontario, CA
- Population (ZIP)
- 62,935
- Household income
- $100,578
- Rent vs Own
- Severe rent burden
- 1853.0
Population outlook (San Bernardino County) Hauer SSP2
- Today (2025)
- 2,300,329 people
- By 2030
- 2,378,907 · +3.4%
- By 2040
- 2,523,137 · +9.7%
- By 2050
- 2,642,388 · +14.9%
- By 2075
- 2,880,769 · +25.2%
- By 2100
- 2,909,436 · +26.5%
Race, ethnicity, and origin ACS 2023
- Neighborhood character
- Predominantly Hispanic (66%)
- Race & ethnicity
- Hispanic / Latino 66% Two or more races 23% White 15% Asian 9% Black 6% Native American 2%
- Hispanic origin (detail)
- Mexican 59%
- Common ancestry
- Iranian 1% Lithuanian 1% Italian 1%
- Foreign-born
- 24% · Canada, China, Vietnam
- Languages at home
- 51% English-only · Spanish 41% Chinese 3% Tagalog/Filipino 1%
Political lean MEDSL · San Bernardino
- 2024 margin
- Toss-up / Even · D 47.5% · R 49.7% · Other 2.8%
- 2008→2024 swing
- -8.5pp toward R · 2008: 6.3pp · 2024: -2.1pp
- All cycles
- 2024: R+2.1 2020: D+10.7 2016: D+9.8 2012: D+5.4 2008: D+6.3
Not yet ingested
- Civics
- —
Market trends
- HPI YoY
- ▼ -374.91%
- Current HPI
- 400.5674
- Rent YoY
- ▲ 2.39%
- Metro
- Riverside-San Bernardino-Ontario, CA
- State GDP YoY
- ▲ 3.21%
- F500 in state
- 116
Industry mix (Fortune 500 HQ in CA)
| Industry | F500 HQs | Revenue |
|---|---|---|
| Technology | 27 | $1,492B |
|
||
| Financial Services | 3 | $174B |
|
||
| Retail | 3 | $44B |
|
||
| Insurance | 3 | $26B |
|
||
| Media / Entertainment | 2 | $115B |
|
||
| Pharmaceuticals / Biotech | 2 | $62B |
|
||
Price history
+0.0% since first listed2 events — show timeline
- 2026-04-20 Listed $150,000 CRMLS
- 2026-04-17 Coming Soon $150,000 CRMLS
Property tax history
-7.0%/yrLatest (2025): $55 · +0.7% YoY. Source: county tax records.
Cash-flow waterfall
monthlySold comps — $/sqft
last 12 mo · ≤1 miLoading sold comps…