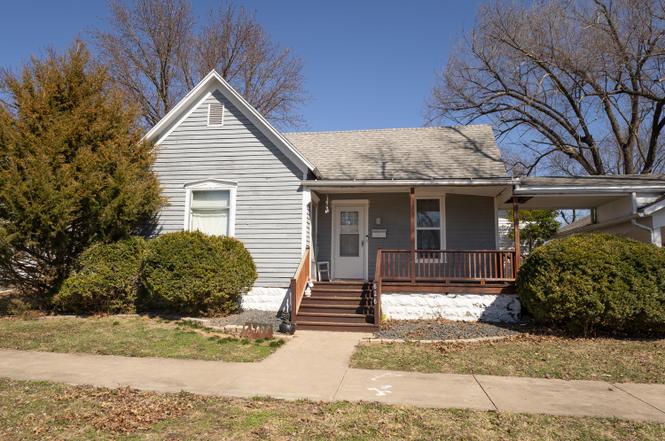
626 Crosby St · Brookfield, MO
Flood risk 1/10 · Minimal
- FEMA flood zone
- X (unshaded)
- Chance of flooding over 30 yrs
- 0.0%
- Est. flood insurance / yr
- $473 – $860
Fire risk 3/10 · Minor
- Est. fire insurance / yr
- $1,054 – $1,958
Heat risk 3/10 · Minor
- Hot days now (above 106°F)
- 7 days/yr
- Hot days in 30 yrs
- 16 days/yr
Wind risk 2/10 · Minimal
- Chance of severe wind over 30 yrs
- —
Air-quality risk 1/10 · Minimal
- Unhealthy air days now
- 0 days/yr
- Unhealthy air days in 30 yrs
- 0 days/yr
Risk factors via First Street. Map © Google.
Why this score? — see what drove the A- grade
The composite is a weighted blend of 9 inputs, each scored 0–100. Each bar is that input's sub-score; the figure is the points it added to the 100-point composite (weight × sub-score).
- Cash flow +30.0/30.0
- ARV discount +15.0/15.0
- 1% rule +10.0/10.0
- DSCR +10.0/10.0
- Appreciation +6.5/10.0
- Schools +4.2/10.0
- Livability +3.2/5.0
- Rent growth +2.5/5.0
- Condition / age +2.5/5.0
$59,000
🖨 Deal sheet (PDF) 📄 Offer letter ✓ Due diligence
Listing remarks
Charming single-family home located in a quiet residential neighborhood in Brookfield. This property offers a great opportunity for homeowners or investors looking for an affordable home with potential. The home features approximately 1,118 square feet of living space, with 2 bedrooms and 1 bathroom, offering a practical layout for everyday living. Built around the early 1880s, the home reflects classic small-town character while providing a comfortable living environment. The property sits on a residential lot with room for outdoor living, gardening, or additional improvements. The surrounding area includes similar historic homes and provides easy access to schools, local businesses, and d
Key facts
- Local businesses
- 7,841 sq ft lot
- Garage
Tags
Neighborhood map
What this means for you Summary
Snapshot
- This is a 3-bed/1.0-bath single-family listed at $59k.
Deal economics
- At list price, monthly cash flow is $413 ($5k/yr) — positive.
- The deal already cash-flows at list — no discount required.
- Meets the 1% rule at list price ($971 rent vs $59k).
Location & tenants
- Location reads 65/100 on livability (#278 in MO) — a middle-class / working-renter tenant base. Strengths: crime A+, cost of living A+, housing A+; Watch: employment D+, schools D, amenities F.
- Brookfield R-III (rural): math 46% / reading 55% proficiency, ranked #45 of 324 in MO (top 14%) — acceptable for families but not a draw, mixed tenant base, ~2y average lease.
- Market conditions: 41 active listings in the ZIP; 4 units permitted in Linn County in 2024 (0 in 5+ unit buildings).
Forward outlook
- In year one you build about $2k of equity ($408 loan paydown + $2k appreciation (2.9% local appreciation)).
- Linn County population projected at -21% by 2050 — secular population decline; favor cash flow + early exit over multi-decade hold.
- At projected returns (2.9% appreciation + 3.0% rent growth), your $17k cash investment doubles in ~3 years — after that, you're playing with house money.
Negotiation context
- Only 14 days on market — expect competitive offers; lowballing is unlikely to land.
- Current owner paid $20k; list at $59k implies a 195% gain — meaningful room to come down on a strong offer.
Risks & watch-outs
- Watch-outs: built in 1880 — expect roof / HVAC / electrical / plumbing capex.
Questions for the listing agent
- Built in 1880 — when were the roof, HVAC, electrical panel, plumbing, and water heater last replaced?
- Is there a deadline driving the sale (1031 exchange, divorce, estate, relocation)? That informs how much negotiation room exists.
- Schools are D-rated, which usually means shorter tenancies and higher turnover. Who's the typical renter profile here, and what's been the actual vacancy rate?
- What's the average days-on-market for RENTAL listings here right now (not sales)? A rising rental-DOM trend means longer vacancies and softer asking-rent achievability than the comps imply.
- What's the recent tenant-quality profile in this submarket — average credit score on applications, eviction rate, late-payment / NSF rate, and stable-employment percentage? A property-management company in the area should have these aggregated.
- How much new for-sale + rental construction is in the pipeline within 1–3 miles? Heavy new supply typically softens prices + rents 12–24 months out; constrained supply supports both.
Investment metrics
- 1% rule
- 1.65% ✓
- Cap rate
- 14.69%
- Cash-on-cash
- 29.98%
- DSCR
- 2.33
- GRM
- 5.1
CMA / ARV
- ARV (on-the-fly)
- $72,670
- Comps found
- 3
Show comp detail 3 sales within ~0.75 mi
| Address | Dist | Beds/Ba | Sqft | Sold | Price | $/sf | Match |
|---|---|---|---|---|---|---|---|
| 417 Laclede Ave | 0.21mi | 2/1.0 (-1) | 1,040 (-7%) | 3mo | $68,000 | $65 | 71 |
| 215 Market St | 0.74mi | 2/1.0 (-1) | 1,067 (-5%) | 10mo | $34,900 | $33 | 45 |
| 1301 N Main St | 0.51mi | 2/2.5 (-1) | 1,229 (+10%) | 13mo | $128,900 | $105 | 38 |
Match score weights: distance 35% · size 25% · config 20% · recency 20%. Top-matched comps best support the ARV.
Projected returns pro-forma
2.91% appreciation · 3.0% rent growth · sell at horizon
- IRR
- 35.7%
- Equity multiple
- 3.00×
- Total profit
- $33,079
- Equity at exit
- $26,215
- IRR
- 35.9%
- Equity multiple
- 5.92×
- Total profit
- $81,272
- Equity at exit
- $40,159
Cash invested: $16,520 (down + closing). Projections, not guarantees.
Landlord ↔ Tenant lean methodology
- Overall (STATE)
- 81 Strongly Landlord-Friendly
- State Missouri
- 81 Strongly Landlord-Friendly · R+10
- County
- — inherits STATE
- City
- — inherits STATE
ZIP-level market 64628
- Home prices YoY
- 1.3%
- Active inventory
- 41
- Price-to-rent
- 5.1×
Monthly cashflow live
- Estimated rent
- $971 medium interval (Pro) →
- Mortgage (P&I)
- −$309
- Tax from tax record
- −$20 /mo · $244/yr
- Insurance
- −$25
- HOA
- −$0
- Vacancy / Maint / Mgmt
- −$204
- Net cashflow
- $413
Break-even live
Sensitivity live
| Price | -10% $446 | -5% $429 | +0% $413 | +5% $396 | +10% $379 |
|---|---|---|---|---|---|
| Rent | -10% $336 | -5% $374 | +0% $413 | +5% $451 | +10% $489 |
| Rate | -1.0pp $442 | -0.5pp $428 | base $413 | +0.5pp $397 | +1.0pp $382 |
UW: 25.0% down · 7.5% · 30yr · 1.5% tax · 5.0% vac · 8.0% maint · 8.0% mgmt
Financing live
Cash to close
- Down payment
- $14,750
- Closing costs
- $1,770
- Reserves months
- —
- Total cash needed
- —
Loan-product check · same deal, 3 products live
Conventional
25% down · 7.5% · 30yr
- Down + closing
- —
- Monthly P&I
- —
- Monthly cashflow
- —
- DSCR
- —
- Eligible?
- —
Personal DTI + credit; lowest rate.
DSCR
20% down · 8.5% · 30yr
- Down + closing
- —
- Monthly P&I
- —
- Monthly cashflow
- —
- DSCR
- —
- Eligible?
- —
No personal income docs; deal must DSCR.
Hard money
10% down · 12.0% · 12mo
- Down + closing
- —
- Monthly P&I
- —
- Monthly cashflow
- —
- DSCR
- —
- Eligible?
- —
Short-term bridge; refi at stabilization.
Listing history 4 events
-
2026-04-14status Pending
-
2026-03-11$59,000 Active
-
2008-09-10soldstatus $20,000
-
1995-11-10soldstatus
ⓘ Source: listings_history table (triggers on properties + properties_extension) + one-shot
backfill from property_details.listing_events for pre-trigger history.
Tax reassessment forecast MO · Resets to sale price
- Current annual tax
- $244 · $20/mo
- Projected year-2 tax
- $572 · $48/mo
- Expected delta
- +$329/yr (+$27/mo · 134.8%)
ⓘ Screening estimate from a state-policy table — verify with the county assessor before closing.
Climate risk First Street
- Flood 1/10 Low FEMA zone X (unshaded) · 0% chance over 30 yrs
- Wildfire 3/10 Moderate
- Heat 3/10 Moderate 7 d/yr ≥106°F today · 16 d/yr by 30 yrs out
- Wind 2/10 Low
- Air quality 1/10 Low 0 unhealthy d/yr today · 0 by 30 yrs out
Nearby sold comps map
Loading sold comps map…
Walkable amenities ~0.75 mi
Loading nearby amenities…
Taxation est. · year 1
- Rental income
- $11,650
- − Mortgage interest
- −$3,305
- − Property taxes
- −$244
- − Insurance
- −$295
- − Repairs & maintenance
- −$932
- − Management
- −$932
- − Depreciation
- −$1,716
- Taxable income
- $4,226
- Est. tax owed @ 24.0%
- −$1,014
- After-tax cash flow
- $3,938/yr
For passive investors: Depreciation is non-cash, so a rental often shows a tax loss while cash-flowing — sheltering income. Rental losses are passive: they offset passive income freely, and up to $25,000/yr can offset ordinary (W-2) income if you actively participate and your MAGI is under $100k (phasing out to $0 by $150k); unused losses carry forward. On sale, claimed depreciation is recaptured at up to 25%, and gains may owe capital-gains tax (a 1031 exchange can defer both). Figures are a year-1 estimate at your 24.0% rate — not tax advice; consult a CPA.
Schools (NCES district)
- District
- Brookfield R-III
- NCES district ID
- 2905940
- Math proficiency
- 46% ▼ -1.00%
- Reading proficiency
- 55% ▲ 4.00%
- Median HH income
- $37,022
- Composite
- 41.93/100
- National rank
- #3355
- State rank
- #45 of 324 in MO
Livability — Brookfield
- Score
- 65/100
- State rank
- #278
- US rank
- #13057
Category grades
Schools grade is shown separately in the Schools card above.
Census & demographics
- Census place
- Brookfield, MO
- Population (ZIP)
- 5,602
Population outlook (Linn County) Hauer SSP2
- Today (2025)
- 11,437 people
- By 2030
- 10,946 · -4.3%
- By 2040
- 9,969 · -12.8%
- By 2050
- 9,056 · -20.8%
- By 2075
- 7,342 · -35.8%
- By 2100
- 5,656 · -50.5%
Race, ethnicity, and origin ACS 2023
- Neighborhood character
- Predominantly White (93%)
- Race & ethnicity
- White 93% Two or more races 4% Hispanic / Latino 3%
- Common ancestry
- Lithuanian 2% Serbian 1% Italian 1%
- Foreign-born
- 1% · Canada
Political lean MEDSL · Linn
- 2024 margin
- Solid R (+57.2) · D 20.8% · R 78.1% · Other 1.1%
- 2008→2024 swing
- -48.8pp toward R · 2008: -8.5pp · 2024: -57.2pp
- All cycles
- 2024: R+57.2 2020: R+53.9 2016: R+51.1 2012: R+23.5 2008: R+8.5
Not yet ingested
- Civics
- —
Market trends
- HPI YoY
- ▲ 2.91%
- Current HPI
- 219.7856
- Rent YoY
- —
- Metro
- —
- State GDP YoY
- ▲ 1.84%
- F500 in state
- 20
Industry mix (Fortune 500 HQ in MO)
| Industry | F500 HQs | Revenue |
|---|---|---|
| Healthcare | 1 | $163B |
|
||
| Insurance | 1 | $21B |
|
||
| Industrial Technology | 1 | $17B |
|
||
| Retail | 1 | $16B |
|
||
| Industrial Distribution | 1 | $10B |
|
||
| Utilities | 1 | $9B |
|
||
Price history
+195.0% since first listed4 events — show timeline
- 2026-04-14 Pending — RCBR
- 2026-03-11 Listed $59,000 RCBR
- 2008-09-10 Sold (Public Records) $20,000 Public Records
- 1995-11-10 Sold (Public Records) — Public Records
Property tax history
+0.9%/yrLatest (2025): $244 · +4.0% YoY. Source: county tax records.
Cash-flow waterfall
monthlySold comps — $/sqft
last 12 mo · ≤1 miLoading sold comps…