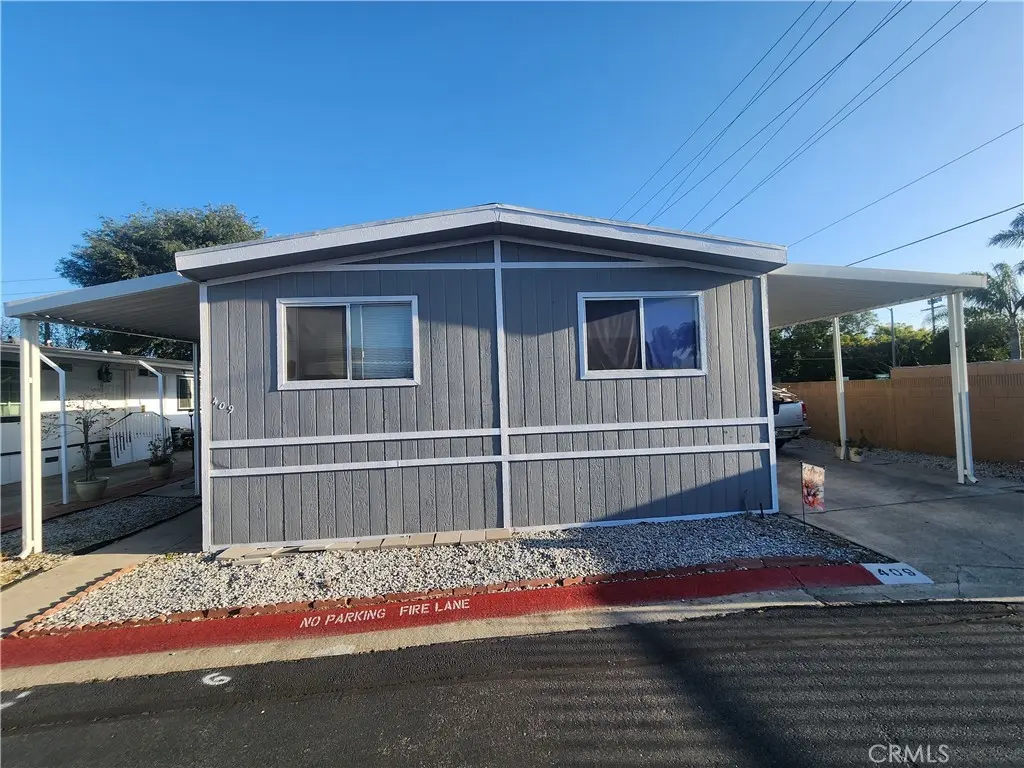
1855 E Riverside Dr #409 · Ontario, CA
Flood risk 1/10 · Minimal
- FEMA flood zone
- X (shaded)
- Chance of flooding over 30 yrs
- 0.0%
- Est. flood insurance / yr
- $507 – $1,088
Fire risk 3/10 · Minor
- Est. fire insurance / yr
- $659 – $1,223
Heat risk 8/10 · Major
- Hot days now (above 101°F)
- 7 days/yr
- Hot days in 30 yrs
- 18 days/yr
Wind risk 1/10 · Minimal
- Chance of severe wind over 30 yrs
- —
Air-quality risk 9/10 · Severe
- Unhealthy air days now
- 23 days/yr
- Unhealthy air days in 30 yrs
- 26 days/yr
Risk factors via First Street. Map © Google.
Why this score? — see what drove the B grade
The composite is a weighted blend of 9 inputs, each scored 0–100. Each bar is that input's sub-score; the figure is the points it added to the 100-point composite (weight × sub-score).
- Cash flow +30.0/30.0
- ARV discount +10.7/15.0
- 1% rule +10.0/10.0
- DSCR +10.0/10.0
- Schools +5.0/10.0
- Livability +3.2/5.0
- Rent growth +3.1/5.0
- Condition / age +2.5/5.0
- Appreciation +0.0/10.0
$98,450
🖨 Deal sheet 📄 Offer letter ✓ Due diligence
Listing remarks
A cozy starter 4beds/2baths manufactured home built in 1982. A corner unit with long deep covered carport/driveway. Conveniently located, close to freeways, shopping centers, schools, park, golf course and across from the up and coming stadium.
Key facts
- Close to schools
- Close to freeways
- Covered carport
Tags
Property features AI
Finance
- HOA & community: Land lease community; Monthly land lease of $2,130.33 (seller-provided)
Exterior
- Parking: Located in Country Meadows park
- Utilities: Public sewer; District/public water; Natural gas connected; Electricity connected; Water connected
- Home design: Manufactured/mobile home (24' x 52'); Single-story; Model SM7A7; Mobile home remains on property
- Construction: Year built per builder
- Exterior features: Community pool; Corner lot; Sidewalks (community)
Interior
- Bedrooms: All bedrooms on the main level
- Flooring: Vinyl flooring; Laminate flooring
- Bathrooms: 1 full bathroom; 1 three-quarter bathroom
- Interior features: One-level home; Side entry
- Laundry & utility: Inside laundry; Washer hookup; Gas dryer hookup
Neighborhood map
What this means for you Summary
Snapshot
- This is a 2-bed/2.0-bath manufactured listed at $98k.
Deal economics
- At list price, monthly cash flow is $2k ($19k/yr) — positive.
- The deal already cash-flows at list — no discount required.
- Meets the 1% rule at list price ($3k rent vs $98k).
- Recommended offer: $95k (3.0% below list) — sets the bar for market timing.
- Cap rate 25.2% vs local median 2.7% in Ontario — top-decile yield for the area; either an underpriced asset or a hidden risk that comps aren't pricing in. Stress-test before assuming the spread holds.
Location & tenants
- Location reads 63/100 on livability (#435 in CA) — a middle-class / working-renter tenant base. Strengths: commute A-, housing B+; Watch: schools F, cost of living F, health & safety F.
- Chino Valley Unified (suburban): math 46% / reading 58% proficiency, ranked #334 of 1,400 in CA (top 24%) — acceptable for families but not a draw, mixed tenant base, ~2y average lease.
- Market conditions: Rents rising (+2.4%/yr); 314 active listings in the ZIP; 5 comparable units currently listed for rent nearby; rentals leasing fast (median 2d on market — plan ~1-2 weeks tenant-placement turnaround); solid renter incomes; 5,458 units permitted in San Bernardino County in 2024 (1,500 in 5+ unit buildings).
- This rent runs 34% of the median local income ($101k/yr) — at the standard rent-burdened threshold; future hikes will face affordability resistance.
Forward outlook
- Local home prices are declining (-3.0%/yr); year-one equity from $680 of loan paydown is wiped out by about $3k of value loss. Plan a longer hold.
- San Bernardino County population projected at +15% by 2050 — modest demand growth; plan on rents tracking national, not racing it.
- At projected returns (-3.0% appreciation + 2.4% rent growth), your $28k cash investment doubles in ~2 years — after that, you're playing with house money.
Negotiation context
- It's been on market 49 days — a 3% lower offer ($95k) is reasonable based on typical stale-listing flexibility.
- 2 sale attempts with the ask held roughly flat each time — persistent listings suggest the price (not the market) is what's stuck; bring a comps-based counter.
Risks & watch-outs
- Climate carrying-cost: extreme-heat days projected 7→18/yr by 2055 (HVAC capex compounding) — expect insurance premiums to compound above CPI over the hold.
Questions for the listing agent
- It's been on market 49 days. Have you received any prior offers? Is the seller open to a 3% concession, seller financing, or rate buy-down credit?
- Is there a deadline driving the sale (1031 exchange, divorce, estate, relocation)? That informs how much negotiation room exists.
- Schools are F-rated, which usually means shorter tenancies and higher turnover. Who's the typical renter profile here, and what's been the actual vacancy rate?
- What's the average days-on-market for RENTAL listings here right now (not sales)? A rising rental-DOM trend means longer vacancies and softer asking-rent achievability than the comps imply.
- What's the recent tenant-quality profile in this submarket — average credit score on applications, eviction rate, late-payment / NSF rate, and stable-employment percentage? A property-management company in the area should have these aggregated.
- How much new for-sale + rental construction is in the pipeline within 1–3 miles? Heavy new supply typically softens prices + rents 12–24 months out; constrained supply supports both.
Investment metrics
- 1% rule
- 2.87% ✓
- Cap rate
- 25.23%
- Cash-on-cash
- 67.63%
- DSCR
- 4.01
- GRM
- 2.9
CMA / ARV
- ARV (median comp)
- $105,910
- List price
- $98,450
- Delta
- -7.04%
- Verdict
- FAIR
- Comps
- 10 within 1.0 mi
Show comp detail 12 sales within ~0.75 mi
| Address | Dist | Beds/Ba | Sqft | Sold | Price | $/sf | Match |
|---|---|---|---|---|---|---|---|
| 1855 Riverside Dr E #128 | 0.00mi | 3/2.0 (+1) | 1,260 (+1%) | 6mo | $85,000 | $67 | 88 |
| 1855 E Riverside Dr #110 | 0.00mi | 3/2.0 (+1) | 1,272 (+2%) | 9mo | $100,000 | $79 | 85 |
| 1855 E Riverside Dr #348 | 0.00mi | 3/2.0 (+1) | 1,272 (+2%) | 10mo | $145,000 | $114 | 83 |
| 1855 E Riverside Dr #232 | 0.00mi | 3/2.0 (+1) | 1,272 (+2%) | 12mo | $102,000 | $80 | 82 |
| 1855 E Riverside Dr #9 | 0.00mi | 3/2.0 (+1) | 1,176 (-6%) | 6mo | $116,300 | $99 | 80 |
| 1855 E Riverside Dr #133 | 0.00mi | 3/2.0 (+1) | 1,176 (-6%) | 8mo | $98,100 | $83 | 79 |
| 1855 E Riverside Dr #155 | 0.00mi | 3/2.0 (+1) | 1,344 (+8%) | 15mo | $100,000 | $74 | 70 |
| 1855 E Riverside Dr #347 | 0.00mi | 3/2.0 (+1) | 1,176 (-6%) | 20mo | $107,000 | $91 | 69 |
| 1855 E Riverside Dr #362 | 0.00mi | 3/2.0 (+1) | 1,352 (+8%) | 17mo | $105,000 | $78 | 67 |
| 1855 E Riverside Dr #185 | 0.00mi | 3/2.0 (+1) | 1,176 (-6%) | 22mo | $105,000 | $89 | 67 |
| 1855 E Riverside Dr #370 | 0.16mi | 3/2.0 (+1) | 1,152 (-8%) | 16mo | $85,000 | $74 | 62 |
| 1855 E Riverside Dr #394 | 0.16mi | 2/2.0 | 1,128 (-10%) | 22mo | $89,000 | $79 | 58 |
Match score weights: distance 35% · size 25% · config 20% · recency 20%. Top-matched comps best support the ARV.
Projected returns pro-forma
-3.0% appreciation · 2.39% rent growth · sell at horizon
- IRR
- 66.3%
- Equity multiple
- 3.95×
- Total profit
- $81,318
- Equity at exit
- $14,679
- IRR
- 70.4%
- Equity multiple
- 7.94×
- Total profit
- $191,409
- Equity at exit
- $8,512
Cash invested: $27,566 (down + closing). Projections, not guarantees.
Landlord ↔ Tenant lean methodology
- Overall (STATE)
- 18 Strongly Tenant-Friendly
- State California
- 18 Strongly Tenant-Friendly · D+13
- County
- — inherits STATE
- City
- — inherits STATE
ZIP-level market 91761
- Rents YoY
- 2.4%
- Active inventory
- 314
- Price-to-rent
- 2.9×
Monthly cashflow live
- Estimated rent
- $2,828 high interval (Pro) →
- Mortgage (P&I)
- −$516
- Tax est. 1.5%
- −$123 /mo · $1,477/yr
- Insurance
- −$41
- HOA
- −$0
- Vacancy / Maint / Mgmt
- −$594
- Net cashflow
- $1,554
Break-even live
UW: 25.0% down · 7.5% · 30yr · 1.5% tax · 5.0% vac · 8.0% maint · 8.0% mgmt
Financing live
Cash to close
- Down payment
- $24,612
- Closing costs
- $2,954
- Reserves months
- —
- Total cash needed
- —
Loan-product check · same deal, 3 products live
Conventional
25% down · 7.5% · 30yr
- Down + closing
- —
- Monthly P&I
- —
- Monthly cashflow
- —
- DSCR
- —
- Eligible?
- —
Personal DTI + credit; lowest rate.
DSCR
20% down · 8.5% · 30yr
- Down + closing
- —
- Monthly P&I
- —
- Monthly cashflow
- —
- DSCR
- —
- Eligible?
- —
No personal income docs; deal must DSCR.
Hard money
10% down · 12.0% · 12mo
- Down + closing
- —
- Monthly P&I
- —
- Monthly cashflow
- —
- DSCR
- —
- Eligible?
- —
Short-term bridge; refi at stabilization.
Rent comps 5 comps
| Address | Beds | Baths | Sqft | Rent | $/sqft | DOM | Units | Dist |
|---|---|---|---|---|---|---|---|---|
| 2550 E Riverside Dr Ontario, CA | 1.0–2.0 | 1.0–2.0 | 835 | $2,795 | $3.35 | 4d | 8 | 1.03mi |
| 1110 E Philadelphia St Ontario, CA | 1.0–2.0 | 1.0–2.0 | 904 | $3,207 | $3.55 | 1d | 12 | 1.27mi |
| 3303 S Archibald Ave Ontario, CA | 1.0–2.0 | 1.0–2.0 | 877 | $2,861 | $3.26 | 2d | 27 | 1.29mi |
| 2432 S Garfield Pl Ontario, CA | 3.0 | 2.0 | 1118 | $3,150 | $2.82 | 1d | 1 | 1.36mi |
| 1056 E Philadelphia St Ontario, CA | 1.0 | 1.0 | 688 | $2,465 | $3.58 | 1d | 1 | 1.40mi |
Listing history 15 events
-
2026-06-18days on market $98,450 Active 49 DOM
-
2026-06-17days on market $98,450 Active 48 DOM
-
2026-06-16days on market $98,450 Active 47 DOM
-
2026-06-15days on market $98,450 Active 46 DOM
-
2026-06-13days on market $98,450 Active 44 DOM
-
2026-06-09days on market $98,450 Active 40 DOM
-
2026-06-08days on market $98,450 Active 39 DOM
-
2026-06-07days on market $98,450 Active 38 DOM
-
2026-06-04days on market $98,450 Active 35 DOM
-
2026-06-03days on market $98,450 Active 34 DOM
-
2026-06-02days on market $98,450 Active 33 DOM
-
2026-06-01days on market $98,450 Active 32 DOM
-
2026-05-31days on market $98,450 Active 31 DOM
-
2026-05-02status Active 244-char remark
-
2026-04-29$98,450 Active 244-char remark
ⓘ Source: listings_history table (triggers on properties + properties_extension) + one-shot
backfill from property_details.listing_events for pre-trigger history.
Climate risk First Street
- Flood 1/10 Low FEMA zone X (shaded) · 0% chance over 30 yrs
- Wildfire 3/10 Moderate
- Heat 8/10 Severe 7 d/yr ≥101°F today · 18 d/yr by 30 yrs out
- Wind 1/10 Low
- Air quality 9/10 Extreme 23 unhealthy d/yr today · 26 by 30 yrs out
Nearby sold comps map
Loading sold comps map…
Walkable amenities ~0.75 mi
Loading nearby amenities…
Taxation est. · year 1
- Rental income
- $33,935
- − Mortgage interest
- −$5,515
- − Property taxes
- −$1,477
- − Insurance
- −$492
- − Repairs & maintenance
- −$2,715
- − Management
- −$2,715
- − Depreciation
- −$2,864
- Taxable income
- $18,157
- Est. tax owed @ 24.0%
- −$4,358
- After-tax cash flow
- $14,286/yr
For passive investors: Depreciation is non-cash, so a rental often shows a tax loss while cash-flowing — sheltering income. Rental losses are passive: they offset passive income freely, and up to $25,000/yr can offset ordinary (W-2) income if you actively participate and your MAGI is under $100k (phasing out to $0 by $150k); unused losses carry forward. On sale, claimed depreciation is recaptured at up to 25%, and gains may owe capital-gains tax (a 1031 exchange can defer both). Figures are a year-1 estimate at your 24.0% rate — not tax advice; consult a CPA.
Schools (NCES district)
- District
- Chino Valley Unified
- NCES district ID
- 0608460
- Math proficiency
- 46% ▲ 1.00%
- Reading proficiency
- 58% ▲ 1.00%
- Median HH income
- $83,575
- Composite
- 49.56/100
- National rank
- #4275
- State rank
- #334 of 1400 in CA
Livability — Ontario
- Score
- 63/100
- State rank
- #435
- US rank
- #14949
Category grades
Schools grade is shown separately in the Schools card above.
Census & demographics
- Census place
- Ontario, CA
- County
- San Bernardino County · 2,030,291 people
- City population
- 183,440
- Metro
- Riverside-San Bernardino-Ontario, CA
- Population (ZIP)
- 62,935
- Household income
- $100,578
- Rent vs Own
- Severe rent burden
- 1853.0
Population outlook (San Bernardino County) Hauer SSP2
- Today (2025)
- 2,300,329 people
- By 2030
- 2,378,907 · +3.4%
- By 2040
- 2,523,137 · +9.7%
- By 2050
- 2,642,388 · +14.9%
- By 2075
- 2,880,769 · +25.2%
- By 2100
- 2,909,436 · +26.5%
Race, ethnicity, and origin ACS 2023
- Neighborhood character
- Predominantly Hispanic (66%)
- Race & ethnicity
- Hispanic / Latino 66% Two or more races 23% White 15% Asian 9% Black 6% Native American 2%
- Hispanic origin (detail)
- Mexican 59%
- Common ancestry
- Iranian 1% Lithuanian 1% Italian 1%
- Foreign-born
- 24% · Canada, China, Vietnam
- Languages at home
- 51% English-only · Spanish 41% Chinese 3% Tagalog/Filipino 1%
Political lean MEDSL · San Bernardino
- 2024 margin
- Toss-up / Even · D 47.5% · R 49.7% · Other 2.8%
- 2008→2024 swing
- -8.5pp toward R · 2008: 6.3pp · 2024: -2.1pp
- All cycles
- 2024: R+2.1 2020: D+10.7 2016: D+9.8 2012: D+5.4 2008: D+6.3
Not yet ingested
- Civics
- —
Market trends
- HPI YoY
- ▼ -374.91%
- Current HPI
- 400.5674
- Rent YoY
- ▲ 2.39%
- Metro
- Riverside-San Bernardino-Ontario, CA
- State GDP YoY
- ▲ 3.21%
- F500 in state
- 116
Industry mix (Fortune 500 HQ in CA)
| Industry | F500 HQs | Revenue |
|---|---|---|
| Technology | 27 | $1,492B |
|
||
| Financial Services | 3 | $174B |
|
||
| Retail | 3 | $44B |
|
||
| Insurance | 3 | $26B |
|
||
| Media / Entertainment | 2 | $115B |
|
||
| Pharmaceuticals / Biotech | 2 | $62B |
|
||
Price history
2 events — show timeline
- 2026-05-02 Relisted — CRMLS
- 2026-04-29 Listed $98,450 CRMLS
Property tax history
-1.0%/yrLatest (2025): $138 · +0.7% YoY. Source: county tax records.
Cash-flow waterfall
monthlySold comps — $/sqft
last 12 mo · ≤1 miLoading sold comps…