 🌊 Lakefront
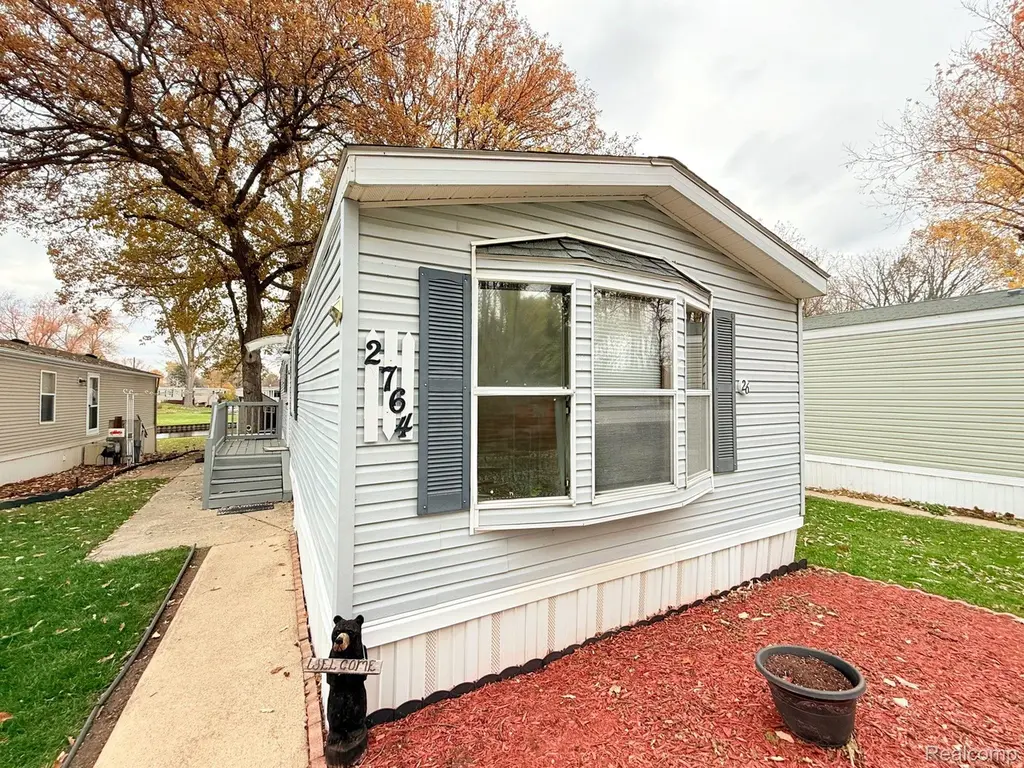
2764 Sunset Dr · Norvell, MI
Flood risk No data
- FEMA flood zone
- —
- Chance of flooding over 30 yrs
- —
- Est. flood insurance / yr
- —
Fire risk No data
- Est. fire insurance / yr
- —
Heat risk No data
- Hot days now (above threshold)
- —
- Hot days in 30 yrs
- —
Wind risk No data
- Chance of severe wind over 30 yrs
- —
Air-quality risk No data
- Unhealthy air days now
- —
- Unhealthy air days in 30 yrs
- —
Risk factors via First Street. Map © Google.
Why this score? — see what drove the F grade
The composite is a weighted blend of 9 inputs, each scored 0–100. Each bar is that input's sub-score; the figure is the points it added to the 100-point composite (weight × sub-score).
- 1% rule +10.0/10.0
- ARV discount +7.5/15.0
- Cash flow +5.6/30.0
- Schools +3.5/10.0
- Rent growth +2.5/5.0
- Livability +2.5/5.0
- Condition / age +2.5/5.0
- DSCR +0.0/10.0
- Appreciation +0.0/10.0
$57,900
🖨 Deal sheet (PDF) 📄 Offer letter ✓ Due diligence
Listing remarks MLS
Lake Living Without the Lakefront Price Tag! Welcome to this charming 1-bedroom, 1-bath (possible 2nd bedroom) waterfront home offering canal access to all-sports Vineyard Lake. Inside, you’ll find an open living area, spacious kitchen and dining, and a bonus room with beautiful lake views — perfect for relaxing or entertaining. Step outside to enjoy the back deck overlooking the water, complete with a 20' aluminum stationary dock, seawall, and space to unwind by the brick firepit for cozy bonfires. Additional features include a storage shed, under-deck storage, all new flooring, new roof and water heather in 2022, and all stainless steel appliances included — making this home move-in ready for year-round enjoyment or a perfect weekend getaway. Experience lake living at its best without the high price — schedule your showing today!
Key facts
- Brick firepit
- Seawall
- Storage shed
Tags
Neighborhood map
What this means for you Summary
Snapshot
- This is a 2-bed/1.0-bath other listed at $58k.
Deal economics
- At list price, monthly cash flow is $-122 ($-1k/yr) — negative.
- To cash-flow at today's rent, offer at most $36k (37.2% below list).
- Meets the 1% rule at list price ($1k rent vs $58k).
- Recommended offer: $36k (37.2% below list) — sets the bar for cash-flow.
Location & tenants
- Location reads: area grade F — affects rentability + tenant quality, not the cash-flow math above.
- Columbia School District (town): math 30% / reading 51% proficiency, ranked #194 of 540 in MI (top 36%) — families likely to look elsewhere, expect single-tenant / working-renter base with shorter leases.
- Zoned schools: Columbia Elementary School (323 students, 50% FRL); Columbia Central High School (math 30% / reading 55%, grade F, #263 of 713 statewide, top 37%, 654 students, 39% FRL).
- Market conditions: 141 active listings in the ZIP; 317 units permitted in Jackson County in 2024 (103 in 5+ unit buildings).
Forward outlook
- Local home prices are declining (-3.0%/yr); year-one equity from $400 of loan paydown is wiped out by about $2k of value loss. Plan a longer hold.
- Jackson County population projected at -13% by 2050 — secular population decline; favor cash flow + early exit over multi-decade hold.
Negotiation context
- It's been on market 225 days — a 12% lower offer ($51k) is reasonable based on typical stale-listing flexibility.
- 2 sale attempts with the ask held roughly flat each time — persistent listings suggest the price (not the market) is what's stuck; bring a comps-based counter.
Risks & watch-outs
- Watch-outs: HOA is 61% of rent.
Questions for the listing agent
- What do current leases actually rent for vs. the listed asking? Can we see a recent rent roll and the last 12 months of T-12 income?
- It's been on market 225 days. Have you received any prior offers? Is the seller open to a 37% concession, seller financing, or rate buy-down credit?
- What does the HOA fee cover, when was the last increase, and are there any pending special assessments or reserve-fund shortfalls?
- Why hasn't it sold? Are there any deal-killer items the seller is aware of (foundation, flood, title, zoning, code violations)?
- Is there a deadline driving the sale (1031 exchange, divorce, estate, relocation)? That informs how much negotiation room exists.
- The area grade is low — what's the realistic commute time and amenity access for the typical tenant pool here? Any planned neighborhood developments (good or bad) we should know about?
- This sits on a lake — are riparian / water-frontage rights deeded with the parcel? Any dock permits, shoreline easements, or HOA water-use restrictions?
- What's the documented flood / surge / shoreline-erosion history here (FEMA AND non-FEMA — e.g., storm surge, creek backup, septic-field saturation)?
- Any water-quality or seasonal algae-bloom issues that affect tenant satisfaction or short-term-rental demand?
- What's the average days-on-market for RENTAL listings here right now (not sales)? A rising rental-DOM trend means longer vacancies and softer asking-rent achievability than the comps imply.
- What's the recent tenant-quality profile in this submarket — average credit score on applications, eviction rate, late-payment / NSF rate, and stable-employment percentage? A property-management company in the area should have these aggregated.
- How much new for-sale + rental construction is in the pipeline within 1–3 miles? Heavy new supply typically softens prices + rents 12–24 months out; constrained supply supports both.
Investment metrics
- 1% rule
- 2.07% ✓
- Cap rate
- 3.76%
- Cash-on-cash
- -9.03%
- DSCR
- 0.60
- GRM
- 4.0
CMA / ARV
- ARV (median comp)
- $245,273
- List price
- $57,900
- Delta
- -76.39%
- Verdict
- UNDERPRICED
- Comps
- 20 within 1.0 mi
Projected returns pro-forma
-3.0% appreciation · 3.0% rent growth · sell at horizon
- IRR
- -31.1%
- Equity multiple
- -0.03×
- Total profit
- $-16,724
- Equity at exit
- $8,633
- IRR
- -29.3%
- Equity multiple
- -0.41×
- Total profit
- $-22,828
- Equity at exit
- $5,006
Cash invested: $16,212 (down + closing). Projections, not guarantees.
Landlord ↔ Tenant lean methodology
- Overall (STATE)
- 62 Landlord-Friendly
- State Michigan
- 62 Landlord-Friendly · EVEN
- County
- — inherits STATE
- City
- — inherits STATE
ZIP-level market 49230
- Home prices YoY
- -33.5%
- Active inventory
- 141
- Price-to-rent
- 4.0×
Monthly cashflow live
- Estimated rent
- $1,198 medium interval (Pro) →
- Mortgage (P&I)
- −$304
- Tax from tax record
- −$14 /mo · $172/yr
- Insurance
- −$24
- HOA
- −$726
- Vacancy / Maint / Mgmt
- −$251
- Net cashflow
- $-122
Break-even live
Sensitivity live
| Price | -10% $-89 | -5% $-106 | +0% $-122 | +5% $-138 | +10% $-155 |
|---|---|---|---|---|---|
| Rent | -10% $-217 | -5% $-169 | +0% $-122 | +5% $-75 | +10% $-27 |
| Rate | -1.0pp $-93 | -0.5pp $-107 | base $-122 | +0.5pp $-137 | +1.0pp $-152 |
UW: 25.0% down · 7.5% · 30yr · 1.5% tax · 5.0% vac · 8.0% maint · 8.0% mgmt
Financing live
Cash to close
- Down payment
- $14,475
- Closing costs
- $1,737
- Reserves months
- —
- Total cash needed
- —
Loan-product check · same deal, 3 products live
Conventional
25% down · 7.5% · 30yr
- Down + closing
- —
- Monthly P&I
- —
- Monthly cashflow
- —
- DSCR
- —
- Eligible?
- —
Personal DTI + credit; lowest rate.
DSCR
20% down · 8.5% · 30yr
- Down + closing
- —
- Monthly P&I
- —
- Monthly cashflow
- —
- DSCR
- —
- Eligible?
- —
No personal income docs; deal must DSCR.
Hard money
10% down · 12.0% · 12mo
- Down + closing
- —
- Monthly P&I
- —
- Monthly cashflow
- —
- DSCR
- —
- Eligible?
- —
Short-term bridge; refi at stabilization.
HOA detail
- Monthly dues
- $726 · $8,712/yr
- Likely covers
- water
Listing history 18 events
-
2026-06-21days on market $57,900 Active 225 DOM
-
2026-06-19days on market $57,900 Active 223 DOM
-
2026-06-18days on market $57,900 Active 222 DOM
-
2026-06-17days on market $57,900 Active 221 DOM
-
2026-06-16days on market $57,900 Active 220 DOM
-
2026-06-15days on market $57,900 Active 219 DOM
-
2026-06-14days on market $57,900 Active 217 DOM
-
2026-06-13days on market $57,900 Active 216 DOM
-
2026-06-10days on market $57,900 Active 214 DOM
-
2026-06-09days on market $57,900 Active 213 DOM
-
2026-06-08days on market $57,900 Active 212 DOM
-
2026-06-07pricedays on market $57,900 Active 211 DOM
-
2026-06-02days on market $59,900 Active 206 DOM
-
2026-06-01days on market $59,900 Active 205 DOM
-
2026-05-31days on market $59,900 Active 204 DOM
-
2026-05-30days on market $59,900 Active 203 DOM
-
2025-11-08$59,900 Active 867-char remark
Show marketing remark (849 chars)
Lake Living Without the Lakefront Price Tag! Welcome to this charming 1-bedroom, 1-bath (possible 2nd bedroom) waterfront home offering canal access to all-sports Vineyard Lake. Inside, you'll find an open living area, spacious kitchen and dining, and a bonus room with beautiful lake views - perfect for relaxing or entertaining. Step outside to enjoy the back deck overlooking the water, complete with a 20' aluminum stationary dock, seawall, and space to unwind by the brick firepit for cozy bonfires. Additional features include a storage shed, under-deck storage, all new flooring, new roof and water heather in 2022, and all stainless steel appliances included - making this home move-in ready for year-round enjoyment or a perfect weekend getaway. Experience lake living at its best without the high price - schedule your showing today!
-
2025-11-08$59,900 Active 849-char remark
Show marketing remark (849 chars)
Lake Living Without the Lakefront Price Tag! Welcome to this charming 1-bedroom, 1-bath (possible 2nd bedroom) waterfront home offering canal access to all-sports Vineyard Lake. Inside, you'll find an open living area, spacious kitchen and dining, and a bonus room with beautiful lake views - perfect for relaxing or entertaining. Step outside to enjoy the back deck overlooking the water, complete with a 20' aluminum stationary dock, seawall, and space to unwind by the brick firepit for cozy bonfires. Additional features include a storage shed, under-deck storage, all new flooring, new roof and water heather in 2022, and all stainless steel appliances included - making this home move-in ready for year-round enjoyment or a perfect weekend getaway. Experience lake living at its best without the high price - schedule your showing today!
ⓘ Source: listings_history table (triggers on properties + properties_extension) + one-shot
backfill from property_details.listing_events for pre-trigger history.
Tax reassessment forecast MI · Partial reset (capped growth)
- Current annual tax
- $172 · $14/mo
- Projected year-2 tax
- $532 · $44/mo
- Expected delta
- +$360/yr (+$30/mo · 208.9%)
ⓘ Screening estimate from a state-policy table — verify with the county assessor before closing.
Nearby sold comps map
Loading sold comps map…
Walkable amenities ~0.75 mi
Loading nearby amenities…
Taxation est. · year 1
- Rental income
- $14,371
- − Mortgage interest
- −$3,243
- − Property taxes
- −$172
- − Insurance
- −$290
- − Repairs & maintenance
- −$1,150
- − Management
- −$1,150
- − HOA
- −$8,712
- − Depreciation
- −$1,684
- Taxable loss
- −$2,030
- Est. tax savings @ 24.0%
- +$487
- After-tax cash flow
- $-977/yr
For passive investors: Depreciation is non-cash, so a rental often shows a tax loss while cash-flowing — sheltering income. Rental losses are passive: they offset passive income freely, and up to $25,000/yr can offset ordinary (W-2) income if you actively participate and your MAGI is under $100k (phasing out to $0 by $150k); unused losses carry forward. On sale, claimed depreciation is recaptured at up to 25%, and gains may owe capital-gains tax (a 1031 exchange can defer both). Figures are a year-1 estimate at your 24.0% rate — not tax advice; consult a CPA.
Schools (NCES district)
- District
- Columbia School District
- NCES district ID
- 2606990
- Math proficiency
- 30% ▼ -11.00%
- Reading proficiency
- 51% ▼ -9.00%
- Median HH income
- $56,099
- Composite
- 35.41/100
- National rank
- #4941
- State rank
- #194 of 540 in MI
Livability — Norvell
No livability data for this city. (Only ~50 U.S. cities are tracked.)
Census & demographics
- Census place
- Vineyard Lake, MI
- Population (ZIP)
- 10,259
Population outlook (Jackson County) Hauer SSP2
- Today (2025)
- 156,365 people
- By 2030
- 153,123 · -2.1%
- By 2040
- 144,981 · -7.3%
- By 2050
- 135,671 · -13.2%
- By 2075
- 113,833 · -27.2%
- By 2100
- 86,592 · -44.6%
Race, ethnicity, and origin ACS 2023
- Neighborhood character
- Predominantly White (94%)
- Race & ethnicity
- White 94% Two or more races 5%
- Common ancestry
- Romanian 10% Slovak 4% Italian 2%
- Foreign-born
- 2% · Canada
- Languages at home
- 98% English-only · Other Indo-European 1%
Political lean MEDSL · Jackson
- 2024 margin
- Strong R (+21.3) · D 38.6% · R 59.9% · Other 1.5%
- 2008→2024 swing
- -23.7pp toward R · 2008: 2.4pp · 2024: -21.3pp
- All cycles
- 2024: R+21.3 2020: R+19.0 2016: R+20.1 2012: R+5.8 2008: D+2.4
Not yet ingested
- Civics
- —
Market trends
- HPI YoY
- ▼ -128.18%
- Current HPI
- 254.7683
- Rent YoY
- —
- Metro
- —
- State GDP YoY
- ▲ 1.37%
- F500 in state
- 28
Industry mix (Fortune 500 HQ in MI)
| Industry | F500 HQs | Revenue |
|---|---|---|
| Automotive Parts | 3 | $48B |
|
||
| Automotive | 2 | $372B |
|
||
| Chemicals | 1 | $45B |
|
||
| Automotive Retail | 1 | $29B |
|
||
| Healthcare / Medical Devices | 1 | $23B |
|
||
| Automotive Technology | 1 | $20B |
|
||
Price history
+0.0% since first listed2 events — show timeline
- 2025-11-08 Listed $59,900 MiRealSource-MiMLS
- 2025-11-08 Listed $59,900 REALCOMP
Property tax history
+41.7%/yrLatest (2025): $172 · -0.3% YoY. Source: county tax records.
Cash-flow waterfall
monthlySold comps — $/sqft
last 12 mo · ≤1 miLoading sold comps…