 🌊 Lakefront
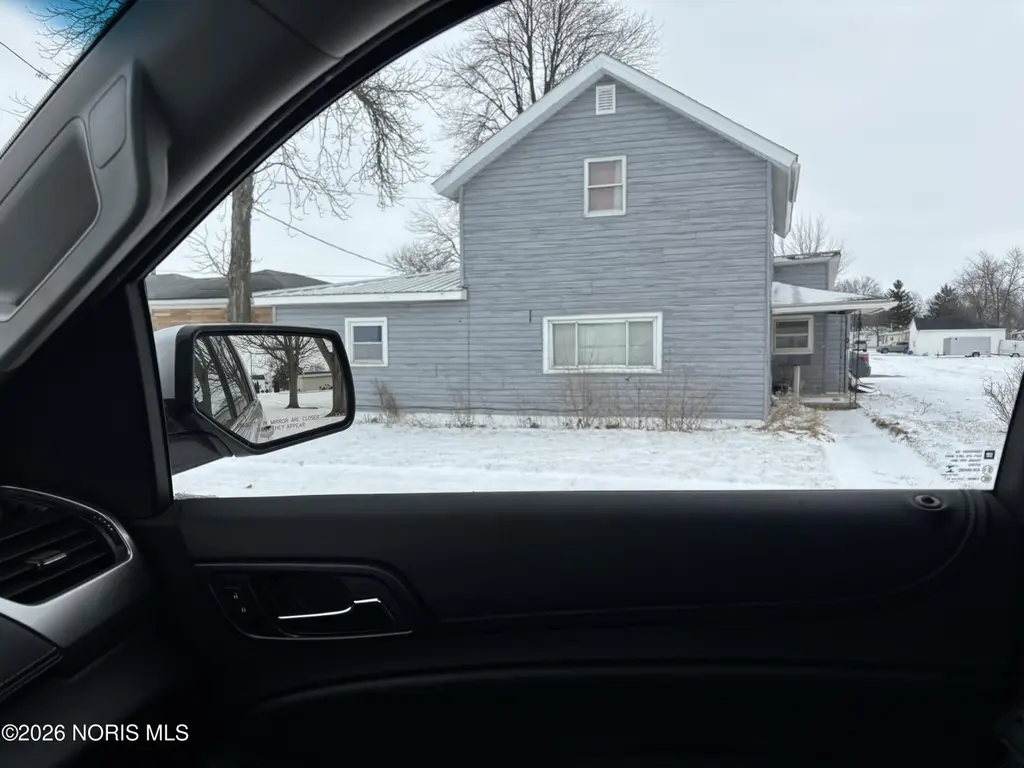
423 S Stearns Ave · Deshler, OH
Flood risk 1/10 · Minimal
- FEMA flood zone
- X
- Chance of flooding over 30 yrs
- 0.0%
- Est. flood insurance / yr
- $507 – $1,088
Fire risk 1/10 · Minimal
- Est. fire insurance / yr
- $713 – $1,323
Heat risk 3/10 · Minor
- Hot days now (above 99°F)
- 7 days/yr
- Hot days in 30 yrs
- 17 days/yr
Wind risk 2/10 · Minimal
- Chance of severe wind over 30 yrs
- —
Air-quality risk 2/10 · Minimal
- Unhealthy air days now
- 1 days/yr
- Unhealthy air days in 30 yrs
- 2 days/yr
Risk factors via First Street. Map © Google.
Why this score? — see what drove the D+ grade
The composite is a weighted blend of 9 inputs, each scored 0–100. Each bar is that input's sub-score; the figure is the points it added to the 100-point composite (weight × sub-score).
- Cash flow +13.9/30.0
- ARV discount +7.0/15.0
- Appreciation +6.8/10.0
- Schools +6.0/10.0
- DSCR +4.2/10.0
- Livability +3.2/5.0
- 1% rule +3.0/10.0
- Rent growth +2.5/5.0
- Condition / age +2.5/5.0
$139,000
🖨 Deal sheet 📄 Offer letter ✓ Due diligence
Listing remarks MLS
Spacious property with big detach garage has electric and heat hook up. Walking distance to reservoir ,Set up showing today before gone
Key facts
- Detach garage
- Heat hook up
- Electric hook up
Tags
Neighborhood map
What this means for you Summary
Snapshot
- This is a 2-bed/1.0-bath single-family listed at $139k.
Deal economics
- At list price, monthly cash flow is $14 ($170/yr) — positive.
- The deal already cash-flows at list — no discount required.
- To meet the 1% rule (rent ≥ 1% of price), the offer needs to be $112k (19.7% below list).
- Recommended offer: $112k (19.7% below list) — sets the bar for 1% rule.
- Cap rate 6.4% vs local median 1.9% in Deshler — top-decile yield for the area; either an underpriced asset or a hidden risk that comps aren't pricing in. Stress-test before assuming the spread holds.
Location & tenants
- Location reads 65/100 on livability (#713 in OH) — a middle-class / working-renter tenant base. Strengths: crime A+, cost of living A+, housing A+; Watch: employment C-, schools F, amenities F.
- Patrick Henry Local (rural): math 69% / reading 72% proficiency, ranked #148 of 656 in OH (top 23%) — strong family-tenant draw, lease renewals of 3-5y typical.
- Market conditions: 48 active listings in the ZIP; solid renter incomes; 18 units permitted in Henry County in 2024 (0 in 5+ unit buildings).
- This rent is only 16% of the median local income ($82k/yr) — well below the 30% rent-burden line; pricing power to push rent on renewal without tenant pushback.
Forward outlook
- In year one you build about $6k of equity ($961 loan paydown + $5k appreciation (3.5% local appreciation)).
- Henry County population projected at -14% by 2050 — secular population decline; favor cash flow + early exit over multi-decade hold.
- At projected returns (3.5% appreciation + 3.0% rent growth), your $39k cash investment doubles in ~6 years — after that, you're playing with house money.
- By year 6, paydown + projected appreciation supports a ~$31k cash-out refi (75% LTV) — recoverable capital for the next deal without selling this one.
Negotiation context
- It's been on market 162 days — a 12% lower offer ($122k) is reasonable based on typical stale-listing flexibility.
- 3 sale attempts since 14y ago with the ask held roughly flat each time — persistent listings suggest the price (not the market) is what's stuck; bring a comps-based counter.
- Current owner paid $14k; list at $139k implies a 893% gain — meaningful room to come down on a strong offer.
Risks & watch-outs
- Watch-outs: built in 1871 — expect roof / HVAC / electrical / plumbing capex.
Questions for the listing agent
- It's been on market 162 days. Have you received any prior offers? Is the seller open to a 20% concession, seller financing, or rate buy-down credit?
- Built in 1871 — when were the roof, HVAC, electrical panel, plumbing, and water heater last replaced?
- Why hasn't it sold? Are there any deal-killer items the seller is aware of (foundation, flood, title, zoning, code violations)?
- Is there a deadline driving the sale (1031 exchange, divorce, estate, relocation)? That informs how much negotiation room exists.
- Schools are F-rated, which usually means shorter tenancies and higher turnover. Who's the typical renter profile here, and what's been the actual vacancy rate?
- The area grade is low — what's the realistic commute time and amenity access for the typical tenant pool here? Any planned neighborhood developments (good or bad) we should know about?
- This sits on a lake — are riparian / water-frontage rights deeded with the parcel? Any dock permits, shoreline easements, or HOA water-use restrictions?
- What's the documented flood / surge / shoreline-erosion history here (FEMA AND non-FEMA — e.g., storm surge, creek backup, septic-field saturation)?
- Any water-quality or seasonal algae-bloom issues that affect tenant satisfaction or short-term-rental demand?
- What's the average days-on-market for RENTAL listings here right now (not sales)? A rising rental-DOM trend means longer vacancies and softer asking-rent achievability than the comps imply.
- What's the recent tenant-quality profile in this submarket — average credit score on applications, eviction rate, late-payment / NSF rate, and stable-employment percentage? A property-management company in the area should have these aggregated.
- How much new for-sale + rental construction is in the pipeline within 1–3 miles? Heavy new supply typically softens prices + rents 12–24 months out; constrained supply supports both.
Investment metrics
- 1% rule
- 0.80% ✗
- Cap rate
- 6.41%
- Cash-on-cash
- 0.44%
- DSCR
- 1.02
- GRM
- 10.4
CMA / ARV
- ARV (median comp)
- $137,622
- List price
- $139,000
- Delta
- 1.00%
- Verdict
- FAIR
- Comps
- 20 within 1.0 mi
Show comp detail 12 sales within ~0.75 mi
| Address | Dist | Beds/Ba | Sqft | Sold | Price | $/sf | Match |
|---|---|---|---|---|---|---|---|
| 524 E Elm St | 0.49mi | 3/1.0 (+1) | 1,287 (-5%) | 1mo | $139,900 | $109 | 63 |
| 410 E Bartlow St | 0.21mi | 3/2.0 (+1) | 1,265 (-7%) | 10mo | $175,000 | $138 | 61 |
| 108 E Maple St | 0.38mi | 3/1.0 (+1) | 1,288 (-5%) | 10mo | $130,000 | $101 | 61 |
| 116 E Plum St | 0.55mi | 3/1.0 (+1) | 1,376 (+1%) | 18mo | $125,000 | $91 | 52 |
| 529 W Maple St | 0.73mi | 3/1.0 (+1) | 1,440 (+6%) | 2mo | $140,000 | $97 | 49 |
| 319 E Plum St | 0.55mi | 3/1.0 (+1) | 1,544 (+14%) | 1mo | $159,900 | $104 | 46 |
| 135 W Elm St | 0.51mi | 3/1.0 (+1) | 1,497 (+10%) | 14mo | $108,000 | $72 | 42 |
| 227 N Park St | 0.57mi | 3/1.0 (+1) | 1,232 (-9%) | 18mo | $170,000 | $138 | 38 |
| 415 N Park St | 0.69mi | 2/1.0 | 1,500 (+10%) | 16mo | $165,000 | $110 | 37 |
| 521 E Elm St | 0.51mi | 2/2.0 | 1,212 (-11%) | 23mo | $100,000 | $83 | 35 |
| 523 N Ash St | 0.68mi | 3/1.0 (+1) | 1,244 (-8%) | 22mo | $157,000 | $126 | 31 |
| 533 N Ash St | 0.70mi | 3/1.0 (+1) | 1,232 (-9%) | 20mo | $135,000 | $110 | 30 |
Match score weights: distance 35% · size 25% · config 20% · recency 20%. Top-matched comps best support the ARV.
Projected returns pro-forma
3.54% appreciation · 3.0% rent growth · sell at horizon
- IRR
- 9.4%
- Equity multiple
- 1.55×
- Total profit
- $21,582
- Equity at exit
- $66,731
- IRR
- 11.5%
- Equity multiple
- 2.82×
- Total profit
- $70,717
- Equity at exit
- $106,259
Cash invested: $38,920 (down + closing). Projections, not guarantees.
Landlord ↔ Tenant lean methodology
- Overall (STATE)
- 73 Landlord-Friendly
- State Ohio
- 73 Landlord-Friendly · R+6
- County
- — inherits STATE
- City
- — inherits STATE
ZIP-level market 43516
- Home prices YoY
- 1.4%
- Active inventory
- 48
- Price-to-rent
- 10.4×
Monthly cashflow live
- Estimated rent
- $1,116 medium interval (Pro) →
- Mortgage (P&I)
- −$729
- Tax from tax record
- −$81 /mo · $968/yr
- Insurance
- −$58
- HOA
- −$0
- Vacancy / Maint / Mgmt
- −$234
- Net cashflow
- $14
Break-even live
UW: 25.0% down · 7.5% · 30yr · 1.5% tax · 5.0% vac · 8.0% maint · 8.0% mgmt
Financing live
Cash to close
- Down payment
- $34,750
- Closing costs
- $4,170
- Reserves months
- —
- Total cash needed
- —
Loan-product check · same deal, 3 products live
Conventional
25% down · 7.5% · 30yr
- Down + closing
- —
- Monthly P&I
- —
- Monthly cashflow
- —
- DSCR
- —
- Eligible?
- —
Personal DTI + credit; lowest rate.
DSCR
20% down · 8.5% · 30yr
- Down + closing
- —
- Monthly P&I
- —
- Monthly cashflow
- —
- DSCR
- —
- Eligible?
- —
No personal income docs; deal must DSCR.
Hard money
10% down · 12.0% · 12mo
- Down + closing
- —
- Monthly P&I
- —
- Monthly cashflow
- —
- DSCR
- —
- Eligible?
- —
Short-term bridge; refi at stabilization.
Listing history 22 events
-
2026-06-18days on market $139,000 Active 162 DOM
-
2026-06-17days on market $139,000 Active 161 DOM
-
2026-06-16days on market $139,000 Active 160 DOM
-
2026-06-15days on market $139,000 Active 159 DOM
-
2026-06-13days on market $139,000 Active 157 DOM
-
2026-06-12days on market $139,000 Active 156 DOM
-
2026-06-09days on market $139,000 Active 153 DOM
-
2026-06-08days on market $139,000 Active 152 DOM
-
2026-06-08days on market $139,000 Active 151 DOM
-
2026-06-07days on market $139,000 Active 150 DOM
-
2026-06-04days on market $139,000 Active 147 DOM
-
2026-06-02days on market $139,000 Active 146 DOM
-
2026-06-01days on market $139,000 Active 145 DOM
-
2026-05-31days on market $139,000 Active 144 DOM
-
2026-01-07$139,000 Active 139-char remark
Show marketing remark (139 chars)
Spacious property with big detach garage has electric and heat hook up. Walking distance to reservoir ,Set up showing today before gone
-
2012-12-11soldstatus $14,000 519-char remark
Show marketing remark (519 chars)
ERA LISTING. SMALL TOWN FIXER WITH ALOT OF SPACE FOR THE MONEY. LARGE DETACHED, TWO CAR GARAGE IS A PLUS. THIS IS A FANNIE MAE HOMEPATH PROPERTY AND COULD BE PURCHASED FOR AS LITTLE AS 3% DOWN. THIS PROPERTY IS APPROVED FOR THE HOMEPATH RENOVATION MORTGAGE PRODUCT. DURING THE FIRST 15 DAYS ON MARKET, REFERRED TO AS THE FIRST LOOK PERIOD, SELLER WILL ONLY CONSIDER OFFERS FROM OWNER OCCUPANT BUYERS. ALL OFFERS MUST BE SUBMITTED BY THE BUYER'S AGENT ONLINE AT www. homepath.com AGENTS BLAINE WELLS & KENT HILTY.
-
2012-12-11soldstatus $14,000
Show marketing remark (519 chars)
ERA LISTING. SMALL TOWN FIXER WITH ALOT OF SPACE FOR THE MONEY. LARGE DETACHED, TWO CAR GARAGE IS A PLUS. THIS IS A FANNIE MAE HOMEPATH PROPERTY AND COULD BE PURCHASED FOR AS LITTLE AS 3% DOWN. THIS PROPERTY IS APPROVED FOR THE HOMEPATH RENOVATION MORTGAGE PRODUCT. DURING THE FIRST 15 DAYS ON MARKET, REFERRED TO AS THE FIRST LOOK PERIOD, SELLER WILL ONLY CONSIDER OFFERS FROM OWNER OCCUPANT BUYERS. ALL OFFERS MUST BE SUBMITTED BY THE BUYER'S AGENT ONLINE AT www. homepath.com AGENTS BLAINE WELLS & KENT HILTY.
-
2012-08-17$19,900 519-char remark
Show marketing remark (519 chars)
ERA LISTING. SMALL TOWN FIXER WITH ALOT OF SPACE FOR THE MONEY. LARGE DETACHED, TWO CAR GARAGE IS A PLUS. THIS IS A FANNIE MAE HOMEPATH PROPERTY AND COULD BE PURCHASED FOR AS LITTLE AS 3% DOWN. THIS PROPERTY IS APPROVED FOR THE HOMEPATH RENOVATION MORTGAGE PRODUCT. DURING THE FIRST 15 DAYS ON MARKET, REFERRED TO AS THE FIRST LOOK PERIOD, SELLER WILL ONLY CONSIDER OFFERS FROM OWNER OCCUPANT BUYERS. ALL OFFERS MUST BE SUBMITTED BY THE BUYER'S AGENT ONLINE AT www. homepath.com AGENTS BLAINE WELLS & KENT HILTY.
-
2012-08-17$14,000
Show marketing remark (519 chars)
ERA LISTING. SMALL TOWN FIXER WITH ALOT OF SPACE FOR THE MONEY. LARGE DETACHED, TWO CAR GARAGE IS A PLUS. THIS IS A FANNIE MAE HOMEPATH PROPERTY AND COULD BE PURCHASED FOR AS LITTLE AS 3% DOWN. THIS PROPERTY IS APPROVED FOR THE HOMEPATH RENOVATION MORTGAGE PRODUCT. DURING THE FIRST 15 DAYS ON MARKET, REFERRED TO AS THE FIRST LOOK PERIOD, SELLER WILL ONLY CONSIDER OFFERS FROM OWNER OCCUPANT BUYERS. ALL OFFERS MUST BE SUBMITTED BY THE BUYER'S AGENT ONLINE AT www. homepath.com AGENTS BLAINE WELLS & KENT HILTY.
-
2005-08-01soldstatus $73,300
-
1999-11-22soldstatus $64,000
-
1991-07-25soldstatus $38,000
ⓘ Source: listings_history table (triggers on properties + properties_extension) + one-shot
backfill from property_details.listing_events for pre-trigger history.
Tax reassessment forecast OH · Partial reset (capped growth)
- Current annual tax
- $968 · $81/mo
- Projected year-2 tax
- $1,568 · $131/mo
- Expected delta
- +$600/yr (+$50/mo · 62.0%)
ⓘ Screening estimate from a state-policy table — verify with the county assessor before closing.
Climate risk First Street
- Flood 1/10 Low FEMA zone X · 0% chance over 30 yrs
- Wildfire 1/10 Low
- Heat 3/10 Moderate 7 d/yr ≥99°F today · 17 d/yr by 30 yrs out
- Wind 2/10 Low
- Air quality 2/10 Low 1 unhealthy d/yr today · 2 by 30 yrs out
Nearby sold comps map
Loading sold comps map…
Walkable amenities ~0.75 mi
Loading nearby amenities…
Taxation est. · year 1
- Rental income
- $13,392
- − Mortgage interest
- −$7,786
- − Property taxes
- −$968
- − Insurance
- −$695
- − Repairs & maintenance
- −$1,071
- − Management
- −$1,071
- − Depreciation
- −$4,044
- Taxable loss
- −$2,243
- Est. tax savings @ 24.0%
- +$538
- After-tax cash flow
- $708/yr
For passive investors: Depreciation is non-cash, so a rental often shows a tax loss while cash-flowing — sheltering income. Rental losses are passive: they offset passive income freely, and up to $25,000/yr can offset ordinary (W-2) income if you actively participate and your MAGI is under $100k (phasing out to $0 by $150k); unused losses carry forward. On sale, claimed depreciation is recaptured at up to 25%, and gains may owe capital-gains tax (a 1031 exchange can defer both). Figures are a year-1 estimate at your 24.0% rate — not tax advice; consult a CPA.
Schools (NCES district)
- District
- Patrick Henry Local
- NCES district ID
- 3904759
- Math proficiency
- 69% ▼ -7.00%
- Reading proficiency
- 72% ▼ -5.00%
- Median HH income
- $50,401
- Composite
- 59.81/100
- National rank
- #897
- State rank
- #148 of 656 in OH
Livability — Deshler
- Score
- 65/100
- State rank
- #713
- US rank
- #12844
Category grades
Schools grade is shown separately in the Schools card above.
Census & demographics
- Census place
- Deshler, OH
- County
- Henry · 27,211 people
- City population
- 3,014
- Population (ZIP)
- 3,014
- Household income
- $82,500
- Rent vs Own
- Severe rent burden
- 5.4
Population outlook (Henry County) Hauer SSP2
- Today (2025)
- 27,204 people
- By 2030
- 26,657 · -2.0%
- By 2040
- 25,149 · -7.6%
- By 2050
- 23,361 · -14.1%
- By 2075
- 20,409 · -25.0%
- By 2100
- 18,199 · -33.1%
Race, ethnicity, and origin ACS 2023
- Neighborhood character
- Predominantly White (88%)
- Race & ethnicity
- White 88% Hispanic / Latino 11% Two or more races 3%
- Hispanic origin (detail)
- Mexican 8%
- Common ancestry
- English 2% Romanian 1% Iranian 1%
- Foreign-born
- 4% · Canada
- Languages at home
- 92% English-only · Spanish 7% Arabic 0%
Political lean MEDSL · Henry
- 2024 margin
- Solid R (+46.7) · D 26.2% · R 72.9%
- 2008→2024 swing
- -33.8pp toward R · 2008: -12.9pp · 2024: -46.7pp
- All cycles
- 2024: R+46.7 2020: R+43.5 2016: R+39.8 2012: R+18.6 2008: R+12.9
Not yet ingested
- Civics
- —
Market trends
- HPI YoY
- ▲ 3.54%
- Current HPI
- 246.8546
- Rent YoY
- —
- Metro
- —
- State GDP YoY
- ▲ 1.98%
- F500 in state
- 48
Industry mix (Fortune 500 HQ in OH)
| Industry | F500 HQs | Revenue |
|---|---|---|
| Insurance | 3 | $145B |
|
||
| Industrial Machinery | 3 | $49B |
|
||
| Financial Services | 3 | $24B |
|
||
| Consumer Goods | 2 | $93B |
|
||
| Aerospace / Defense | 2 | $47B |
|
||
| Utilities | 2 | $33B |
|
||
Price history
+265.8% since first listed8 events — show timeline
- 2026-01-07 Listed $139,000 NORIS
- 2012-12-11 Sold (MLS) $14,000 NORIS
- 2012-12-11 Sold (MLS) $14,000 NORIS
- 2012-08-17 Listed $14,000 NORIS
- 2012-08-17 Listed $19,900 NORIS
- 2005-08-01 Sold (Public Records) $73,300 Public Records
- 1999-11-22 Sold (Public Records) $64,000 Public Records
- 1991-07-25 Sold (Public Records) $38,000 Public Records
Property tax history
-2.5%/yrLatest (2025): $968 · -3.3% YoY. Source: county tax records.
Cash-flow waterfall
monthlySold comps — $/sqft
last 12 mo · ≤1 miLoading sold comps…