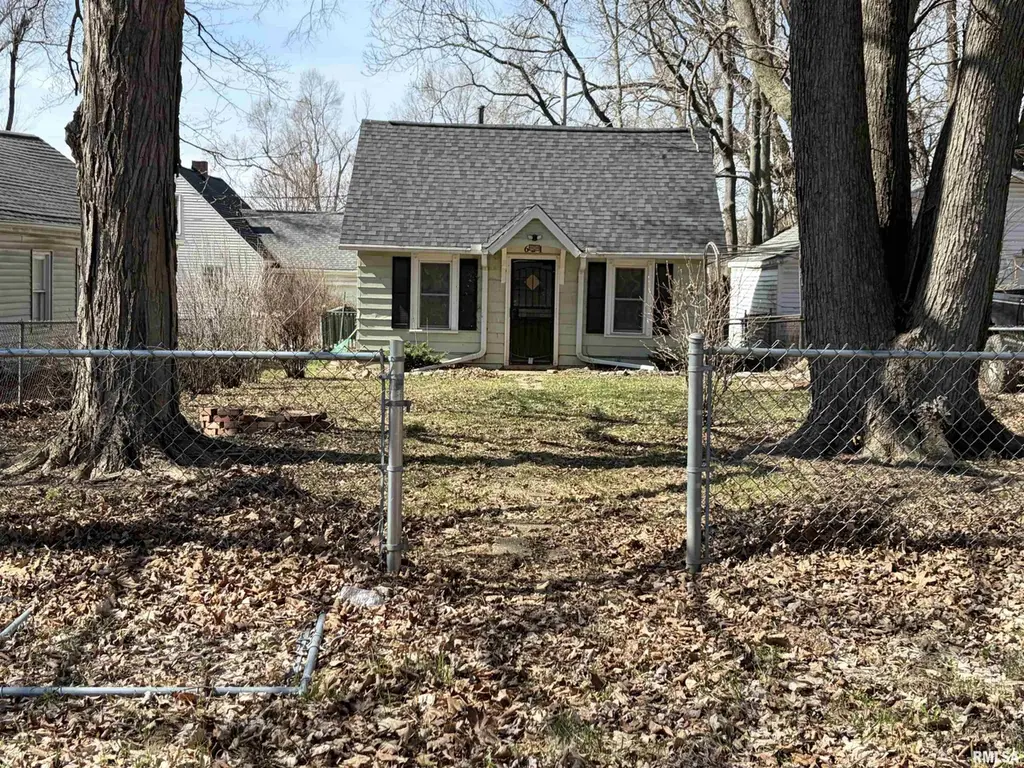
621 S Stewart St · Creve Coeur, IL
Flood risk 1/10 · Minimal
- FEMA flood zone
- X (unshaded)
- Chance of flooding over 30 yrs
- 0.0%
- Est. flood insurance / yr
- $473 – $860
Fire risk 1/10 · Minimal
- Est. fire insurance / yr
- $804 – $1,492
Heat risk 3/10 · Minor
- Hot days now (above 103°F)
- 7 days/yr
- Hot days in 30 yrs
- 18 days/yr
Wind risk 2/10 · Minimal
- Chance of severe wind over 30 yrs
- 1.0%
Air-quality risk 3/10 · Minor
- Unhealthy air days now
- 1 days/yr
- Unhealthy air days in 30 yrs
- 3 days/yr
Risk factors via First Street. Map © Google.
Why this score? — see what drove the C- grade
The composite is a weighted blend of 9 inputs, each scored 0–100. Each bar is that input's sub-score; the figure is the points it added to the 100-point composite (weight × sub-score).
- Cash flow +25.9/30.0
- DSCR +8.7/10.0
- 1% rule +5.7/10.0
- Livability +3.2/5.0
- Rent growth +2.5/5.0
- Condition / age +2.5/5.0
- Schools +1.5/10.0
- ARV discount +0.0/15.0
- Appreciation +0.0/10.0
$67,000
🖨 Deal sheet 📄 Offer letter ✓ Due diligence
Listing remarks MLS
sold one time show
Key facts
- Renovated bathroom
- Fresh paint
- New flooring
Tags
Property features AI
Exterior
- Parking: Alley access (no garage)
- Utilities: Public water; Public sewer
- Home design: Single-family residence; Built in 1938; Approximately 576 building area
- Construction: Shingle roof; No basement
- Exterior features: Shed(s); Level lot; Paved road access
Interior
- Kitchen: Kitchen with vinyl flooring
- Bedrooms: 1 bedroom (main level), approximately 8' x 12', carpeted, egress window
- Flooring: Carpet in living areas and bedroom; Vinyl in kitchen and laundry
- Bathrooms: 1 full bathroom
- Heating & cooling: No central cooling
- Interior features: Cable available; Ceiling fan(s)
- Laundry & utility: Laundry room on main level (approximately 5' x 8')
Neighborhood map
What this means for you Summary
Snapshot
- This is a 1-bed/1.0-bath single-family listed at $67k.
Deal economics
- At list price, monthly cash flow is $166 ($2k/yr) — positive.
- The deal already cash-flows at list — no discount required.
- Meets the 1% rule at list price ($719 rent vs $67k).
- Recommended offer: $61k (9.0% below list) — sets the bar for market timing.
Location & tenants
- Location reads 63/100 on livability (#755 in IL) — a middle-class / working-renter tenant base. Strengths: cost of living A+, housing A-; Watch: employment D, amenities F, commute F.
- East Peoria Chsd 309 (suburban): math 17% / reading 15% proficiency, ranked #482 of 620 in IL (top 78%) — low school quality limits family demand, transient renter base, plan for 1-2y turnover.
- Zoned schools: East Peoria High School (math 17% / reading 15%, grade F, #457 of 693 statewide, top 66%, 947 students, 0% FRL).
- Market conditions: 23 active listings in the ZIP; 2 comparable units currently listed for rent nearby; 77 units permitted in Tazewell County in 2024 (0 in 5+ unit buildings).
Forward outlook
- Local home prices are declining (-3.0%/yr); year-one equity from $463 of loan paydown is wiped out by about $2k of value loss. Plan a longer hold.
- Tazewell County population projected at -15% by 2050 — secular population decline; favor cash flow + early exit over multi-decade hold.
Negotiation context
- It's been on market 99 days — a 9% lower offer ($61k) is reasonable based on typical stale-listing flexibility.
- 4 sale attempts since 24y ago with the ask held roughly flat each time — persistent listings suggest the price (not the market) is what's stuck; bring a comps-based counter.
- Current owner paid $22k; list at $67k implies a 209% gain — meaningful room to come down on a strong offer.
Risks & watch-outs
- Watch-outs: built in 1938 — expect roof / HVAC / electrical / plumbing capex.
Questions for the listing agent
- It's been on market 99 days. Have you received any prior offers? Is the seller open to a 9% concession, seller financing, or rate buy-down credit?
- Built in 1938 — when were the roof, HVAC, electrical panel, plumbing, and water heater last replaced?
- Why hasn't it sold? Are there any deal-killer items the seller is aware of (foundation, flood, title, zoning, code violations)?
- Is there a deadline driving the sale (1031 exchange, divorce, estate, relocation)? That informs how much negotiation room exists.
- Schools are F-rated, which usually means shorter tenancies and higher turnover. Who's the typical renter profile here, and what's been the actual vacancy rate?
- What's the average days-on-market for RENTAL listings here right now (not sales)? A rising rental-DOM trend means longer vacancies and softer asking-rent achievability than the comps imply.
- What's the recent tenant-quality profile in this submarket — average credit score on applications, eviction rate, late-payment / NSF rate, and stable-employment percentage? A property-management company in the area should have these aggregated.
- How much new for-sale + rental construction is in the pipeline within 1–3 miles? Heavy new supply typically softens prices + rents 12–24 months out; constrained supply supports both.
Investment metrics
- 1% rule
- 1.07% ✓
- Cap rate
- 9.26%
- Cash-on-cash
- 10.60%
- DSCR
- 1.47
- GRM
- 7.8
CMA / ARV
- ARV (on-the-fly)
- $55,872
- Comps found
- 3
Show comp detail 3 sales within ~0.75 mi
| Address | Dist | Beds/Ba | Sqft | Sold | Price | $/sf | Match |
|---|---|---|---|---|---|---|---|
| 927 S Stewart St | 0.24mi | 1/1.0 | 576 (0%) | 20mo | $54,500 | $95 | 72 |
| 108 Lewis Ct | 0.26mi | 2/1.0 (+1) | 608 (+6%) | 12mo | $96,500 | $159 | 63 |
| 316 Zessin St | 0.32mi | 1/1.0 | 616 (+7%) | 14mo | $59,900 | $97 | 62 |
Match score weights: distance 35% · size 25% · config 20% · recency 20%. Top-matched comps best support the ARV.
Projected returns pro-forma
-3.0% appreciation · 3.0% rent growth · sell at horizon
- IRR
- -0.5%
- Equity multiple
- 0.98×
- Total profit
- $-330
- Equity at exit
- $9,990
- IRR
- 9.2%
- Equity multiple
- 1.70×
- Total profit
- $13,196
- Equity at exit
- $5,793
Cash invested: $18,760 (down + closing). Projections, not guarantees.
Landlord ↔ Tenant lean methodology
- Overall (STATE)
- 43 Moderately Tenant-Leaning
- State Illinois
- 43 Moderately Tenant-Leaning · D+7
- County
- — inherits STATE
- City
- — inherits STATE
ZIP-level market 61610
- Home prices YoY
- -23.7%
- Active inventory
- 23
- Price-to-rent
- 7.8×
Monthly cashflow live
- Estimated rent
- $719 medium interval (Pro) →
- Mortgage (P&I)
- −$351
- Tax from tax record
- −$23 /mo · $281/yr
- Insurance
- −$28
- HOA
- −$0
- Vacancy / Maint / Mgmt
- −$151
- Net cashflow
- $166
Break-even live
UW: 25.0% down · 7.5% · 30yr · 1.5% tax · 5.0% vac · 8.0% maint · 8.0% mgmt
Financing live
Cash to close
- Down payment
- $16,750
- Closing costs
- $2,010
- Reserves months
- —
- Total cash needed
- —
Loan-product check · same deal, 3 products live
Conventional
25% down · 7.5% · 30yr
- Down + closing
- —
- Monthly P&I
- —
- Monthly cashflow
- —
- DSCR
- —
- Eligible?
- —
Personal DTI + credit; lowest rate.
DSCR
20% down · 8.5% · 30yr
- Down + closing
- —
- Monthly P&I
- —
- Monthly cashflow
- —
- DSCR
- —
- Eligible?
- —
No personal income docs; deal must DSCR.
Hard money
10% down · 12.0% · 12mo
- Down + closing
- —
- Monthly P&I
- —
- Monthly cashflow
- —
- DSCR
- —
- Eligible?
- —
Short-term bridge; refi at stabilization.
Rent comps 2 comps
| Address | Beds | Baths | Sqft | Rent | $/sqft | DOM | Units | Dist |
|---|---|---|---|---|---|---|---|---|
| 928 S Stewart St Unit 1 Creve Coeur, IL | 1.0 | 1.0 | 630 | $725 | $1.15 | 21d | 1 | 0.24mi |
| 1107 Pekin Ave Unit B Creve Coeur, IL | 1.0 | 1.0 | 600 | $700 | $1.17 | 21d | 1 | 0.89mi |
Listing history 24 events
-
2026-06-19days on market $67,000 Under Contract 99 DOM
-
2026-06-18days on market $67,000 Under Contract 98 DOM
-
2026-06-17days on market $67,000 Under Contract 97 DOM
-
2026-06-16days on market $67,000 Under Contract 96 DOM
-
2026-06-15days on market $67,000 Under Contract 95 DOM
-
2026-06-14days on market $67,000 Under Contract 93 DOM
-
2026-06-13days on market $67,000 Under Contract 92 DOM
-
2026-06-10days on market $67,000 Under Contract 90 DOM
-
2026-06-09days on market $67,000 Under Contract 89 DOM
-
2026-06-08days on market $67,000 Under Contract 88 DOM
-
2026-06-07days on market $67,000 Under Contract 87 DOM
-
2026-06-03status $67,000 Under Contract 82 DOM
-
2026-06-02days on market $67,000 Active 82 DOM
-
2026-06-01days on market $67,000 Active 81 DOM
-
2026-05-31days on market $67,000 Active 80 DOM
-
2026-05-30days on market $67,000 Active 79 DOM
-
2026-05-19price $67,000
-
2026-05-06status Active
-
2026-04-01historical Under Contract
-
2026-03-12$70,000 Active
-
2007-07-21soldstatus $21,700 18-char remark
Show marketing remark (18 chars)
sold one time show
-
2007-05-22$23,000 18-char remark
Show marketing remark (18 chars)
sold one time show
-
2002-11-20soldstatus $13,500 319-char remark
Show marketing remark (319 chars)
1 BEDROOM BUNGALOW WITH ALUMINUM SIDING, NEWER ROOF, 30 GALLON GAS WATER HE ATER & CARPET; EAT-IN-KITCHEN; LIVING & DINING ROOMS; SOLD "AS IS"-NO WARR- ANTIES; 4 1/2' X 10 1/2' WOOD DECK W/12' HANDICAP RAMP; ALLEY ACCESS IN BAC K; PRICED FOR QUICK SALE; NEEDS TLC; DAY TIME SHOWINGS ONLY-NO UTILITIES;
-
2002-10-14$14,900 319-char remark
Show marketing remark (319 chars)
1 BEDROOM BUNGALOW WITH ALUMINUM SIDING, NEWER ROOF, 30 GALLON GAS WATER HE ATER & CARPET; EAT-IN-KITCHEN; LIVING & DINING ROOMS; SOLD "AS IS"-NO WARR- ANTIES; 4 1/2' X 10 1/2' WOOD DECK W/12' HANDICAP RAMP; ALLEY ACCESS IN BAC K; PRICED FOR QUICK SALE; NEEDS TLC; DAY TIME SHOWINGS ONLY-NO UTILITIES;
ⓘ Source: listings_history table (triggers on properties + properties_extension) + one-shot
backfill from property_details.listing_events for pre-trigger history.
Tax reassessment forecast IL · Partial reset (capped growth)
- Current annual tax
- $281 · $23/mo
- Projected year-2 tax
- $901 · $75/mo
- Expected delta
- +$620/yr (+$52/mo · 220.8%)
ⓘ Screening estimate from a state-policy table — verify with the county assessor before closing.
Climate risk First Street
- Flood 1/10 Low FEMA zone X (unshaded) · 0% chance over 30 yrs
- Wildfire 1/10 Low
- Heat 3/10 Moderate 7 d/yr ≥103°F today · 18 d/yr by 30 yrs out
- Wind 2/10 Low 100% chance of damaging wind over 30 yrs
- Air quality 3/10 Moderate 1 unhealthy d/yr today · 3 by 30 yrs out
Nearby sold comps map
Loading sold comps map…
Walkable amenities ~0.75 mi
Loading nearby amenities…
Taxation est. · year 1
- Rental income
- $8,634
- − Mortgage interest
- −$3,753
- − Property taxes
- −$281
- − Insurance
- −$335
- − Repairs & maintenance
- −$691
- − Management
- −$691
- − Depreciation
- −$1,949
- Taxable income
- $934
- Est. tax owed @ 24.0%
- −$224
- After-tax cash flow
- $1,764/yr
For passive investors: Depreciation is non-cash, so a rental often shows a tax loss while cash-flowing — sheltering income. Rental losses are passive: they offset passive income freely, and up to $25,000/yr can offset ordinary (W-2) income if you actively participate and your MAGI is under $100k (phasing out to $0 by $150k); unused losses carry forward. On sale, claimed depreciation is recaptured at up to 25%, and gains may owe capital-gains tax (a 1031 exchange can defer both). Figures are a year-1 estimate at your 24.0% rate — not tax advice; consult a CPA.
Schools (NCES district)
- District
- East Peoria Chsd 309
- NCES district ID
- 1713230
- Math proficiency
- 17% ▼ -6.00%
- Reading proficiency
- 15% ▼ -9.00%
- Median HH income
- $51,439
- Composite
- 14.75/100
- National rank
- #9394
- State rank
- #482 of 620 in IL
Livability — Creve Coeur
- Score
- 63/100
- State rank
- #755
- US rank
- #15292
Category grades
Schools grade is shown separately in the Schools card above.
Census & demographics
- Census place
- Creve Coeur, IL
- City population
- 4,572
- Population (ZIP)
- 4,572
Population outlook (Tazewell County) Hauer SSP2
- Today (2025)
- 131,252 people
- By 2030
- 128,028 · -2.5%
- By 2040
- 120,443 · -8.2%
- By 2050
- 111,872 · -14.8%
- By 2075
- 89,843 · -31.5%
- By 2100
- 66,468 · -49.4%
Race, ethnicity, and origin ACS 2023
- Neighborhood character
- Predominantly White (94%)
- Race & ethnicity
- White 94% Two or more races 3% Hispanic / Latino 2%
- Common ancestry
- Italian 12% Romanian 2% Lithuanian 1%
- Foreign-born
- 1% · Canada
- Languages at home
- 99% English-only · Spanish 1%
Political lean MEDSL · Tazewell
- 2024 margin
- Strong R (+26.7) · D 35.8% · R 62.5% · Other 1.8%
- 2008→2024 swing
- -20.6pp toward R · 2008: -6.0pp · 2024: -26.7pp
- All cycles
- 2024: R+26.7 2020: R+25.6 2016: R+28.5 2012: R+17.9 2008: R+6.0
Not yet ingested
- Civics
- —
Market trends
- HPI YoY
- ▼ -50.26%
- Current HPI
- 161.4938
- Rent YoY
- —
- Metro
- —
- State GDP YoY
- ▲ 1.59%
- F500 in state
- 60
Industry mix (Fortune 500 HQ in IL)
| Industry | F500 HQs | Revenue |
|---|---|---|
| Insurance | 4 | $201B |
|
||
| Consumer Goods | 4 | $87B |
|
||
| Industrial Machinery | 3 | $64B |
|
||
| Healthcare | 2 | $55B |
|
||
| Retail / Pharmacy | 1 | $148B |
|
||
| Agriculture / Food | 1 | $86B |
|
||
Price history
+349.7% since first listed8 events — show timeline
- 2026-05-19 Price Changed $67,000 RMLSA as Distributed by MLS Grid
- 2026-05-06 Relisted — RMLSA as Distributed by MLS Grid
- 2026-04-01 Contingent — RMLSA as Distributed by MLS Grid
- 2026-03-12 Listed $70,000 RMLSA as Distributed by MLS Grid
- 2007-07-21 Sold (MLS) $21,700 RMLSA as Distributed by MLS Grid
- 2007-05-22 Listed $23,000 RMLSA as Distributed by MLS Grid
- 2002-11-20 Sold (MLS) $13,500 RMLSA as Distributed by MLS Grid
- 2002-10-14 Listed $14,900 RMLSA as Distributed by MLS Grid
Property tax history
+0.4%/yrLatest (2024): $281 · +413.2% YoY. Source: county tax records.
Cash-flow waterfall
monthlySold comps — $/sqft
last 12 mo · ≤1 miLoading sold comps…