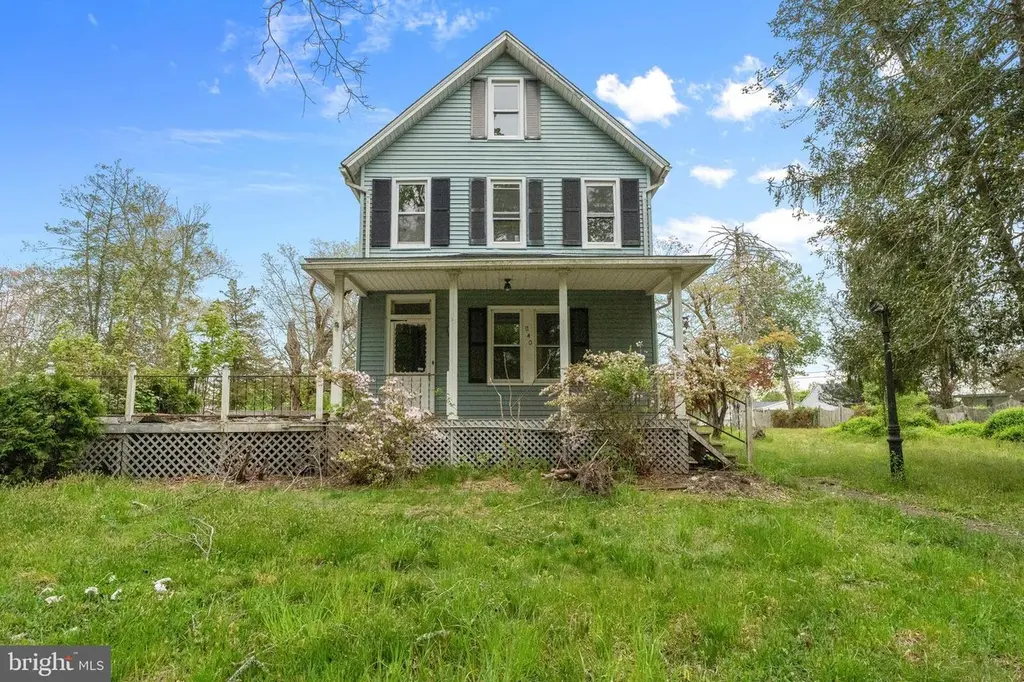
240 New York Ave · Egg Harbor City, NJ
Flood risk 1/10 · Minimal
- FEMA flood zone
- X
- Chance of flooding over 30 yrs
- 0.0%
- Est. flood insurance / yr
- $507 – $1,088
Fire risk 3/10 · Minor
- Est. fire insurance / yr
- $526 – $976
Heat risk 7/10 · Major
- Hot days now (above 102°F)
- 7 days/yr
- Hot days in 30 yrs
- 15 days/yr
Wind risk 7/10 · Major
- Chance of severe wind over 30 yrs
- 76.0%
Air-quality risk 3/10 · Minor
- Unhealthy air days now
- 1 days/yr
- Unhealthy air days in 30 yrs
- 4 days/yr
Risk factors via First Street. Map © Google.
Why this score? — see what drove the B+ grade
The composite is a weighted blend of 9 inputs, each scored 0–100. Each bar is that input's sub-score; the figure is the points it added to the 100-point composite (weight × sub-score).
- Cash flow +28.9/30.0
- ARV discount +15.0/15.0
- 1% rule +10.0/10.0
- DSCR +10.0/10.0
- Livability +3.3/5.0
- Schools +2.9/10.0
- Rent growth +2.5/5.0
- Condition / age +2.5/5.0
- Appreciation +0.0/10.0
$200,000
🖨 Deal sheet (PDF) 📄 Offer letter ✓ Due diligence
Listing remarks MLS
SELLER MAKES NO REPRESENTATIONS OR WARRENTIES AS TO THE CONDITION OF THE PROPERTY, IMPROVEMENTS OR APPURTENCES AND THAT THE PROPERTY IS BEING SOLD "AS IS -WHERE IS". Looking for a home in need of TLC? This is it! This older home is located on a very nice, older street in EHC. There's lots of room and great potential here. .. .Don't let this Bank Owned home slip through your fingers. .. . Property goes from street to terrace. Call today to view and make an offer!
Key facts
- 0.55 acre lot
- Built 1930
- Listed 7 days
Property features AI
Finance
- Other: Fee simple ownership; Finished area above grade approximately 2,220
Exterior
- Utilities: Public water; Public sewer
- Home design: Detached single-family; Estimated year built
- Construction: Frame construction; Brick/mortar foundation; Above-grade and below-grade structures
- Exterior features: Lot approximately 160 x 150; No tidal water
Interior
- Bedrooms: Four bedrooms on the upper level
- Bathrooms: One full bathroom
- Interior features: Unfinished basement
Neighborhood map
What this means for you Summary
Snapshot
- This is a 4-bed/1.0-bath single-family listed at $200k.
Deal economics
- At list price, monthly cash flow is $677 ($8k/yr) — positive.
- The deal already cash-flows at list — no discount required.
- Meets the 1% rule at list price ($3k rent vs $200k).
- Cap rate 10.4% vs local median 5.6% in Egg Harbor City — top-decile yield for the area; either an underpriced asset or a hidden risk that comps aren't pricing in. Stress-test before assuming the spread holds.
Location & tenants
- Location reads 66/100 on livability (#353 in NJ) — a middle-class / working-renter tenant base. Strengths: health & safety A, housing B+, crime B; Watch: employment D, amenities F.
- Greater Egg Harbor Regional High School District (suburban): math 16% / reading 49% proficiency, ranked #319 of 472 in NJ (top 68%) — families likely to look elsewhere, expect single-tenant / working-renter base with shorter leases.
- Zoned schools: Charles L. Spragg School (math 5% / reading 12%, grade F, #1,261 of 1,303 statewide, top 97%, 258 students, 66% FRL); Egg Harbor City Community School (math 4% / reading 23%, grade F, #420 of 431 statewide, top 98%, 295 students, 72% FRL); Cedar Creek High School (math 21% / reading 61%, grade F, #180 of 399 statewide, top 46%, 929 students, 40% FRL).
- Market conditions: 80 active listings in the ZIP; solid renter incomes; 672 units permitted in Atlantic County in 2024 (258 in 5+ unit buildings).
- At $3,155/mo this rent would consume 47% of the median local household income ($81k/yr) (locally 484% of renters already pay >50% of income on rent) — very limited rent-growth headroom before tenants either downsize or default.
Forward outlook
- Local home prices are declining (-3.0%/yr); year-one equity from $1k of loan paydown is wiped out by about $6k of value loss. Plan a longer hold.
- Atlantic County population projected at -12% by 2050 — secular population decline; favor cash flow + early exit over multi-decade hold.
- At projected returns (-3.0% appreciation + 3.0% rent growth), your $56k cash investment doubles in ~8 years — after that, you're playing with house money.
Negotiation context
- Only 7 days on market — expect competitive offers; lowballing is unlikely to land.
- 5 sale attempts since 21y ago with the ask held roughly flat each time — persistent listings suggest the price (not the market) is what's stuck; bring a comps-based counter.
- Current owner paid $126k; list at $200k implies a 58% gain — meaningful room to come down on a strong offer.
Risks & watch-outs
- Watch-outs: property tax is 4.1% of price; built in 1930 — expect roof / HVAC / electrical / plumbing capex.
- Climate carrying-cost: major wind risk, 76% chance of damaging wind over 30y; extreme-heat days projected 7→15/yr by 2055 (HVAC capex compounding) — expect insurance premiums to compound above CPI over the hold.
Questions for the listing agent
- Built in 1930 — when were the roof, HVAC, electrical panel, plumbing, and water heater last replaced?
- Property tax is high relative to price — has the assessment been appealed recently, and will the sale trigger a re-assessment?
- Is there a deadline driving the sale (1031 exchange, divorce, estate, relocation)? That informs how much negotiation room exists.
- Schools are F-rated, which usually means shorter tenancies and higher turnover. Who's the typical renter profile here, and what's been the actual vacancy rate?
- What's the average days-on-market for RENTAL listings here right now (not sales)? A rising rental-DOM trend means longer vacancies and softer asking-rent achievability than the comps imply.
- What's the recent tenant-quality profile in this submarket — average credit score on applications, eviction rate, late-payment / NSF rate, and stable-employment percentage? A property-management company in the area should have these aggregated.
- How much new for-sale + rental construction is in the pipeline within 1–3 miles? Heavy new supply typically softens prices + rents 12–24 months out; constrained supply supports both.
Investment metrics
- 1% rule
- 1.58% ✓
- Cap rate
- 10.36%
- Cash-on-cash
- 14.52%
- DSCR
- 1.65
- GRM
- 5.3
CMA / ARV
- ARV (on-the-fly)
- $341,880
- Comps found
- 6
Show comp detail 6 sales within ~0.75 mi
| Address | Dist | Beds/Ba | Sqft | Sold | Price | $/sf | Match |
|---|---|---|---|---|---|---|---|
| 134 Buffalo Ave | 0.56mi | 4/2.0 | 1,957 (-12%) | 6mo | $400,000 | $204 | 46 |
| 253 9th Ter | 0.63mi | 5/2.5 (+1) | 2,224 (+0%) | 18mo | $279,900 | $126 | 44 |
| 119 Buffalo Ave | 0.53mi | 5/2.5 (+1) | 2,496 (+12%) | 4mo | $385,000 | $154 | 40 |
| 201 St Louis Ave | 0.67mi | 4/2.0 | 1,887 (-15%) | 1mo | $276,500 | $147 | 39 |
| 403 Saint Louis Ave Ave | 0.68mi | 3/1.5 (-1) | 2,400 (+8%) | 11mo | $315,000 | $131 | 38 |
| 530 S Cincinnati Ave | 0.72mi | 5/3.5 (+1) | 2,469 (+11%) | 9mo | $480,000 | $194 | 25 |
Match score weights: distance 35% · size 25% · config 20% · recency 20%. Top-matched comps best support the ARV.
Projected returns pro-forma
-3.0% appreciation · 3.0% rent growth · sell at horizon
- IRR
- 5.1%
- Equity multiple
- 1.20×
- Total profit
- $11,051
- Equity at exit
- $29,821
- IRR
- 14.6%
- Equity multiple
- 2.19×
- Total profit
- $66,454
- Equity at exit
- $17,292
Cash invested: $56,000 (down + closing). Projections, not guarantees.
Landlord ↔ Tenant lean methodology
- Overall (STATE)
- 21 Tenant-Leaning
- State New Jersey
- 21 Tenant-Leaning · D+6
- County
- — inherits STATE
- City
- — inherits STATE
ZIP-level market 08215
- Home prices YoY
- -22.4%
- Active inventory
- 80
- Price-to-rent
- 5.3×
Monthly cashflow live
- Estimated rent
- $3,155 medium interval (Pro) →
- Mortgage (P&I)
- −$1,049
- Tax from tax record
- −$683 /mo · $8,191/yr
- Insurance
- −$83
- HOA
- −$0
- Lot rent
- −$0
- Vacancy / Maint / Mgmt
- −$662
- Net cashflow
- $677
Break-even live
Sensitivity live
| Price | -10% $791 | -5% $734 | +0% $677 | +5% $621 | +10% $564 |
|---|---|---|---|---|---|
| Rent | -10% $428 | -5% $553 | +0% $677 | +5% $802 | +10% $927 |
| Rate | -1.0pp $778 | -0.5pp $728 | base $677 | +0.5pp $626 | +1.0pp $573 |
UW: 25.0% down · 7.5% · 30yr · 1.5% tax · 5.0% vac · 8.0% maint · 8.0% mgmt
Financing live
Cash to close
- Down payment
- $50,000
- Closing costs
- $6,000
- Reserves months
- —
- Total cash needed
- —
Loan-product check · same deal, 3 products live
Conventional
25% down · 7.5% · 30yr
- Down + closing
- —
- Monthly P&I
- —
- Monthly cashflow
- —
- DSCR
- —
- Eligible?
- —
Personal DTI + credit; lowest rate.
DSCR
20% down · 8.5% · 30yr
- Down + closing
- —
- Monthly P&I
- —
- Monthly cashflow
- —
- DSCR
- —
- Eligible?
- —
No personal income docs; deal must DSCR.
Hard money
10% down · 12.0% · 12mo
- Down + closing
- —
- Monthly P&I
- —
- Monthly cashflow
- —
- DSCR
- —
- Eligible?
- —
Short-term bridge; refi at stabilization.
Listing history 36 events
-
2026-06-23days on market $200,000 Active 7 DOM
-
2026-06-22days on market $200,000 Active 6 DOM
-
2026-06-19days on market $200,000 Active 4 DOM
-
2026-06-18days on market $200,000 Active 3 DOM
-
2026-06-17days on market $200,000 Active 2 DOM
-
2026-06-16remarks 528-char remark
-
2026-06-16pricedays on market $200,000 Active 1 DOM
-
2026-06-15days on market $225,000 Active 42 DOM
-
2026-06-14days on market $225,000 Active 40 DOM
-
2026-06-13days on market $225,000 Active 39 DOM
-
2026-06-10days on market $225,000 Active 37 DOM
-
2026-06-09days on market $225,000 Active 36 DOM
-
2026-06-08days on market $225,000 Active 35 DOM
-
2026-06-07pricedays on market $225,000 Active 34 DOM
-
2026-06-02days on market $230,000 Active 29 DOM
-
2026-06-01days on market $230,000 Active 28 DOM
-
2026-05-31days on market $230,000 Active 27 DOM
-
2026-05-30days on market $230,000 Active 26 DOM
-
2026-05-20price $239,000 206-char remark
-
2026-05-05$240,000 Active 206-char remark
-
2026-04-30historical $240,000 206-char remark
-
2011-07-19soldstatus $126,199
-
2011-07-08soldstatus $126,000 476-char remark
Show marketing remark (476 chars)
SELLER MAKES NO REPRESENTATIONS OR WARRENTIES AS TO THE CONDITION OF THE PROPERTY, IMPROVEMENTS OR APPURTENCES AND THAT THE PROPERTY IS BEING SOLD "AS IS -WHERE IS". Looking for a home in need of TLC? This is it! This older home is located on a very nice, older street in EHC. There's lots of room and great potential here. .. .Don't let this Bank Owned home slip through your fingers. .. . Property goes from street to terrace. Call today to view and make an offer!
-
2011-07-05historical 476-char remark
Show marketing remark (476 chars)
SELLER MAKES NO REPRESENTATIONS OR WARRENTIES AS TO THE CONDITION OF THE PROPERTY, IMPROVEMENTS OR APPURTENCES AND THAT THE PROPERTY IS BEING SOLD "AS IS -WHERE IS". Looking for a home in need of TLC? This is it! This older home is located on a very nice, older street in EHC. There's lots of room and great potential here. .. .Don't let this Bank Owned home slip through your fingers. .. . Property goes from street to terrace. Call today to view and make an offer!
-
2011-05-11$137,000 476-char remark
Show marketing remark (476 chars)
SELLER MAKES NO REPRESENTATIONS OR WARRENTIES AS TO THE CONDITION OF THE PROPERTY, IMPROVEMENTS OR APPURTENCES AND THAT THE PROPERTY IS BEING SOLD "AS IS -WHERE IS". Looking for a home in need of TLC? This is it! This older home is located on a very nice, older street in EHC. There's lots of room and great potential here. .. .Don't let this Bank Owned home slip through your fingers. .. . Property goes from street to terrace. Call today to view and make an offer!
-
2011-04-19historical
-
2011-01-18$147,000
-
2011-01-12soldstatus $100
-
2006-02-06soldstatus $235,000
-
2006-01-31soldstatus $235,000
-
2005-12-27historical
-
2005-08-01$250,000
-
1994-01-25soldstatus $95,000
-
1983-10-01soldstatus $55,000
-
1980-08-01soldstatus $32,000
-
1980-04-01soldstatus $22,500
ⓘ Source: listings_history table (triggers on properties + properties_extension) + one-shot
backfill from property_details.listing_events for pre-trigger history.
Tax reassessment forecast NJ · Partial reset (capped growth)
- Current annual tax
- $8,191 · $683/mo
- Projected year-2 tax
- $8,191 · $683/mo
- Expected delta
- $0/yr ($0/mo · 0.0%)
ⓘ Screening estimate from a state-policy table — verify with the county assessor before closing.
Climate risk First Street
- Flood 1/10 Low FEMA zone X · 0% chance over 30 yrs
- Wildfire 3/10 Moderate
- Heat 7/10 Severe 7 d/yr ≥102°F today · 15 d/yr by 30 yrs out
- Wind 7/10 Severe 76% chance of damaging wind over 30 yrs
- Air quality 3/10 Moderate 1 unhealthy d/yr today · 4 by 30 yrs out
Nearby sold comps map
Loading sold comps map…
Walkable amenities ~0.75 mi
Loading nearby amenities…
Taxation est. · year 1
- Rental income
- $37,855
- − Mortgage interest
- −$11,203
- − Property taxes
- −$8,191
- − Insurance
- −$1,000
- − Repairs & maintenance
- −$3,028
- − Management
- −$3,028
- − Depreciation
- −$5,818
- Taxable income
- $5,587
- Est. tax owed @ 24.0%
- −$1,341
- After-tax cash flow
- $6,788/yr
For passive investors: Depreciation is non-cash, so a rental often shows a tax loss while cash-flowing — sheltering income. Rental losses are passive: they offset passive income freely, and up to $25,000/yr can offset ordinary (W-2) income if you actively participate and your MAGI is under $100k (phasing out to $0 by $150k); unused losses carry forward. On sale, claimed depreciation is recaptured at up to 25%, and gains may owe capital-gains tax (a 1031 exchange can defer both). Figures are a year-1 estimate at your 24.0% rate — not tax advice; consult a CPA.
Schools (NCES district)
- District
- Greater Egg Harbor Regional High School District
- NCES district ID
- 3406060
- Math proficiency
- 16% ▼ -13.00%
- Reading proficiency
- 49% ▲ 2.00%
- Median HH income
- $58,324
- Composite
- 28.94/100
- National rank
- #6629
- State rank
- #319 of 472 in NJ
Livability — Egg Harbor City
- Score
- 66/100
- State rank
- #353
- US rank
- #11600
Category grades
Schools grade is shown separately in the Schools card above.
Census & demographics
- Census place
- Egg Harbor City, NJ
- County
- Atlantic County · 143,611 people
- City population
- 13,545
- Metro
- Atlantic City-Hammonton, NJ
- Population (ZIP)
- 13,545
- Household income
- $80,893
- Rent vs Own
- Severe rent burden
- 484.0
Population outlook (Atlantic County) Hauer SSP2
- Today (2025)
- 268,948 people
- By 2030
- 264,497 · -1.7%
- By 2040
- 252,261 · -6.2%
- By 2050
- 237,846 · -11.6%
- By 2075
- 210,650 · -21.7%
- By 2100
- 180,234 · -33.0%
Race, ethnicity, and origin ACS 2023
- Neighborhood character
- Predominantly White (67%)
- Race & ethnicity
- White 67% Black 19% Hispanic / Latino 12% Two or more races 6%
- Hispanic origin (detail)
- Mexican 1% Puerto Rican 7% Dominican 2%
- Common ancestry
- Romanian 6% Slovak 2% Lithuanian 2%
- Foreign-born
- 6% · Canada
- Languages at home
- 88% English-only · Spanish 6% Russian/Polish/Slavic 2% Other Indo-European 1%
Political lean MEDSL · Atlantic
- 2024 margin
- Toss-up / Even · D 47.7% · R 50.7% · Other 1.6%
- 2008→2024 swing
- -18.1pp toward R · 2008: 15.1pp · 2024: -3.0pp
- All cycles
- 2024: R+3.0 2020: D+6.7 2016: D+6.2 2012: D+17.2 2008: D+15.1
Not yet ingested
- Civics
- —
Market trends
- HPI YoY
- ▼ -76.92%
- Current HPI
- 267.2078
- Rent YoY
- —
- Metro
- Atlantic City-Hammonton, NJ
- State GDP YoY
- ▲ 2.05%
- F500 in state
- 34
Industry mix (Fortune 500 HQ in NJ)
| Industry | F500 HQs | Revenue |
|---|---|---|
| Consumer Goods | 3 | $31B |
|
||
| Pharmaceuticals | 2 | $153B |
|
||
| Technology | 2 | $21B |
|
||
| Insurance | 2 | $20B |
|
||
| Healthcare | 2 | $19B |
|
||
| Financial Services | 1 | $70B |
|
||
Price history
+788.9% since first listed22 events — show timeline
- 2026-06-15 Listing Removed — BRIGHT MLS
- 2026-06-15 Listed $200,000 BRIGHT MLS
- 2026-06-03 Price Changed $225,000 BRIGHT MLS
- 2026-05-26 Price Changed $230,000 BRIGHT MLS
- 2026-05-20 Price Changed $239,000 BRIGHT MLS
- 2026-05-05 Listed $240,000 BRIGHT MLS
- 2026-04-30 Coming Soon — BRIGHT MLS
- 2011-07-19 Sold (Public Records) $126,199 Public Records
- 2011-07-08 Sold (MLS) $126,000 SJSRMLS
- 2011-07-05 Listing Removed — SJSRMLS
- 2011-05-11 Listed $137,000 SJSRMLS
- 2011-04-19 Listing Removed — SJSRMLS
- 2011-01-18 Listed $147,000 SJSRMLS
- 2011-01-12 Sold (Public Records) $100 Public Records
- 2006-02-06 Sold (Public Records) $235,000 Public Records
- 2006-01-31 Sold (MLS) $235,000 SJSRMLS
- 2005-12-27 Listing Removed — SJSRMLS
- 2005-08-01 Listed $250,000 SJSRMLS
- 1994-01-25 Sold (Public Records) $95,000 Public Records
- 1983-10-01 Sold (Public Records) $55,000 Public Records
- 1980-08-01 Sold (Public Records) $32,000 Public Records
- 1980-04-01 Sold (Public Records) $22,500 Public Records
Property tax history
+1.2%/yrLatest (2025): $8,191 · +1.6% YoY. Source: county tax records.
Cash-flow waterfall
monthlySold comps — $/sqft
last 12 mo · ≤1 miLoading sold comps…