19850 E Arrow Hwy · Charter Oak, CA
Flood risk 4/10 · Minor
- FEMA flood zone
- X (unshaded)
- Chance of flooding over 30 yrs
- 0.22%
- Est. flood insurance / yr
- $507 – $1,088
Fire risk 6/10 · Moderate
- Est. fire insurance / yr
- $659 – $1,223
Heat risk 7/10 · Major
- Hot days now (above 98°F)
- 7 days/yr
- Hot days in 30 yrs
- 20 days/yr
Wind risk 1/10 · Minimal
- Chance of severe wind over 30 yrs
- —
Air-quality risk 7/10 · Major
- Unhealthy air days now
- 15 days/yr
- Unhealthy air days in 30 yrs
- 17 days/yr
Risk factors via First Street. Map © Google.
Why this score? — see what drove the C+ grade
The composite is a weighted blend of 9 inputs, each scored 0–100. Each bar is that input's sub-score; the figure is the points it added to the 100-point composite (weight × sub-score).
- Cash flow +30.0/30.0
- 1% rule +10.0/10.0
- DSCR +10.0/10.0
- Schools +4.7/10.0
- Condition / age +3.8/5.0
- Livability +3.2/5.0
- Rent growth +2.5/5.0
- ARV discount +0.0/15.0
- Appreciation +0.0/10.0
$149,000
🖨 Deal sheet (PDF) 📄 Offer letter ✓ Due diligence
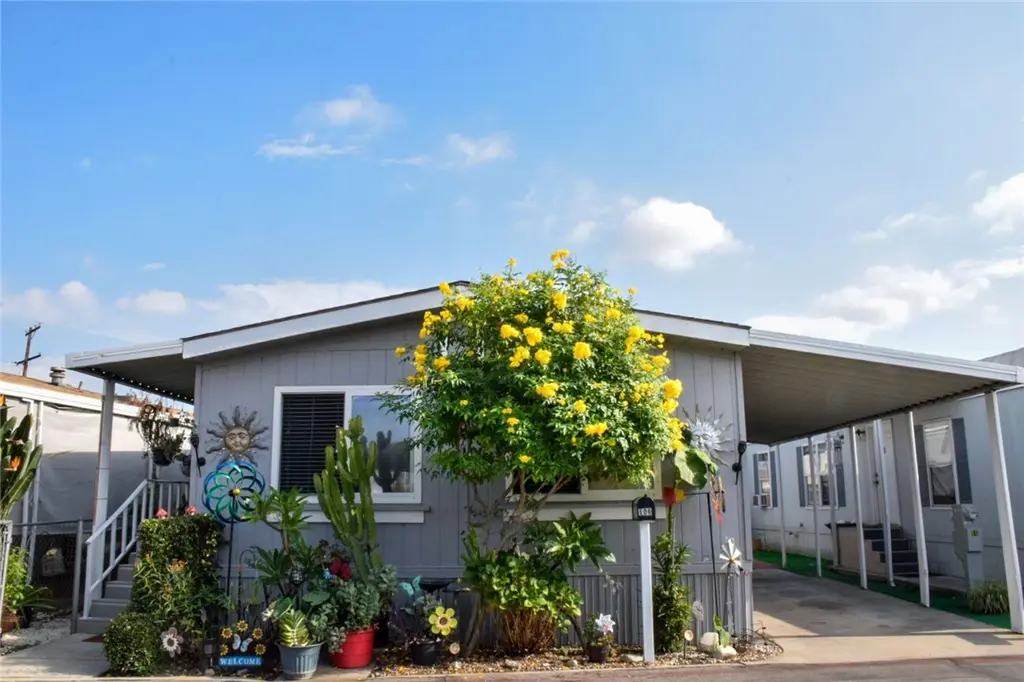
Listing remarks
Looking for a turn-key home? This may be the gem you are looking for. Centrally located in the City of Covina is this well cared for and loved home. This home includes newer floors with plywood subfloors; remodeled kitchen; new garbage disposal; GFI’s installed; newer furnace and AC; new toilets; dual pane windows; indoor laundry; storage shed; 3 car carport; gated yard for kids and/or pets; stepping stones; space for plants and bbq; gutters and downspouts; new roof and more. The community welcomes all ages, is well maintained and includes amenities like a swimming pool and club house. Close to freeways, transportation, schools, shopping and more. Set your appointment today!
Key facts
- New garbage disposal
- New toilets
- Newer furnace
Tags
Property features AI
Finance
- Other: Accessible parking available; Access via city streets; Directions available to property
- Financial info: Monthly land lease of $1,436.92 (park-managed)
- HOA & community: Park name: Arrow Glen Manor; Manager approval required for multi-unit; Pets allowed with breed restrictions
Exterior
- Parking: Covered parking; Parking available in Arrow Glen Manor
- Utilities: Public sewer; District/public water
- Home design: Single-story home; Entry at ground level; Mobile home model: Somerset; Mobile home remains on site
- Construction: Turnkey condition; Mobile home dimensions approximately 20' x 48'; Year built (source: public records)
- Exterior features: Community pool; Yard; Street lighting; Has a view
Interior
- Bathrooms: 2 full bathrooms
- Heating & cooling: Central cooling; Central furnace heating
- Interior features: Ceiling fan
- Laundry & utility: Laundry inside the home
Neighborhood map
What this means for you Summary
Snapshot
- This is a 2-bed/2.0-bath manufactured listed at $149k. Condition is rated good.
Deal economics
- At list price, monthly cash flow is $919 ($11k/yr) — positive.
- The deal already cash-flows at list — no discount required.
- Meets the 1% rule at list price ($2k rent vs $149k).
- Recommended offer: $145k (3.0% below list) — sets the bar for market timing.
- Cap rate 13.7% vs local median 3.0% in Charter Oak — top-decile yield for the area; either an underpriced asset or a hidden risk that comps aren't pricing in. Stress-test before assuming the spread holds.
Location & tenants
- Location reads 63/100 on livability (#452 in CA) — a middle-class / working-renter tenant base. Strengths: commute A, employment B; Watch: crime D+, amenities F, cost of living F.
- Charter Oak Unified (suburban): math 45% / reading 55% proficiency, ranked #387 of 1,400 in CA (top 28%) — acceptable for families but not a draw, mixed tenant base, ~2y average lease.
- Zoned schools: Cedargrove Elementary (563 students, 67% FRL); Royal Oak Middle (622 students, 66% FRL); Charter Oak High (math 46% / reading 57%, grade D+, #312 of 1,170 statewide, top 27%, 1,329 students, 61% FRL) — zoned schools average 65% FRL vs 43% district-wide (21 pts higher); higher-poverty schools than district average — tighter screening recommended.
- Market conditions: 66 active listings in the ZIP; 8 comparable units currently listed for rent nearby; rentals leasing fast (median 6d on market — plan ~1-2 weeks tenant-placement turnaround); solid renter incomes; 19,697 units permitted in Los Angeles County in 2024 (9,426 in 5+ unit buildings).
Forward outlook
- Local home prices are declining (-3.0%/yr); year-one equity from $1k of loan paydown is wiped out by about $4k of value loss. Plan a longer hold.
- Los Angeles County population projected at +9% by 2050 — modest demand growth; plan on rents tracking national, not racing it.
- At projected returns (-3.0% appreciation + 3.0% rent growth), your $42k cash investment doubles in ~5 years — after that, you're playing with house money.
Negotiation context
- It's been on market 58 days — a 3% lower offer ($145k) is reasonable based on typical stale-listing flexibility.
- 7 sale attempts since 17y ago with the ask held roughly flat each time — persistent listings suggest the price (not the market) is what's stuck; bring a comps-based counter.
Risks & watch-outs
- Climate carrying-cost: major wildfire risk; extreme-heat days projected 7→20/yr by 2055 (HVAC capex compounding) — expect insurance premiums to compound above CPI over the hold.
Questions for the listing agent
- It's been on market 58 days. Have you received any prior offers? Is the seller open to a 3% concession, seller financing, or rate buy-down credit?
- Is there a deadline driving the sale (1031 exchange, divorce, estate, relocation)? That informs how much negotiation room exists.
- Schools are A-rated — typically a magnet for longer-tenancy family renters. What's the average tenant stay here, and is there a school-zone premium baked into asking?
- Crime grade is D in this area — have there been break-ins, vandalism, or insurance claims at this property in the last 3 years? What carrier currently insures it and at what premium?
- What's the average days-on-market for RENTAL listings here right now (not sales)? A rising rental-DOM trend means longer vacancies and softer asking-rent achievability than the comps imply.
- What's the recent tenant-quality profile in this submarket — average credit score on applications, eviction rate, late-payment / NSF rate, and stable-employment percentage? A property-management company in the area should have these aggregated.
- How much new for-sale + rental construction is in the pipeline within 1–3 miles? Heavy new supply typically softens prices + rents 12–24 months out; constrained supply supports both.
Investment metrics
- 1% rule
- 1.66% ✓
- Cap rate
- 13.70%
- Cash-on-cash
- 26.44%
- DSCR
- 2.18
- GRM
- 5.0
CMA / ARV
- ARV (median comp)
- $102,450
- List price
- $149,000
- Delta
- 45.44%
- Verdict
- OVERPRICED
- Comps
- 6 within 1.0 mi
Show comp detail 1 sale within ~0.75 mi
| Address | Dist | Beds/Ba | Sqft | Sold | Price | $/sf | Match |
|---|---|---|---|---|---|---|---|
| 19548 E Cypress St #40 | 0.74mi | 1/1.0 (-1) | 480 (-11%) | 21mo | $80,000 | $167 | 20 |
Match score weights: distance 35% · size 25% · config 20% · recency 20%. Top-matched comps best support the ARV.
Projected returns pro-forma
-3.0% appreciation · 3.0% rent growth · sell at horizon
- IRR
- 20.3%
- Equity multiple
- 1.83×
- Total profit
- $34,433
- Equity at exit
- $22,216
- IRR
- 28.5%
- Equity multiple
- 3.53×
- Total profit
- $105,515
- Equity at exit
- $12,883
Cash invested: $41,720 (down + closing). Projections, not guarantees.
Landlord ↔ Tenant lean methodology
- Overall (STATE)
- 18 Strongly Tenant-Friendly
- State California
- 18 Strongly Tenant-Friendly · D+13
- County
- — inherits STATE
- City
- — inherits STATE
ZIP-level market 91724
- Active inventory
- 66
- Price-to-rent
- 5.0×
Monthly cashflow live
- Estimated rent
- $2,467 high interval (Pro) →
- Mortgage (P&I)
- −$781
- Tax est. 1.5%
- −$186 /mo · $2,235/yr
- Insurance
- −$62
- HOA
- −$0
- Vacancy / Maint / Mgmt
- −$518
- Net cashflow
- $919
Break-even live
Sensitivity live
| Price | -10% $1,022 | -5% $971 | +0% $919 | +5% $868 | +10% $816 |
|---|---|---|---|---|---|
| Rent | -10% $724 | -5% $822 | +0% $919 | +5% $1,017 | +10% $1,114 |
| Rate | -1.0pp $994 | -0.5pp $957 | base $919 | +0.5pp $881 | +1.0pp $841 |
UW: 25.0% down · 7.5% · 30yr · 1.5% tax · 5.0% vac · 8.0% maint · 8.0% mgmt
Financing live
Cash to close
- Down payment
- $37,250
- Closing costs
- $4,470
- Reserves months
- —
- Total cash needed
- —
Loan-product check · same deal, 3 products live
Conventional
25% down · 7.5% · 30yr
- Down + closing
- —
- Monthly P&I
- —
- Monthly cashflow
- —
- DSCR
- —
- Eligible?
- —
Personal DTI + credit; lowest rate.
DSCR
20% down · 8.5% · 30yr
- Down + closing
- —
- Monthly P&I
- —
- Monthly cashflow
- —
- DSCR
- —
- Eligible?
- —
No personal income docs; deal must DSCR.
Hard money
10% down · 12.0% · 12mo
- Down + closing
- —
- Monthly P&I
- —
- Monthly cashflow
- —
- DSCR
- —
- Eligible?
- —
Short-term bridge; refi at stabilization.
Rent comps 8 comps
| Address | Beds | Baths | Sqft | Rent | $/sqft | DOM | Units | Dist |
|---|---|---|---|---|---|---|---|---|
| 1400 N Grand Ave Covina, CA | 1.0–2.0 | 1.0–2.0 | 846 | $2,720 | $3.22 | 3d | 5 | 0.48mi |
| 440 W Gladstone St Glendora, CA | 1.0–2.0 | 1.0–2.0 | 875 | $2,390 | $2.73 | 0d | 8 | 0.70mi |
| 711 Claraday St Unit A Glendora, CA | 2.0 | 1.0 | 750 | $2,250 | $3.00 | 45d | 1 | 0.81mi |
| 21042 E Arrow Hwy Covina, CA | 1.0–2.0 | 1.0–2.0 | 803 | $2,875 | $3.58 | 0d | 8 | 1.12mi |
| 826 N Barranca Ave Covina, CA | 1.0–2.0 | 1.0–2.0 | 762 | $2,295 | $3.01 | 45d | 2 | 1.19mi |
| 1000 S Glendora Ave Glendora, CA | 1.0 | 1.0 | 551 | $1,820 | $3.30 | 3d | 1 | 1.19mi |
| 18615 E Arrow Hwy Covina, CA | 1.0 | 1.0 | 619 | $1,976 | $3.19 | 12d | 2 | 1.37mi |
| 18537 E Arrow Hwy Covina, CA | 1.0–2.0 | 1.0–2.5 | 937 | $2,650 | $2.83 | 6d | 7 | 1.40mi |
Listing history 31 events
-
2026-06-21days on market $149,000 Active 58 DOM
-
2026-06-18days on market $149,000 Active 55 DOM
-
2026-06-17days on market $149,000 Active 54 DOM
-
2026-06-16days on market $149,000 Active 53 DOM
-
2026-06-15days on market $149,000 Active 52 DOM
-
2026-06-13days on market $149,000 Active 50 DOM
-
2026-06-13days on market $149,000 Active 49 DOM
-
2026-06-09days on market $149,000 Active 46 DOM
-
2026-06-08days on market $149,000 Active 45 DOM
-
2026-06-07days on market $149,000 Active 44 DOM
-
2026-06-04days on market $149,000 Active 41 DOM
-
2026-06-03days on market $149,000 Active 40 DOM
-
2026-06-02days on market $149,000 Active 39 DOM
-
2026-06-01days on market $149,000 Active 38 DOM
-
2026-05-31days on market $149,000 Active 37 DOM
-
2026-04-24$149,000 Active 689-char remark
-
2023-08-31historical
-
2023-08-23status Active
-
2023-08-02historical Active Under Contract
-
2023-07-14price $134,999
-
2023-06-26status Active
-
2023-06-12historical Active Under Contract
-
2023-06-06price $139,900
-
2023-05-12status Active
-
2023-05-08historical Active Under Contract
-
2023-04-18status Active
-
2023-04-13historical Active Under Contract
-
2023-03-27price $150,000
-
2023-02-20$165,000 Active
-
2009-02-24historical
-
2009-02-24$119,000
ⓘ Source: listings_history table (triggers on properties + properties_extension) + one-shot
backfill from property_details.listing_events for pre-trigger history.
Climate risk First Street
- Flood 4/10 Moderate FEMA zone X (unshaded) · 22% chance over 30 yrs
- Wildfire 6/10 Major
- Heat 7/10 Severe 7 d/yr ≥98°F today · 20 d/yr by 30 yrs out
- Wind 1/10 Low
- Air quality 7/10 Severe 15 unhealthy d/yr today · 17 by 30 yrs out
Nearby sold comps map
Loading sold comps map…
Walkable amenities ~0.75 mi
Loading nearby amenities…
Taxation est. · year 1
- Rental income
- $29,603
- − Mortgage interest
- −$8,346
- − Property taxes
- −$2,235
- − Insurance
- −$745
- − Repairs & maintenance
- −$2,368
- − Management
- −$2,368
- − Depreciation
- −$4,335
- Taxable income
- $9,205
- Est. tax owed @ 24.0%
- −$2,209
- After-tax cash flow
- $8,820/yr
For passive investors: Depreciation is non-cash, so a rental often shows a tax loss while cash-flowing — sheltering income. Rental losses are passive: they offset passive income freely, and up to $25,000/yr can offset ordinary (W-2) income if you actively participate and your MAGI is under $100k (phasing out to $0 by $150k); unused losses carry forward. On sale, claimed depreciation is recaptured at up to 25%, and gains may owe capital-gains tax (a 1031 exchange can defer both). Figures are a year-1 estimate at your 24.0% rate — not tax advice; consult a CPA.
Condition & rehab AI · 12 photos
This well-maintained 1985 manufactured home is move-in ready with updated kitchens and bathrooms, new flooring, and a good exterior. Minor exterior painting and light fixture replacement would further enhance its curb appeal and value.
Value-add opportunities
- Resale Paint exterior trim — Enhances curb appeal and value.
- Resale Replace outdoor light fixtures — Improves curb appeal and safety.
Renovation cost estimate screening
Value-add ROI direction
- Resale Paint exterior trim — Enhances curb appeal and value. ↑
- Resale Replace outdoor light fixtures — Improves curb appeal and safety. ↑
ⓘ Cost ranges are severity-bucket heuristics (US national rule-of-thumb). Get contractor quotes + a written scope before underwriting a rehab budget.
Schools (NCES district)
- District
- Charter Oak Unified
- NCES district ID
- 0608190
- Math proficiency
- 45% ▲ 2.00%
- Reading proficiency
- 55% ▲ 4.00%
- Median HH income
- $72,756
- Composite
- 46.95/100
- National rank
- #5160
- State rank
- #387 of 1400 in CA
Livability — Charter Oak
- Score
- 63/100
- State rank
- #452
- US rank
- #15268
Category grades
Schools grade is shown separately in the Schools card above.
Census & demographics
- Census place
- Charter Oak, CA
- County
- Los Angeles County · 9,444,647 people
- Metro
- Los Angeles-Long Beach-Anaheim, CA
- Population (ZIP)
- 28,352
- Household income
- $103,163
- Rent vs Own
- Severe rent burden
- 550.0
Population outlook (Los Angeles County) Hauer SSP2
- Today (2025)
- 10,940,515 people
- By 2030
- 11,256,481 · +2.9%
- By 2040
- 11,729,929 · +7.2%
- By 2050
- 11,948,407 · +9.2%
- By 2075
- 11,818,114 · +8.0%
- By 2100
- 10,842,928 · -0.9%
Race, ethnicity, and origin ACS 2023
- Neighborhood character
- Diverse neighborhood (Simpson 0.63)
- Race & ethnicity
- Hispanic / Latino 55% White 22% Two or more races 19% Asian 14% Black 5% Native American 2%
- Hispanic origin (detail)
- Mexican 44%
- Common ancestry
- Portuguese 1% Slovak 1% Iranian 1%
- Foreign-born
- 24% · Canada, China, Vietnam
- Languages at home
- 53% English-only · Spanish 33% Chinese 5% Tagalog/Filipino 3%
Political lean MEDSL · Los Angeles
- 2024 margin
- Solid D (+32.9) · D 64.8% · R 31.9% · Other 3.3%
- 2008→2024 swing
- -7.4pp toward R · 2008: 40.4pp · 2024: 32.9pp
- All cycles
- 2024: D+32.9 2020: D+44.2 2016: D+48.0 2012: D+40.0 2008: D+40.4
Not yet ingested
- Civics
- —
Market trends
- HPI YoY
- ▼ -732.51%
- Current HPI
- 370.5956
- Rent YoY
- —
- Metro
- Los Angeles-Long Beach-Anaheim, CA
- State GDP YoY
- ▲ 3.21%
- F500 in state
- 116
Industry mix (Fortune 500 HQ in CA)
| Industry | F500 HQs | Revenue |
|---|---|---|
| Technology | 27 | $1,492B |
|
||
| Financial Services | 3 | $174B |
|
||
| Retail | 3 | $44B |
|
||
| Insurance | 3 | $26B |
|
||
| Media / Entertainment | 2 | $115B |
|
||
| Pharmaceuticals / Biotech | 2 | $62B |
|
||
Price history
+25.2% since first listed16 events — show timeline
- 2026-04-24 Listed $149,000 CRMLS
- 2023-08-31 Listing Removed — CRMLS
- 2023-08-23 Relisted — CRMLS
- 2023-08-02 Contingent — CRMLS
- 2023-07-14 Price Changed $134,999 CRMLS
- 2023-06-26 Relisted — CRMLS
- 2023-06-12 Contingent — CRMLS
- 2023-06-06 Price Changed $139,900 CRMLS
- 2023-05-12 Relisted — CRMLS
- 2023-05-08 Contingent — CRMLS
- 2023-04-18 Relisted — CRMLS
- 2023-04-13 Contingent — CRMLS
- 2023-03-27 Price Changed $150,000 CRMLS
- 2023-02-20 Listed $165,000 CRMLS
- 2009-02-24 Listed $119,000 CRMLS
- 2009-02-24 Listing Removed — CRMLS
Property tax history
+6.8%/yrLatest (2025): $148 · +6.8% YoY. Source: county tax records.
Cash-flow waterfall
monthlySold comps — $/sqft
last 12 mo · ≤1 miLoading sold comps…