 Multi-family
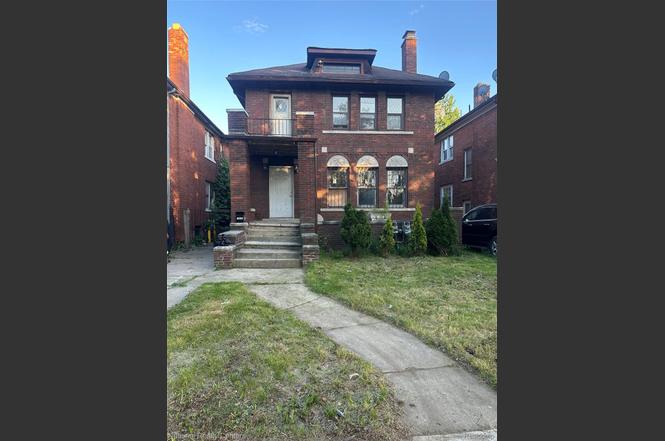
4353 W Buena Vista St · Detroit, MI
Flood risk 1/10 · Minimal
- FEMA flood zone
- X (unshaded)
- Chance of flooding over 30 yrs
- 0.0%
- Est. flood insurance / yr
- $473 – $860
Fire risk 1/10 · Minimal
- Est. fire insurance / yr
- $784 – $1,456
Heat risk 3/10 · Minor
- Hot days now (above 97°F)
- 7 days/yr
- Hot days in 30 yrs
- 15 days/yr
Wind risk 2/10 · Minimal
- Chance of severe wind over 30 yrs
- —
Air-quality risk 4/10 · Minor
- Unhealthy air days now
- 4 days/yr
- Unhealthy air days in 30 yrs
- 6 days/yr
Risk factors via First Street. Map © Google.
Why this score? — see what drove the B+ grade
The composite is a weighted blend of 9 inputs, each scored 0–100. Each bar is that input's sub-score; the figure is the points it added to the 100-point composite (weight × sub-score).
- Cash flow +30.0/30.0
- ARV discount +15.0/15.0
- 1% rule +10.0/10.0
- DSCR +10.0/10.0
- Rent growth +4.0/5.0
- Livability +3.7/5.0
- Condition / age +2.5/5.0
- Schools +1.3/10.0
- Appreciation +0.0/10.0
$108,800
🖨 Deal sheet (PDF) 📄 Offer letter ✓ Due diligence
Multi-family units
County records classify this as Multi-Family (2-4 Unit). Listing-text estimate: 1 unit. estimate disagrees with records
Listing remarks MLS
Welcome to 4353 Buena Vista, a classic brick multi-family property nestled in Detroit's highly sought-after Russell Woods neighborhood. Built in 1926, this spacious property offers approximately 2,600 square feet of living space, timeless architectural character, and strong income-producing potential. The building features separate living areas, hardwood charm, fireplaces, a basement, and garage space, making it ideal for investors or owner-occupants looking to build wealth through real estate. This Property needs some TLC!!!! Attic has potential to be turned into a studio. Pre-approved/Proof of funds Buyers only. All information is estimated. Buyer to verify all information. Rent, income and net are projected estimates.
Key facts
- Fireplaces
- Basement
- Hardwood charm
Tags
Property features AI
Finance
- Other: Pets allowed
Exterior
- Parking: Garage
- Utilities: Public water; Public sewer
- Home design: Two-story multi-family residential income property; Brick construction; Residential zoning
- Construction: Block foundation
- Exterior features: Balcony; Covered porch/patio
Interior
- Bathrooms: 2 full bathrooms
- Heating & cooling: Forced air heating (natural gas); No central cooling
- Interior features: Gas water heater; Full unfinished basement
Neighborhood map
What this means for you Summary
Snapshot
- This is a 6-bed/2.5-bath multifamily listed at $109k.
Deal economics
- At list price, monthly cash flow is $1k ($13k/yr) — positive.
- The deal already cash-flows at list — no discount required.
- Meets the 1% rule at list price ($3k rent vs $109k).
- Cap rate 18.6% vs local median 10.0% in Detroit — top-decile yield for the area; either an underpriced asset or a hidden risk that comps aren't pricing in. Stress-test before assuming the spread holds.
Location & tenants
- Location reads 73/100 on livability (#218 in MI) — a middle-class / working-renter tenant base. Strengths: amenities A+, commute A+, cost of living A+; Watch: schools F, crime F, employment F.
- Detroit Public Schools Community District (urban): math 10% / reading 24% proficiency, ranked #499 of 540 in MI (top 92%) — low school quality limits family demand, transient renter base, plan for 1-2y turnover; 90% free/reduced lunch — lower-income household profile, screen leases tightly.
- Market conditions: Rents rising fast (+6.1%/yr); 350 active listings in the ZIP; 1 comparable units currently listed for rent nearby; lower-income renter base — watch delinquency; 2,639 units permitted in Wayne County in 2024 (1,216 in 5+ unit buildings).
- At $2,518/mo this rent would consume 91% of the median local household income ($33k/yr) (locally 2172% of renters already pay >50% of income on rent) — very limited rent-growth headroom before tenants either downsize or default.
Forward outlook
- Local home prices are declining (-3.0%/yr); year-one equity from $752 of loan paydown is wiped out by about $3k of value loss. Plan a longer hold.
- Wayne County population projected at -17% by 2050 — secular population decline; favor cash flow + early exit over multi-decade hold.
- At projected returns (-3.0% appreciation + 6.1% rent growth), your $30k cash investment doubles in ~3 years — after that, you're playing with house money.
Negotiation context
- Only 10 days on market — expect competitive offers; lowballing is unlikely to land.
- 2 sale attempts with the ask held roughly flat each time — persistent listings suggest the price (not the market) is what's stuck; bring a comps-based counter.
Risks & watch-outs
- Watch-outs: property tax is 2.8% of price; built in 1926 — expect roof / HVAC / electrical / plumbing capex.
Questions for the listing agent
- Built in 1926 — when were the roof, HVAC, electrical panel, plumbing, and water heater last replaced?
- Property tax is high relative to price — has the assessment been appealed recently, and will the sale trigger a re-assessment?
- Is there a deadline driving the sale (1031 exchange, divorce, estate, relocation)? That informs how much negotiation room exists.
- Schools are F-rated, which usually means shorter tenancies and higher turnover. Who's the typical renter profile here, and what's been the actual vacancy rate?
- Crime grade is F in this area — have there been break-ins, vandalism, or insurance claims at this property in the last 3 years? What carrier currently insures it and at what premium?
- What's the average days-on-market for RENTAL listings here right now (not sales)? A rising rental-DOM trend means longer vacancies and softer asking-rent achievability than the comps imply.
- What's the recent tenant-quality profile in this submarket — average credit score on applications, eviction rate, late-payment / NSF rate, and stable-employment percentage? A property-management company in the area should have these aggregated.
- How much new apartment / multifamily construction is in the pipeline within 1–3 miles? Heavy new supply (>2% of stock underway) typically softens rents 12–24 months out; light construction supports rent growth.
Investment metrics
- 1% rule
- 2.31% ✓
- Cap rate
- 18.60%
- Cash-on-cash
- 43.95%
- DSCR
- 2.96
- GRM
- 3.6
CMA / ARV
- ARV (on-the-fly)
- $143,000
- Comps found
- 12
Show comp detail 12 sales within ~0.75 mi
| Address | Dist | Beds/Ba | Sqft | Sold | Price | $/sf | Match |
|---|---|---|---|---|---|---|---|
| 4324 W Buena Vista St | 0.04mi | 6/3.0 | 2,700 (+4%) | 1mo | $148,000 | $55 | 89 |
| 4088 Tyler St | 0.19mi | 6/3.0 | 2,690 (+4%) | 1mo | $83,600 | $31 | 82 |
| 3741 Tyler St | 0.37mi | 6/2.5 | 2,600 (0%) | 2mo | $15,000 | $6 | 82 |
| 3740 Tyler St | 0.37mi | 6/2.0 | 2,600 (0%) | 2mo | $159,500 | $61 | 79 |
| 3782 Tyler St | 0.33mi | 6/2.0 | 2,600 (0%) | 4mo | $97,500 | $38 | 79 |
| 12686 Stoepel St | 0.25mi | 6/2.5 | 2,500 (-4%) | 5mo | $140,000 | $56 | 78 |
| 3729 W Grand St | 0.47mi | 6/2.0 | 2,704 (+4%) | 3mo | $120,000 | $44 | 67 |
| 3734 W Buena Vista St | 0.37mi | 6/2.0 | 2,320 (-11%) | 2mo | $168,000 | $72 | 62 |
| 3316 Sturtevant St | 0.53mi | 6/2.0 | 2,750 (+6%) | 5mo | $215,000 | $78 | 60 |
| 13233 Santa Rosa Dr | 0.29mi | 5/2.0 (-1) | 2,279 (-12%) | 2mo | $175,000 | $77 | 57 |
| 3005 Pasadena St | 0.74mi | 6/2.5 | 2,800 (+8%) | 5mo | $86,000 | $31 | 48 |
| 3230 Fullerton St | 0.59mi | 6/2.0 | 2,950 (+14%) | 3mo | $65,000 | $22 | 46 |
Match score weights: distance 35% · size 25% · config 20% · recency 20%. Top-matched comps best support the ARV.
Projected returns pro-forma
-3.0% appreciation · 6.14% rent growth · sell at horizon
- IRR
- 44.7%
- Equity multiple
- 3.03×
- Total profit
- $61,749
- Equity at exit
- $16,222
- IRR
- 52.1%
- Equity multiple
- 6.96×
- Total profit
- $181,645
- Equity at exit
- $9,407
Cash invested: $30,464 (down + closing). Projections, not guarantees.
Landlord ↔ Tenant lean methodology
- Overall (STATE)
- 62 Landlord-Friendly
- State Michigan
- 62 Landlord-Friendly · EVEN
- County
- — inherits STATE
- City
- — inherits STATE
ZIP-level market 48238
- Home prices YoY
- -14.4%
- Rents YoY
- 6.1%
- Active inventory
- 350
- Price-to-rent
- 7.2×
Monthly cashflow live
- Estimated rent
- $2,518 high interval (Pro) →
- Mortgage (P&I)
- −$571
- Tax from tax record
- −$258 /mo · $3,091/yr
- Insurance
- −$45
- HOA
- −$0
- Vacancy / Maint / Mgmt
- −$529
- Net cashflow
- $1,116
Break-even live
Sensitivity live
| Price | -10% $1,177 | -5% $1,147 | +0% $1,116 | +5% $1,085 | +10% $1,054 |
|---|---|---|---|---|---|
| Rent | -10% $917 | -5% $1,016 | +0% $1,116 | +5% $1,215 | +10% $1,315 |
| Rate | -1.0pp $1,171 | -0.5pp $1,143 | base $1,116 | +0.5pp $1,088 | +1.0pp $1,059 |
2-unit breakdown (identical units grouped — click to expand)
| Units | Beds | Baths | Est. rent |
|---|---|---|---|
| 2× units | 3 | 1.5 | $2,518 |
| #1 | 3 | 1.5 | $1,259 |
| #2 | 3 | 1.5 | $1,259 |
| Total (2 units) | $2,518 | ||
UW: 25.0% down · 7.5% · 30yr · 1.5% tax · 5.0% vac · 8.0% maint · 8.0% mgmt
Financing live
Cash to close
- Down payment
- $27,200
- Closing costs
- $3,264
- Reserves months
- —
- Total cash needed
- —
Loan-product check · same deal, 3 products live
Conventional
25% down · 7.5% · 30yr
- Down + closing
- —
- Monthly P&I
- —
- Monthly cashflow
- —
- DSCR
- —
- Eligible?
- —
Personal DTI + credit; lowest rate.
DSCR
20% down · 8.5% · 30yr
- Down + closing
- —
- Monthly P&I
- —
- Monthly cashflow
- —
- DSCR
- —
- Eligible?
- —
No personal income docs; deal must DSCR.
Hard money
10% down · 12.0% · 12mo
- Down + closing
- —
- Monthly P&I
- —
- Monthly cashflow
- —
- DSCR
- —
- Eligible?
- —
Short-term bridge; refi at stabilization.
Rent comps 1 comps
| Address | Beds | Baths | Sqft | Rent | $/sqft | DOM | Units | Dist |
|---|---|---|---|---|---|---|---|---|
| 13225 Santa Rosa Dr Detroit, MI | 5.0 | 2.0 | 2100 | $1,700 | $0.81 | 6d | 1 | 0.31mi |
Listing history 8 events
-
2026-06-21statusdays on market $108,800 Active Under Contract 10 DOM
-
2026-06-18days on market $108,800 Active 7 DOM
-
2026-06-17days on market $108,800 Active 6 DOM
-
2026-06-16days on market $108,800 Active 5 DOM
-
2026-06-15days on market $108,800 Active 4 DOM
-
2026-06-13days on market $108,800 Active 2 DOM
-
2026-06-13remarks 693-char remark
-
2026-06-13$108,800 Active 1 DOM
ⓘ Source: listings_history table (triggers on properties + properties_extension) + one-shot
backfill from property_details.listing_events for pre-trigger history.
Tax reassessment forecast MI · Partial reset (capped growth)
- Current annual tax
- $3,091 · $258/mo
- Projected year-2 tax
- $3,091 · $258/mo
- Expected delta
- $0/yr ($0/mo · 0.0%)
ⓘ Screening estimate from a state-policy table — verify with the county assessor before closing.
Climate risk First Street
- Flood 1/10 Low FEMA zone X (unshaded) · 0% chance over 30 yrs
- Wildfire 1/10 Low
- Heat 3/10 Moderate 7 d/yr ≥97°F today · 15 d/yr by 30 yrs out
- Wind 2/10 Low
- Air quality 4/10 Moderate 4 unhealthy d/yr today · 6 by 30 yrs out
Nearby sold comps map
Loading sold comps map…
Walkable amenities ~0.75 mi
Loading nearby amenities…
Taxation est. · year 1
- Rental income
- $30,216
- − Mortgage interest
- −$6,094
- − Property taxes
- −$3,091
- − Insurance
- −$544
- − Repairs & maintenance
- −$2,417
- − Management
- −$2,417
- − Depreciation
- −$3,165
- Taxable income
- $12,487
- Est. tax owed @ 24.0%
- −$2,997
- After-tax cash flow
- $10,392/yr
For passive investors: Depreciation is non-cash, so a rental often shows a tax loss while cash-flowing — sheltering income. Rental losses are passive: they offset passive income freely, and up to $25,000/yr can offset ordinary (W-2) income if you actively participate and your MAGI is under $100k (phasing out to $0 by $150k); unused losses carry forward. On sale, claimed depreciation is recaptured at up to 25%, and gains may owe capital-gains tax (a 1031 exchange can defer both). Figures are a year-1 estimate at your 24.0% rate — not tax advice; consult a CPA.
Schools (NCES district)
- District
- Detroit Public Schools Community District
- NCES district ID
- 2601103
- Math proficiency
- 10% ▼ -2.00%
- Reading proficiency
- 24% ▲ 6.00%
- Median HH income
- $25,815
- Composite
- 13.06/100
- National rank
- #9564
- State rank
- #499 of 540 in MI
Livability — Detroit
- Score
- 73/100
- State rank
- #218
- US rank
- #5427
Category grades
Schools grade is shown separately in the Schools card above.
Census & demographics
- Census place
- Detroit, MI
- County
- Wayne County · 1,562,939 people
- City population
- 572,865
- Metro
- Detroit-Warren-Dearborn, MI
- Population (ZIP)
- 24,731
- Household income
- $33,315
- Rent vs Own
- Severe rent burden
- 2172.0
Population outlook (Wayne County) Hauer SSP2
- Today (2025)
- 1,675,273 people
- By 2030
- 1,620,300 · -3.3%
- By 2040
- 1,502,341 · -10.3%
- By 2050
- 1,384,039 · -17.4%
- By 2075
- 1,124,592 · -32.9%
- By 2100
- 881,193 · -47.4%
Race, ethnicity, and origin ACS 2023
- Neighborhood character
- Predominantly Black (94%)
- Race & ethnicity
- Black 94% Two or more races 3% White 1%
- Foreign-born
- 1%
Political lean MEDSL · Wayne
- 2024 margin
- Strong D (+29.0) · D 62.7% · R 33.7% · Other 3.6%
- 2008→2024 swing
- -20.5pp toward R · 2008: 49.5pp · 2024: 29.0pp
- All cycles
- 2024: D+29.0 2020: D+38.1 2016: D+37.3 2012: D+46.9 2008: D+49.5
Not yet ingested
- Civics
- —
Market trends
- HPI YoY
- ▼ -31.96%
- Current HPI
- 189.6227
- Rent YoY
- ▲ 6.14%
- Metro
- Detroit-Warren-Dearborn, MI
- State GDP YoY
- ▲ 1.37%
- F500 in state
- 28
Industry mix (Fortune 500 HQ in MI)
| Industry | F500 HQs | Revenue |
|---|---|---|
| Automotive Parts | 3 | $48B |
|
||
| Automotive | 2 | $372B |
|
||
| Chemicals | 1 | $45B |
|
||
| Automotive Retail | 1 | $29B |
|
||
| Healthcare / Medical Devices | 1 | $23B |
|
||
| Automotive Technology | 1 | $20B |
|
||
Price history
+0.0% since first listed2 events — show timeline
- 2026-06-11 Listed $108,800 REALCOMP
- 2026-06-10 Listed $108,800 MiRealSource-MiMLS
Property tax history
+7.3%/yrLatest (2025): $3,091 · +10.6% YoY. Source: county tax records.
Cash-flow waterfall
monthlySold comps — $/sqft
last 12 mo · ≤1 miLoading sold comps…