 Duplex
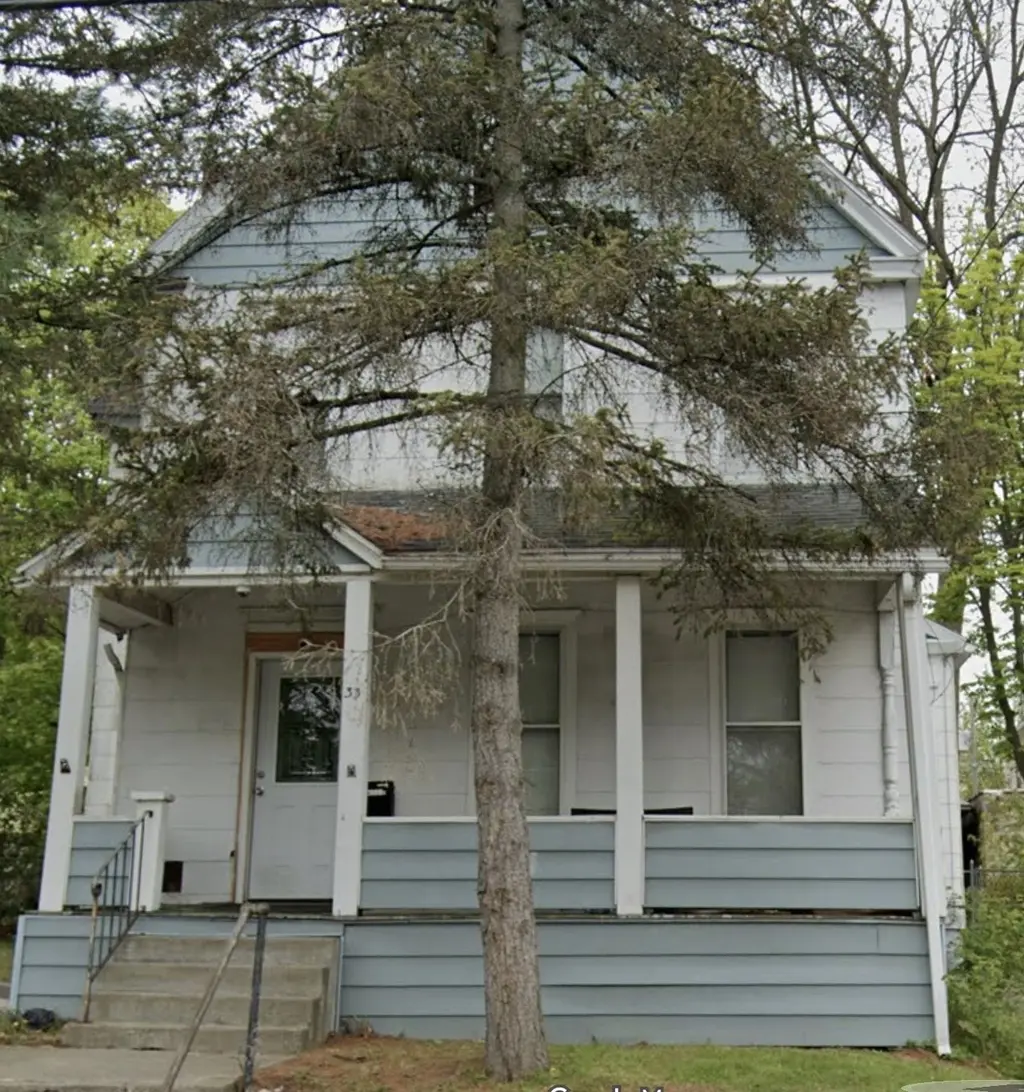
33 St John Ave · Binghamton, NY
Flood risk 1/10 · Minimal
- FEMA flood zone
- X
- Chance of flooding over 30 yrs
- 0.0%
- Est. flood insurance / yr
- $473 – $860
Fire risk 1/10 · Minimal
- Est. fire insurance / yr
- $691 – $1,283
Heat risk 3/10 · Minor
- Hot days now (above 92°F)
- 7 days/yr
- Hot days in 30 yrs
- 16 days/yr
Wind risk 2/10 · Minimal
- Chance of severe wind over 30 yrs
- 2.0%
Air-quality risk 2/10 · Minimal
- Unhealthy air days now
- 0 days/yr
- Unhealthy air days in 30 yrs
- 1 days/yr
Risk factors via First Street. Map © Google.
Why this score? — see what drove the C- grade
The composite is a weighted blend of 9 inputs, each scored 0–100. Each bar is that input's sub-score; the figure is the points it added to the 100-point composite (weight × sub-score).
- Cash flow +19.5/30.0
- ARV discount +7.5/15.0
- DSCR +6.1/10.0
- 1% rule +5.3/10.0
- Rent growth +5.0/5.0
- Livability +3.9/5.0
- Schools +3.0/10.0
- Condition / age +2.5/5.0
- Appreciation +0.0/10.0
$339,000
🖨 Deal sheet 📄 Offer letter ✓ Due diligence
Multi-family units
County records classify this as Multi-Family (2-4 Unit). Listing-text estimate: 2 units. confirmed
Listing remarks MLS
-West side two family, could be one family again. Leases are m-t-m. Being sold "as is". One of the owners is relative of Licensed Real Estate Salesperson.
Key facts
- Built 1900
- Listed 16 days
Neighborhood map
What this means for you Summary
Snapshot
- This is a 2 × 3-bed/1.0-bath units multifamily listed at $339k.
Deal economics
- At list price, monthly cash flow is $382 ($5k/yr) — positive. Per door: $191/mo.
- The deal already cash-flows at list — no discount required.
- Meets the 1% rule at list price ($4k rent vs $339k).
- Recommended offer: $334k (1.5% below list) — sets the bar for market timing.
Location & tenants
- Location reads 78/100 on livability (#174 in NY, #2,710 nationally) — a middle-class / working-renter tenant base. Strengths: amenities A+, commute A+, cost of living A+; Watch: crime F, employment F.
- Binghamton City School District (urban): math 30% / reading 44% proficiency, ranked #557 of 590 in NY (top 94%) — families likely to look elsewhere, expect single-tenant / working-renter base with shorter leases; 61% free/reduced lunch — lower-income household profile, screen leases tightly.
- Zoned schools: Horace Mann School (math 22% / reading 32%, grade F, #1,786 of 2,108 statewide, top 86%, 243 students, 72% FRL).
- Market conditions: Rents rising fast (+11.2%/yr); 136 active listings in the ZIP; 11 comparable units currently listed for rent nearby; rentals lingering (median 44d on market — plan ~5-8 weeks vacancy on turnover, expect pricing pressure); 73% of comp listings sitting > 30 days — soft ceiling on asking rent; 340 units permitted in Broome County in 2024 (269 in 5+ unit buildings).
- At $3,500/mo this rent would consume 79% of the median local household income ($53k/yr) (locally 1875% of renters already pay >50% of income on rent) — very limited rent-growth headroom before tenants either downsize or default.
Forward outlook
- Local home prices are declining (-3.0%/yr); year-one equity from $2k of loan paydown is wiped out by about $10k of value loss. Plan a longer hold.
- Broome County population projected at -13% by 2050 — secular population decline; favor cash flow + early exit over multi-decade hold.
- At projected returns (-3.0% appreciation + 8.0% rent growth), your $95k cash investment doubles in ~9 years — after that, you're playing with house money.
Negotiation context
- It's been on market 16 days — a 2% lower offer ($334k) is reasonable based on typical stale-listing flexibility.
- 2 sale attempts since 13y ago with the ask held roughly flat each time — persistent listings suggest the price (not the market) is what's stuck; bring a comps-based counter.
- Current owner paid $180k; list at $339k implies a 88% gain — meaningful room to come down on a strong offer.
Risks & watch-outs
- Watch-outs: built in 1900 — expect roof / HVAC / electrical / plumbing capex.
Questions for the listing agent
- Can we see the unit-by-unit rent roll, current vacancy, and any below-market leases? What's the average tenancy length?
- What capital expenditures (roof, boiler, parking lot, exteriors) have been made in the last 5 years, and what's planned in the next 2?
- Built in 1900 — when were the roof, HVAC, electrical panel, plumbing, and water heater last replaced?
- Is there a deadline driving the sale (1031 exchange, divorce, estate, relocation)? That informs how much negotiation room exists.
- Schools are D-rated, which usually means shorter tenancies and higher turnover. Who's the typical renter profile here, and what's been the actual vacancy rate?
- Crime grade is F in this area — have there been break-ins, vandalism, or insurance claims at this property in the last 3 years? What carrier currently insures it and at what premium?
- What's the average days-on-market for RENTAL listings here right now (not sales)? A rising rental-DOM trend means longer vacancies and softer asking-rent achievability than the comps imply.
- What's the recent tenant-quality profile in this submarket — average credit score on applications, eviction rate, late-payment / NSF rate, and stable-employment percentage? A property-management company in the area should have these aggregated.
- How much new apartment / multifamily construction is in the pipeline within 1–3 miles? Heavy new supply (>2% of stock underway) typically softens rents 12–24 months out; light construction supports rent growth.
Investment metrics
- 1% rule
- 1.03% ✓
- Cap rate
- 7.65%
- Cash-on-cash
- 4.83%
- DSCR
- 1.21
- GRM
- 8.1
CMA / ARV
- ARV (on-the-fly)
- $198,815
- Comps found
- 12
Show comp detail 12 sales within ~0.75 mi
| Address | Dist | Beds/Ba | Sqft | Sold | Price | $/sf | Match |
|---|---|---|---|---|---|---|---|
| 4 Bennett Ave | 0.08mi | 4/2.0 (-1) | 2,332 (-0%) | 5mo | $217,500 | $93 | 87 |
| 59-59 1/2 Bennett Ave | 0.08mi | 6/2.0 (+1) | 2,160 (-8%) | 3mo | $235,000 | $109 | 76 |
| 83 Leroy St | 0.12mi | 4/2.0 (-1) | 2,166 (-7%) | 8mo | $200,000 | $92 | 71 |
| 117 Walnut Street St | 0.61mi | 4/2.0 (-1) | 2,422 (+4%) | 2mo | $55,000 | $23 | 58 |
| 32 Haendel St | 0.74mi | 4/2.0 (-1) | 2,312 (-1%) | 2mo | $170,000 | $74 | 57 |
| 27 Mather St | 0.59mi | 4/2.0 (-1) | 2,182 (-7%) | 1mo | $185,000 | $85 | 56 |
| 70 Thorp St | 0.67mi | 4/2.0 (-1) | 2,368 (+1%) | 8mo | $35,000 | $15 | 55 |
| 135 Laurel Ave | 0.58mi | 6/3.0 (+1) | 2,400 (+3%) | 6mo | $175,000 | $73 | 54 |
| 3 Mozart St | 0.74mi | 6/2.0 (+1) | 2,384 (+2%) | 4mo | $120,000 | $50 | 54 |
| 7 Goethe St | 0.75mi | 4/2.0 (-1) | 2,240 (-4%) | 3mo | $180,000 | $80 | 50 |
| 198 Chapin St | 0.68mi | 5/3.0 | 2,146 (-8%) | 8mo | $193,000 | $90 | 44 |
| 198 Chapin St #2 | 0.68mi | 5/3.0 | 2,145 (-8%) | 8mo | $193,000 | $90 | 44 |
Match score weights: distance 35% · size 25% · config 20% · recency 20%. Top-matched comps best support the ARV.
Projected returns pro-forma
-3.0% appreciation · 8.0% rent growth · sell at horizon
- IRR
- -3.2%
- Equity multiple
- 0.87×
- Total profit
- $-12,027
- Equity at exit
- $50,546
- IRR
- 11.5%
- Equity multiple
- 2.11×
- Total profit
- $105,358
- Equity at exit
- $29,311
Cash invested: $94,920 (down + closing). Projections, not guarantees.
Landlord ↔ Tenant lean methodology
- Overall (STATE)
- 15 Strongly Tenant-Friendly
- State New York
- 15 Strongly Tenant-Friendly · D+10
- County
- — inherits STATE
- City
- — inherits STATE
ZIP-level market 13905
- Home prices YoY
- -31.1%
- Rents YoY
- 11.2%
- Active inventory
- 136
- Price-to-rent
- 16.1×
Monthly cashflow live
- Estimated rent
- $3,500 high interval (Pro) →
- Mortgage (P&I)
- −$1,778
- Tax from tax record
- −$464 /mo · $5,568/yr
- Insurance
- −$141
- HOA
- −$0
- Vacancy / Maint / Mgmt
- −$735
- Net cashflow
- $382
Break-even live
2-unit breakdown (identical units grouped — click to expand)
| Units | Beds | Baths | Est. rent |
|---|---|---|---|
| 2× units | 3 | 1 | $3,500 |
| #1 | 3 | 1 | $1,750 |
| #2 | 3 | 1 | $1,750 |
| Total (2 units) | $3,500 | ||
UW: 25.0% down · 7.5% · 30yr · 1.5% tax · 5.0% vac · 8.0% maint · 8.0% mgmt
Financing live
Cash to close
- Down payment
- $84,750
- Closing costs
- $10,170
- Reserves months
- —
- Total cash needed
- —
Loan-product check · same deal, 3 products live
Conventional
25% down · 7.5% · 30yr
- Down + closing
- —
- Monthly P&I
- —
- Monthly cashflow
- —
- DSCR
- —
- Eligible?
- —
Personal DTI + credit; lowest rate.
DSCR
20% down · 8.5% · 30yr
- Down + closing
- —
- Monthly P&I
- —
- Monthly cashflow
- —
- DSCR
- —
- Eligible?
- —
No personal income docs; deal must DSCR.
Hard money
10% down · 12.0% · 12mo
- Down + closing
- —
- Monthly P&I
- —
- Monthly cashflow
- —
- DSCR
- —
- Eligible?
- —
Short-term bridge; refi at stabilization.
Rent comps 11 comps
| Address | Beds | Baths | Sqft | Rent | $/sqft | DOM | Units | Dist |
|---|---|---|---|---|---|---|---|---|
| 22 Ayres St Binghamton, NY | 4.0 | 2.0 | 2333 | $2,560 | $1.10 | 43d | 1 | 0.07mi |
| 19 Walnut St Binghamton, NY | 5.0 | 2.0 | 1666 | $2,250 | $1.35 | 43d | 1 | 0.08mi |
| 44 Leroy St Binghamton, NY | 6.0 | 2.0 | 1772 | $3,000 | $1.69 | 21d | 1 | 0.15mi |
| 13 Chapin St Binghamton, NY | 4.0 | 3.0 | 2452 | $4,000 | $1.63 | 43d | 1 | 0.28mi |
| 2 Chapel Pl Binghamton, NY | 6.0 | 3.0 | 2600 | $650 | $0.25 | 43d | 1 | 0.32mi |
| 16 North St Unit 1-1 Binghamton, NY | 5.0 | 2.0 | 2600 | $650 | $0.25 | 43d | 1 | 0.54mi |
| 16 Highland Ave Unit 2 Binghamton, NY | 6.0 | 1.0 | 2000 | $2,750 | $1.38 | 43d | 1 | 0.68mi |
| 129 Helen St Unit 1 Binghamton, NY | 4.0 | 2.0 | 1850 | $2,200 | $1.19 | 43d | 1 | 0.95mi |
| 113 Hawley St Binghamton, NY | 4.0 | 1.5 | 1637 | $2,000 | $1.22 | 43d | 1 | 0.95mi |
| 90 Conklin Ave Binghamton, NY | 5.0 | 2.0 | 2000 | $575 | $0.29 | 13d | 1 | 1.02mi |
| 4 Baxter St Unit Left Binghamton, NY | 4.0 | 2.5 | 1800 | $1,500 | $0.83 | 13d | 1 | 1.41mi |
Listing history 8 events
-
2026-04-27status Pending
-
2026-04-11$339,000 Active
-
2021-09-02soldstatus $180,000
-
2020-06-17soldstatus $75,000
-
2014-03-28soldstatus $66,250
-
2014-03-24soldstatus $53,000 164-char remark
Show marketing remark (164 chars)
-West side two family, could be one family again. Leases are m-t-m. Being sold "as is". One of the owners is relative of Licensed Real Estate Salesperson.
-
2013-09-26$58,500 164-char remark
Show marketing remark (164 chars)
-West side two family, could be one family again. Leases are m-t-m. Being sold "as is". One of the owners is relative of Licensed Real Estate Salesperson.
-
2004-09-01soldstatus $25,000
ⓘ Source: listings_history table (triggers on properties + properties_extension) + one-shot
backfill from property_details.listing_events for pre-trigger history.
Tax reassessment forecast NY · Partial reset (capped growth)
- Current annual tax
- $5,568 · $464/mo
- Projected year-2 tax
- $5,648 · $471/mo
- Expected delta
- +$81/yr (+$7/mo · 1.4%)
ⓘ Screening estimate from a state-policy table — verify with the county assessor before closing.
Climate risk First Street
- Flood 1/10 Low FEMA zone X · 0% chance over 30 yrs
- Wildfire 1/10 Low
- Heat 3/10 Moderate 7 d/yr ≥92°F today · 16 d/yr by 30 yrs out
- Wind 2/10 Low 2% chance of damaging wind over 30 yrs
- Air quality 2/10 Low 0 unhealthy d/yr today · 1 by 30 yrs out
Nearby sold comps map
Loading sold comps map…
Walkable amenities ~0.75 mi
Loading nearby amenities…
Taxation est. · year 1
- Rental income
- $42,000
- − Mortgage interest
- −$18,989
- − Property taxes
- −$5,568
- − Insurance
- −$1,695
- − Repairs & maintenance
- −$3,360
- − Management
- −$3,360
- − Depreciation
- −$9,862
- Taxable loss
- −$834
- Est. tax savings @ 24.0%
- +$200
- After-tax cash flow
- $4,784/yr
For passive investors: Depreciation is non-cash, so a rental often shows a tax loss while cash-flowing — sheltering income. Rental losses are passive: they offset passive income freely, and up to $25,000/yr can offset ordinary (W-2) income if you actively participate and your MAGI is under $100k (phasing out to $0 by $150k); unused losses carry forward. On sale, claimed depreciation is recaptured at up to 25%, and gains may owe capital-gains tax (a 1031 exchange can defer both). Figures are a year-1 estimate at your 24.0% rate — not tax advice; consult a CPA.
Schools (NCES district)
- District
- Binghamton City School District
- NCES district ID
- 3604870
- Math proficiency
- 30% ▬ 0.00%
- Reading proficiency
- 44% ▲ 15.00%
- Median HH income
- $30,475
- Composite
- 30.09/100
- National rank
- #6342
- State rank
- #557 of 590 in NY
Livability — Binghamton
- Score
- 78/100
- State rank
- #174
- US rank
- #2710
Category grades
Schools grade is shown separately in the Schools card above.
Census & demographics
- Census place
- Binghamton, NY
- County
- Broome County · 126,805 people
- City population
- 65,170
- Metro
- Binghamton, NY
- Population (ZIP)
- 27,988
- Household income
- $53,362
- Rent vs Own
- Severe rent burden
- 1875.0
Population outlook (Broome County) Hauer SSP2
- Today (2025)
- 187,989 people
- By 2030
- 183,066 · -2.6%
- By 2040
- 172,228 · -8.4%
- By 2050
- 163,161 · -13.2%
- By 2075
- 153,641 · -18.3%
- By 2100
- 140,851 · -25.1%
Race, ethnicity, and origin ACS 2023
- Neighborhood character
- Predominantly White (68%)
- Race & ethnicity
- White 68% Asian 10% Black 10% Hispanic / Latino 7% Two or more races 7%
- Hispanic origin (detail)
- Mexican 2% Puerto Rican 3%
- Common ancestry
- Romanian 5% Lithuanian 3% Iranian 1%
- Foreign-born
- 11% · Canada, China, Vietnam
- Languages at home
- 87% English-only · Other Indo-European 5% Spanish 2% Other Asian/Pacific 1%
Political lean MEDSL · Broome
- 2024 margin
- Toss-up / Even · D 50.2% · R 49.8%
- 2008→2024 swing
- -7.6pp toward R · 2008: 8.0pp · 2024: 0.4pp
- All cycles
- 2024: D+0.4 2020: D+3.5 2016: R+3.7 2012: D+4.6 2008: D+8.0
Not yet ingested
- Civics
- —
Market trends
- HPI YoY
- ▼ -134.70%
- Current HPI
- 298.9847
- Rent YoY
- ▲ 11.19%
- Metro
- Binghamton, NY
- State GDP YoY
- ▲ 2.60%
- F500 in state
- 92
Industry mix (Fortune 500 HQ in NY)
| Industry | F500 HQs | Revenue |
|---|---|---|
| Financial Services | 10 | $950B |
|
||
| Consumer Goods | 9 | $162B |
|
||
| Insurance | 4 | $225B |
|
||
| Telecommunications | 2 | $144B |
|
||
| Pharmaceuticals | 2 | $112B |
|
||
| Media / Entertainment | 2 | $69B |
|
||
Price history
+1256.0% since first listed8 events — show timeline
- 2026-04-27 Pending — GBAOR
- 2026-04-11 Listed $339,000 GBAOR
- 2021-09-02 Sold (Public Records) $180,000 Public Records
- 2020-06-17 Sold (Public Records) $75,000 Public Records
- 2014-03-28 Sold (Public Records) $66,250 Public Records
- 2014-03-24 Sold (MLS) $53,000 GBAOR
- 2013-09-26 Listed $58,500 GBAOR
- 2004-09-01 Sold (Public Records) $25,000 Public Records
Property tax history
+4.7%/yrLatest (2025): $5,568 · +0.9% YoY. Source: county tax records.
Cash-flow waterfall
monthlySold comps — $/sqft
last 12 mo · ≤1 miLoading sold comps…