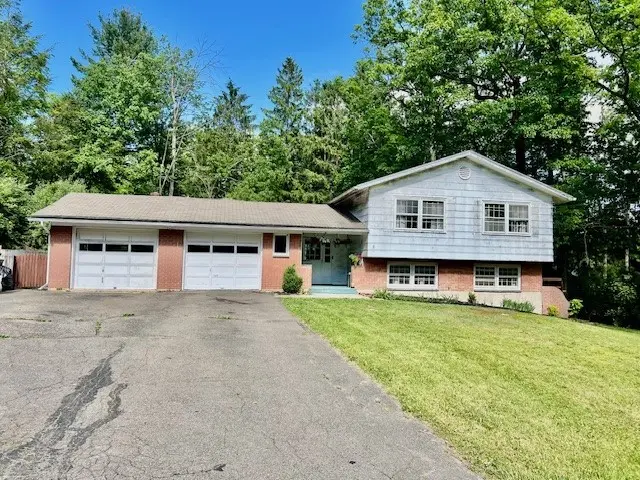
20 Sunnyside Dr · Owego, NY
Flood risk 1/10 · Minimal
- FEMA flood zone
- X (unshaded)
- Chance of flooding over 30 yrs
- 0.0%
- Est. flood insurance / yr
- $473 – $860
Fire risk 3/10 · Minor
- Est. fire insurance / yr
- $691 – $1,283
Heat risk 2/10 · Minimal
- Hot days now (above 95°F)
- 7 days/yr
- Hot days in 30 yrs
- 15 days/yr
Wind risk 2/10 · Minimal
- Chance of severe wind over 30 yrs
- 1.0%
Air-quality risk 2/10 · Minimal
- Unhealthy air days now
- 0 days/yr
- Unhealthy air days in 30 yrs
- 1 days/yr
Risk factors via First Street. Map © Google.
Why this score? — see what drove the D+ grade
The composite is a weighted blend of 9 inputs, each scored 0–100. Each bar is that input's sub-score; the figure is the points it added to the 100-point composite (weight × sub-score).
- ARV discount +15.0/15.0
- Appreciation +9.1/10.0
- Cash flow +6.3/30.0
- Schools +5.3/10.0
- 1% rule +3.8/10.0
- Livability +3.8/5.0
- Rent growth +2.5/5.0
- Condition / age +2.5/5.0
- DSCR +0.6/10.0
$189,000
🖨 Deal sheet (PDF) 📄 Offer letter ✓ Due diligence
Listing remarks MLS
Diamond in the rough. Estate. Great location 1 block from King Point. Large lot. Large custom built Mid-Century home in vintage condition. Spacious with lots of wood trim, built in cabinets, and oak floors. Vaulted ceiling in great room with lots of glass and nice view of the yard. Main bedroom has entry to the deck. Wet bar and bonus area in lower level along with large family room and a fireplace. Bonus room, large kitchen, and 2 car garage. There is exterior work to be done to upgrade older roof, siding, windows, and paint. Inside needs updating. This home with investment could be awesome. 20 Sunnyside Dr is being sold AS-IS. There are no funds for any type of repairs. Sale price reflects current condition. Cash, conventional or construction loans only.
Key facts
- Two fireplaces
- 0.65 acre lot
- 2 garage spots
Tags
Property features AI
Exterior
- Parking: Attached 2-car garage
- Utilities: Public water; Public sewer
- Home design: Single-family residence; Multi/split levels; Residential property
- Construction: Other construction materials
- Exterior features: Covered porch; Deck; Shed(s); Level lot
Interior
- Kitchen: Range; Free-standing range; Exhaust fan; Refrigerator
- Flooring: Carpet; Hardwood; Laminate
- Bathrooms: Three full bathrooms
- Heating & cooling: Baseboard heating; Central air conditioning
- Interior features: Fireplace in family room (masonry, wood-burning); Partial basement
- Laundry & utility: Washer; Dryer; Gas water heater
Neighborhood map
What this means for you Summary
Snapshot
- This is a 4-bed/3.0-bath single-family listed at $189k.
Deal economics
- At list price, monthly cash flow is $-338 ($-4k/yr) — negative.
- To cash-flow at today's rent, offer at most $141k (25.6% below list).
- To meet the 1% rule (rent ≥ 1% of price), the offer needs to be $167k (11.7% below list).
- Recommended offer: $141k (25.6% below list) — sets the bar for cash-flow.
- Cap rate 4.1% vs local median 5.3% in Owego — below-typical yield; the buyer is paying a premium for something (appreciation thesis, condition, location) that the cap rate doesn't capture.
Location & tenants
- Location reads 76/100 on livability (#214 in NY, #3,289 nationally) — a middle-class / working-renter tenant base. Strengths: cost of living A+, housing A+, health & safety A+; Watch: employment D+, commute F.
- Owego-Apalachin Central School District (town): math 62% / reading 62% proficiency, ranked #204 of 590 in NY (top 35%) — acceptable for families but not a draw, mixed tenant base, ~2y average lease.
- Zoned schools: Owego Elementary School (math 72% / reading 67%, grade A-, #447 of 2,108 statewide, top 24%, 486 students, 53% FRL) — zoned schools average 53% FRL vs 35% district-wide (18 pts higher); higher-poverty schools than district average — tighter screening recommended.
- Market conditions: 65 active listings in the ZIP; 139 units permitted in Tioga County in 2024 (65 in 5+ unit buildings).
Forward outlook
- In year one you build about $17k of equity ($1k loan paydown + $15k appreciation (8.1% local appreciation)).
- Tioga County population projected at -27% by 2050 — secular population decline; favor cash flow + early exit over multi-decade hold.
- By year 3, paydown + projected appreciation supports a ~$42k cash-out refi (75% LTV) — recoverable capital for the next deal without selling this one.
Negotiation context
- Only 10 days on market — expect competitive offers; lowballing is unlikely to land.
- 6 sale attempts since 4y ago with the ask held roughly flat each time — persistent listings suggest the price (not the market) is what's stuck; bring a comps-based counter.
- Current owner paid $150k; 26% above their basis — modest negotiation headroom, anchor on the comps not their cost.
Risks & watch-outs
- Watch-outs: property tax is 3.7% of price.
Questions for the listing agent
- What do current leases actually rent for vs. the listed asking? Can we see a recent rent roll and the last 12 months of T-12 income?
- Built in 1962 — when were the roof, HVAC, electrical panel, plumbing, and water heater last replaced?
- Property tax is high relative to price — has the assessment been appealed recently, and will the sale trigger a re-assessment?
- Is there a deadline driving the sale (1031 exchange, divorce, estate, relocation)? That informs how much negotiation room exists.
- The area grade is low — what's the realistic commute time and amenity access for the typical tenant pool here? Any planned neighborhood developments (good or bad) we should know about?
- What's the average days-on-market for RENTAL listings here right now (not sales)? A rising rental-DOM trend means longer vacancies and softer asking-rent achievability than the comps imply.
- What's the recent tenant-quality profile in this submarket — average credit score on applications, eviction rate, late-payment / NSF rate, and stable-employment percentage? A property-management company in the area should have these aggregated.
- How much new for-sale + rental construction is in the pipeline within 1–3 miles? Heavy new supply typically softens prices + rents 12–24 months out; constrained supply supports both.
Investment metrics
- 1% rule
- 0.88% ✗
- Cap rate
- 4.15%
- Cash-on-cash
- -7.66%
- DSCR
- 0.66
- GRM
- 9.4
CMA / ARV
- ARV (on-the-fly)
- $351,868
- Comps found
- 7
Show comp detail 7 sales within ~0.75 mi
| Address | Dist | Beds/Ba | Sqft | Sold | Price | $/sf | Match |
|---|---|---|---|---|---|---|---|
| 21 King Cir N | 0.12mi | 4/3.0 | 2,587 (-11%) | 4mo | $450,000 | $174 | 72 |
| 14 Courtly Cir | 0.09mi | 4/2.5 | 2,820 (-3%) | 24mo | $399,000 | $141 | 69 |
| 37 King Cir N | 0.20mi | 4/3.0 | 3,296 (+13%) | 11mo | $440,000 | $133 | 59 |
| 1 Deerfield Dr | 0.18mi | 4/2.5 | 2,578 (-11%) | 19mo | $280,000 | $109 | 55 |
| 6 Oakland Rd | 0.18mi | 3/2.0 (-1) | 2,554 (-12%) | 15mo | $310,000 | $121 | 50 |
| 499 East Front Street St | 0.74mi | 3/3.0 (-1) | 2,602 (-10%) | 4mo | $157,000 | $60 | 40 |
| 552 E Main St | 0.66mi | 3/3.0 (-1) | 2,712 (-7%) | 24mo | $140,000 | $52 | 33 |
Match score weights: distance 35% · size 25% · config 20% · recency 20%. Top-matched comps best support the ARV.
Projected returns pro-forma
8.11% appreciation · 3.0% rent growth · sell at horizon
- IRR
- 14.6%
- Equity multiple
- 2.09×
- Total profit
- $57,894
- Equity at exit
- $144,978
- IRR
- 14.5%
- Equity multiple
- 4.49×
- Total profit
- $184,495
- Equity at exit
- $289,115
Cash invested: $52,920 (down + closing). Projections, not guarantees.
Landlord ↔ Tenant lean methodology
- Overall (STATE)
- 15 Strongly Tenant-Friendly
- State New York
- 15 Strongly Tenant-Friendly · D+10
- County
- — inherits STATE
- City
- — inherits STATE
ZIP-level market 13827
- Home prices YoY
- 3.2%
- Active inventory
- 65
- Price-to-rent
- 9.4×
Monthly cashflow live
- Estimated rent
- $1,668 medium interval (Pro) →
- Mortgage (P&I)
- −$991
- Tax from tax record
- −$586 /mo · $7,027/yr
- Insurance
- −$79
- HOA
- −$0
- Vacancy / Maint / Mgmt
- −$350
- Net cashflow
- $-338
Break-even live
Sensitivity live
| Price | -10% $-231 | -5% $-284 | +0% $-338 | +5% $-391 | +10% $-445 |
|---|---|---|---|---|---|
| Rent | -10% $-469 | -5% $-404 | +0% $-338 | +5% $-272 | +10% $-206 |
| Rate | -1.0pp $-243 | -0.5pp $-290 | base $-338 | +0.5pp $-387 | +1.0pp $-437 |
UW: 25.0% down · 7.5% · 30yr · 1.5% tax · 5.0% vac · 8.0% maint · 8.0% mgmt
Financing live
Cash to close
- Down payment
- $47,250
- Closing costs
- $5,670
- Reserves months
- —
- Total cash needed
- —
Loan-product check · same deal, 3 products live
Conventional
25% down · 7.5% · 30yr
- Down + closing
- —
- Monthly P&I
- —
- Monthly cashflow
- —
- DSCR
- —
- Eligible?
- —
Personal DTI + credit; lowest rate.
DSCR
20% down · 8.5% · 30yr
- Down + closing
- —
- Monthly P&I
- —
- Monthly cashflow
- —
- DSCR
- —
- Eligible?
- —
No personal income docs; deal must DSCR.
Hard money
10% down · 12.0% · 12mo
- Down + closing
- —
- Monthly P&I
- —
- Monthly cashflow
- —
- DSCR
- —
- Eligible?
- —
Short-term bridge; refi at stabilization.
Listing history 9 events
-
2026-06-19days on market $189,000 Active 10 DOM
-
2026-06-18days on market $189,000 Active 9 DOM
-
2026-06-17days on market $189,000 Active 8 DOM
-
2026-06-16days on market $189,000 Active 7 DOM
-
2026-06-15days on market $189,000 Active 6 DOM
-
2026-06-14days on market $189,000 Active 4 DOM
-
2026-06-13days on market $189,000 Active 3 DOM
-
2026-06-09remarks 347-char remark
-
2026-06-09$189,000 Active 1 DOM
ⓘ Source: listings_history table (triggers on properties + properties_extension) + one-shot
backfill from property_details.listing_events for pre-trigger history.
Tax reassessment forecast NY · Partial reset (capped growth)
- Current annual tax
- $7,027 · $586/mo
- Projected year-2 tax
- $7,027 · $586/mo
- Expected delta
- $0/yr ($0/mo · -0.0%)
ⓘ Screening estimate from a state-policy table — verify with the county assessor before closing.
Climate risk First Street
- Flood 1/10 Low FEMA zone X (unshaded) · 0% chance over 30 yrs
- Wildfire 3/10 Moderate
- Heat 2/10 Low 7 d/yr ≥95°F today · 15 d/yr by 30 yrs out
- Wind 2/10 Low 100% chance of damaging wind over 30 yrs
- Air quality 2/10 Low 0 unhealthy d/yr today · 1 by 30 yrs out
Nearby sold comps map
Loading sold comps map…
Walkable amenities ~0.75 mi
Loading nearby amenities…
Taxation est. · year 1
- Rental income
- $20,017
- − Mortgage interest
- −$10,587
- − Property taxes
- −$7,027
- − Insurance
- −$945
- − Repairs & maintenance
- −$1,601
- − Management
- −$1,601
- − Depreciation
- −$5,498
- Taxable loss
- −$7,243
- Est. tax savings @ 24.0%
- +$1,738
- After-tax cash flow
- $-2,314/yr
For passive investors: Depreciation is non-cash, so a rental often shows a tax loss while cash-flowing — sheltering income. Rental losses are passive: they offset passive income freely, and up to $25,000/yr can offset ordinary (W-2) income if you actively participate and your MAGI is under $100k (phasing out to $0 by $150k); unused losses carry forward. On sale, claimed depreciation is recaptured at up to 25%, and gains may owe capital-gains tax (a 1031 exchange can defer both). Figures are a year-1 estimate at your 24.0% rate — not tax advice; consult a CPA.
Schools (NCES district)
- District
- Owego-Apalachin Central School District
- NCES district ID
- 3622170
- Math proficiency
- 62% ▼ -1.00%
- Reading proficiency
- 62% ▲ 6.00%
- Median HH income
- $57,425
- Composite
- 53.45/100
- National rank
- #1464
- State rank
- #204 of 590 in NY
Livability — Owego
- Score
- 76/100
- State rank
- #214
- US rank
- #3289
Category grades
Schools grade is shown separately in the Schools card above.
Census & demographics
- Population (ZIP)
- 11,713
Population outlook (Tioga County) Hauer SSP2
- Today (2025)
- 45,155 people
- By 2030
- 42,801 · -5.2%
- By 2040
- 37,960 · -15.9%
- By 2050
- 33,071 · -26.8%
- By 2075
- 24,144 · -46.5%
- By 2100
- 16,545 · -63.4%
Race, ethnicity, and origin ACS 2023
- Neighborhood character
- Predominantly White (93%)
- Race & ethnicity
- White 93% Two or more races 3% Hispanic / Latino 2% Asian 1%
- Common ancestry
- Romanian 5% Lithuanian 3% Iranian 2%
- Foreign-born
- 2% · China
- Languages at home
- 97% English-only · Spanish 1% Chinese 1% German/W. Germanic 1%
Political lean MEDSL · Tioga
- 2024 margin
- Strong R (+22.9) · D 38.6% · R 61.4%
- 2008→2024 swing
- -12.7pp toward R · 2008: -10.2pp · 2024: -22.9pp
- All cycles
- 2024: R+22.9 2020: R+20.6 2016: R+27.6 2012: R+15.1 2008: R+10.2
Not yet ingested
- Civics
- —
Market trends
- HPI YoY
- ▲ 8.11%
- Current HPI
- 259.9605
- Rent YoY
- —
- Metro
- —
- State GDP YoY
- ▲ 2.60%
- F500 in state
- 92
Industry mix (Fortune 500 HQ in NY)
| Industry | F500 HQs | Revenue |
|---|---|---|
| Financial Services | 10 | $950B |
|
||
| Consumer Goods | 9 | $162B |
|
||
| Insurance | 4 | $225B |
|
||
| Telecommunications | 2 | $144B |
|
||
| Pharmaceuticals | 2 | $112B |
|
||
| Media / Entertainment | 2 | $69B |
|
||
Price history
+26.1% since first listed12 events — show timeline
- 2026-06-09 Listed $189,000 GBAOR
- 2022-08-01 Sold (Public Records) $150,000 Public Records
- 2022-07-29 Sold (MLS) $150,000 UNYREIS
- 2022-07-29 Sold (MLS) $150,000 IBRMLS
- 2022-07-29 Sold (MLS) $150,000 NMPA
- 2022-07-29 Sold (MLS) $150,000 GBAOR
- 2022-07-29 Sold (MLS) $150,000 IBRMLS
- 2022-05-09 Listed $149,900 UNYREIS
- 2022-05-09 Listed $149,900 IBRMLS
- 2022-05-09 Listed $149,900 NMPA
- 2022-05-09 Listed $149,900 IBRMLS
- 2022-05-08 Listed $149,900 GBAOR
Property tax history
+3.5%/yrLatest (2025): $7,027 · -0.1% YoY. Source: county tax records.
Cash-flow waterfall
monthlySold comps — $/sqft
last 12 mo · ≤1 miLoading sold comps…