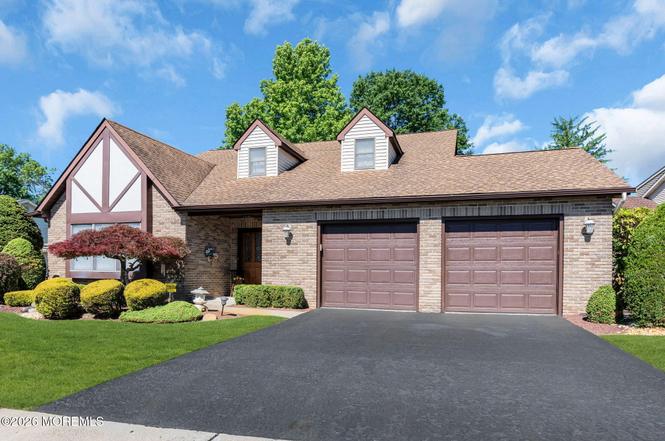
7 Abbey Ln · Robertsville, NJ
Flood risk 1/10 · Minimal
- FEMA flood zone
- X (unshaded)
- Chance of flooding over 30 yrs
- 0.0%
- Est. flood insurance / yr
- $507 – $1,088
Fire risk 1/10 · Minimal
- Est. fire insurance / yr
- $526 – $976
Heat risk 7/10 · Major
- Hot days now (above 99°F)
- 7 days/yr
- Hot days in 30 yrs
- 15 days/yr
Wind risk 6/10 · Moderate
- Chance of severe wind over 30 yrs
- 27.0%
Air-quality risk 3/10 · Minor
- Unhealthy air days now
- 3 days/yr
- Unhealthy air days in 30 yrs
- 5 days/yr
Risk factors via First Street. Map © Google.
Why this score? — see what drove the B- grade
The composite is a weighted blend of 9 inputs, each scored 0–100. Each bar is that input's sub-score; the figure is the points it added to the 100-point composite (weight × sub-score).
- Cash flow +24.9/30.0
- ARV discount +15.0/15.0
- DSCR +8.1/10.0
- 1% rule +6.7/10.0
- Schools +5.9/10.0
- Livability +3.5/5.0
- Rent growth +2.5/5.0
- Condition / age +2.5/5.0
- Appreciation +0.0/10.0
$699,999
🖨 Deal sheet 📄 Offer letter ✓ Due diligence
Listing remarks
Stunning brick front Richmond II in popular Greenbriar Marlboro- one of only a few of this model that have a 2-car garage . Over 2870 SQ. FT. with 4 bedrooms, including 2 Primary Suites, 3 bathrooms, and beautiful lot in the prime newer section of Greenbriar. This is a highly sought after model especially if you have adult children, grandchildren AND/OR parents. Second floor features primary suite, extra bedroom, tons of storage and closet space---akin to a separate apartment! Attic fan, real engineered wood floors in hallway, dining room, kitchen, enclosed patio, park-like lot, 3-zone baseboard heat. Security System. Extra refrigerator in garage. Lots of clubs, activities, shows, etc. Idea
Key facts
- Brick front
- Primary suite
- Tons of storage
Tags
Property features AI
Finance
- HOA & community: Monthly association fee of $240; Association includes trash, common area maintenance, lawn maintenance, pool, and snow removal; Community amenities: exercise room, clubhouse, community room, pool, bocci, common access/area
Exterior
- Parking: Attached 2-car garage
- Security: Security system
- Utilities: Public sewer
- Home design: Model: Richmond II; Ownership: Fee simple
- Exterior features: Shingle roof
Interior
- Kitchen: Countertop range; Gas cooking; Microwave; Refrigerator
- Bedrooms: 4 bedrooms
- Bathrooms: 3 full bathrooms
- Heating & cooling: Baseboard heat; 3+ zone heating; 2-zone air conditioning
- Interior features: AC units; Window treatments and blinds/shades; Light fixtures; Attic fan; Garage door opener; Security system; Gas grill
- Laundry & utility: Washer; Dryer
Neighborhood map
What this means for you Summary
Snapshot
- This is a 4-bed/3.0-bath single-family listed at $700k.
Deal economics
- At list price, monthly cash flow is $2k ($18k/yr) — positive.
- The deal already cash-flows at list — no discount required.
- Meets the 1% rule at list price ($8k rent vs $700k).
- Cap rate 8.9% vs local median 2.9% in Robertsville — top-decile yield for the area; either an underpriced asset or a hidden risk that comps aren't pricing in. Stress-test before assuming the spread holds.
Location & tenants
- Location reads 70/100 on livability (#258 in NJ) — a middle-class / working-renter tenant base. Strengths: crime A+, employment A+, housing A+; Watch: amenities F, commute F, cost of living F.
- Marlboro Township School District (suburban): math 51% / reading 68% proficiency, ranked #42 of 472 in NJ (top 9%) — acceptable for families but not a draw, mixed tenant base, ~2y average lease; only 3% free/reduced lunch — higher-income household profile.
- Market conditions: 110 active listings in the ZIP; 1 comparable units currently listed for rent nearby; 2,840 units permitted in Monmouth County in 2024 (484 in 5+ unit buildings).
Forward outlook
- Local home prices are declining (-3.0%/yr); year-one equity from $5k of loan paydown is wiped out by about $21k of value loss. Plan a longer hold.
- Monmouth County population projected at -11% by 2050 — secular population decline; favor cash flow + early exit over multi-decade hold.
Negotiation context
- Only 1 days on market — expect competitive offers; lowballing is unlikely to land.
- Current owner paid $370k; list at $700k implies a 89% gain — meaningful room to come down on a strong offer.
Risks & watch-outs
- Climate carrying-cost: major wind risk, 27% chance of damaging wind over 30y; extreme-heat days projected 7→15/yr by 2055 (HVAC capex compounding) — expect insurance premiums to compound above CPI over the hold.
Questions for the listing agent
- What does the HOA fee cover, when was the last increase, and are there any pending special assessments or reserve-fund shortfalls?
- Is there a deadline driving the sale (1031 exchange, divorce, estate, relocation)? That informs how much negotiation room exists.
- Schools are A-rated — typically a magnet for longer-tenancy family renters. What's the average tenant stay here, and is there a school-zone premium baked into asking?
- What's the average days-on-market for RENTAL listings here right now (not sales)? A rising rental-DOM trend means longer vacancies and softer asking-rent achievability than the comps imply.
- What's the recent tenant-quality profile in this submarket — average credit score on applications, eviction rate, late-payment / NSF rate, and stable-employment percentage? A property-management company in the area should have these aggregated.
- How much new for-sale + rental construction is in the pipeline within 1–3 miles? Heavy new supply typically softens prices + rents 12–24 months out; constrained supply supports both.
Investment metrics
- 1% rule
- 1.17% ✓
- Cap rate
- 8.87%
- Cash-on-cash
- 9.19%
- DSCR
- 1.41
- GRM
- 7.1
CMA / ARV
- ARV (on-the-fly)
- $913,614
- Comps found
- 12
Show comp detail 12 sales within ~0.75 mi
| Address | Dist | Beds/Ba | Sqft | Sold | Price | $/sf | Match |
|---|---|---|---|---|---|---|---|
| 39 Homestead Cir | 0.29mi | 4/3.0 | 3,030 (+6%) | 5mo | $835,000 | $276 | 74 |
| 19 Dartmoor Dr | 0.28mi | 5/3.5 (+1) | 3,004 (+5%) | 10mo | $1,120,000 | $373 | 64 |
| 52 Homestead Cir | 0.39mi | 4/3.5 | 3,144 (+9%) | 1mo | $1,050,000 | $334 | 63 |
| 48 Coventry Ter | 0.28mi | 4/3.0 | 2,520 (-12%) | 4mo | $600,000 | $238 | 63 |
| 41 Longstreet Rd | 0.45mi | 5/3.0 (+1) | 3,032 (+6%) | 3mo | $999,999 | $330 | 62 |
| 7 Colonial Ct | 0.56mi | 4/3.5 | 2,979 (+4%) | 9mo | $840,000 | $282 | 58 |
| 126 Wyncrest Rd | 0.58mi | 5/3.0 (+1) | 3,015 (+5%) | 4mo | $960,000 | $318 | 56 |
| 46 S Foxcroft Dr | 0.55mi | 5/2.5 (+1) | 3,089 (+8%) | 7mo | $814,900 | $264 | 49 |
| 24 Clubhouse Ln | 0.37mi | 3/3.0 (-1) | 2,520 (-12%) | 10mo | $610,000 | $242 | 48 |
| 1 Weathervane Way | 0.62mi | 4/3.5 | 2,575 (-10%) | 4mo | $1,100,000 | $427 | 48 |
| 107 Clubhouse Ln | 0.63mi | 3/3.0 (-1) | 2,520 (-12%) | 8mo | $675,000 | $268 | 39 |
| 8 Eileen Ln | 0.55mi | 5/3.5 (+1) | 3,229 (+12%) | 10mo | $1,060,000 | $328 | 38 |
Match score weights: distance 35% · size 25% · config 20% · recency 20%. Top-matched comps best support the ARV.
Projected returns pro-forma
-3.0% appreciation · 3.0% rent growth · sell at horizon
- IRR
- -2.4%
- Equity multiple
- 0.91×
- Total profit
- $-17,616
- Equity at exit
- $104,372
- IRR
- 7.3%
- Equity multiple
- 1.55×
- Total profit
- $108,618
- Equity at exit
- $60,523
Cash invested: $196,000 (down + closing). Projections, not guarantees.
Landlord ↔ Tenant lean methodology
- Overall (STATE)
- 21 Tenant-Leaning
- State New Jersey
- 21 Tenant-Leaning · D+6
- County
- — inherits STATE
- City
- — inherits STATE
ZIP-level market 07746
- Active inventory
- 110
- Price-to-rent
- 7.1×
Monthly cashflow live
- Estimated rent
- $8,200 medium interval (Pro) →
- Mortgage (P&I)
- −$3,671
- Tax from tax record
- −$774 /mo · $9,293/yr
- Insurance
- −$292
- HOA
- −$240
- Vacancy / Maint / Mgmt
- −$1,722
- Net cashflow
- $1,501
Break-even live
UW: 25.0% down · 7.5% · 30yr · 1.5% tax · 5.0% vac · 8.0% maint · 8.0% mgmt
Financing live
Cash to close
- Down payment
- $175,000
- Closing costs
- $21,000
- Reserves months
- —
- Total cash needed
- —
Loan-product check · same deal, 3 products live
Conventional
25% down · 7.5% · 30yr
- Down + closing
- —
- Monthly P&I
- —
- Monthly cashflow
- —
- DSCR
- —
- Eligible?
- —
Personal DTI + credit; lowest rate.
DSCR
20% down · 8.5% · 30yr
- Down + closing
- —
- Monthly P&I
- —
- Monthly cashflow
- —
- DSCR
- —
- Eligible?
- —
No personal income docs; deal must DSCR.
Hard money
10% down · 12.0% · 12mo
- Down + closing
- —
- Monthly P&I
- —
- Monthly cashflow
- —
- DSCR
- —
- Eligible?
- —
Short-term bridge; refi at stabilization.
Rent comps 1 comps
| Address | Beds | Baths | Sqft | Rent | $/sqft | DOM | Units | Dist |
|---|---|---|---|---|---|---|---|---|
| 8 Bennett Ct Marlboro, NJ | 5.0 | 3.5 | 4020 | $8,200 | $2.04 | 20d | 1 | 0.93mi |
HOA detail
- Monthly dues
- $240 · $2,880/yr
- Likely covers
- security
Listing history 2 events
-
2026-06-18remarks 699-char remark
-
2026-06-18$699,999 Active 1 DOM
ⓘ Source: listings_history table (triggers on properties + properties_extension) + one-shot
backfill from property_details.listing_events for pre-trigger history.
Tax reassessment forecast NJ · Partial reset (capped growth)
- Current annual tax
- $9,293 · $774/mo
- Projected year-2 tax
- $13,361 · $1,113/mo
- Expected delta
- +$4,069/yr (+$339/mo · 43.8%)
ⓘ Screening estimate from a state-policy table — verify with the county assessor before closing.
Climate risk First Street
- Flood 1/10 Low FEMA zone X (unshaded) · 0% chance over 30 yrs
- Wildfire 1/10 Low
- Heat 7/10 Severe 7 d/yr ≥99°F today · 15 d/yr by 30 yrs out
- Wind 6/10 Major 27% chance of damaging wind over 30 yrs
- Air quality 3/10 Moderate 3 unhealthy d/yr today · 5 by 30 yrs out
Nearby sold comps map
Loading sold comps map…
Walkable amenities ~0.75 mi
Loading nearby amenities…
Taxation est. · year 1
- Rental income
- $98,400
- − Mortgage interest
- −$39,211
- − Property taxes
- −$9,293
- − Insurance
- −$3,500
- − Repairs & maintenance
- −$7,872
- − Management
- −$7,872
- − HOA
- −$2,880
- − Depreciation
- −$20,364
- Taxable income
- $7,409
- Est. tax owed @ 24.0%
- −$1,778
- After-tax cash flow
- $16,235/yr
For passive investors: Depreciation is non-cash, so a rental often shows a tax loss while cash-flowing — sheltering income. Rental losses are passive: they offset passive income freely, and up to $25,000/yr can offset ordinary (W-2) income if you actively participate and your MAGI is under $100k (phasing out to $0 by $150k); unused losses carry forward. On sale, claimed depreciation is recaptured at up to 25%, and gains may owe capital-gains tax (a 1031 exchange can defer both). Figures are a year-1 estimate at your 24.0% rate — not tax advice; consult a CPA.
Schools (NCES district)
- District
- Marlboro Township School District
- NCES district ID
- 3409720
- Math proficiency
- 51% ▼ -19.00%
- Reading proficiency
- 68% ▼ -8.00%
- Median HH income
- $134,870
- Composite
- 58.71/100
- National rank
- #978
- State rank
- #42 of 472 in NJ
Livability — Robertsville
- Score
- 70/100
- State rank
- #258
- US rank
- #7369
Category grades
Schools grade is shown separately in the Schools card above.
Census & demographics
- Population (ZIP)
- 18,137
Population outlook (Monmouth County) Hauer SSP2
- Today (2025)
- 620,308 people
- By 2030
- 612,309 · -1.3%
- By 2040
- 587,297 · -5.3%
- By 2050
- 551,342 · -11.1%
- By 2075
- 472,934 · -23.8%
- By 2100
- 381,534 · -38.5%
Race, ethnicity, and origin ACS 2023
- Neighborhood character
- Predominantly White (74%)
- Race & ethnicity
- White 74% Asian 19% Hispanic / Latino 5% Two or more races 3% Black 1%
- Common ancestry
- Romanian 7% Scotch-Irish 7% Italian 2%
- Foreign-born
- 21% · China, Canada, South Korea
- Languages at home
- 74% English-only · Other Indo-European 8% Chinese 5% Russian/Polish/Slavic 4%
Political lean MEDSL · Monmouth
- 2024 margin
- R (+11.4) · D 43.4% · R 54.8% · Other 1.8%
- 2008→2024 swing
- -7.7pp toward R · 2008: -3.7pp · 2024: -11.4pp
- All cycles
- 2024: R+11.4 2020: R+2.8 2016: R+9.5 2012: R+5.5 2008: R+3.7
Not yet ingested
- Civics
- —
Market trends
- HPI YoY
- ▼ -470.82%
- Current HPI
- 277.775
- Rent YoY
- —
- Metro
- —
- State GDP YoY
- ▲ 2.05%
- F500 in state
- 34
Industry mix (Fortune 500 HQ in NJ)
| Industry | F500 HQs | Revenue |
|---|---|---|
| Consumer Goods | 3 | $31B |
|
||
| Pharmaceuticals | 2 | $153B |
|
||
| Technology | 2 | $21B |
|
||
| Insurance | 2 | $20B |
|
||
| Healthcare | 2 | $19B |
|
||
| Financial Services | 1 | $70B |
|
||
Price history
+89.2% since first listed2 events — show timeline
- 2026-06-18 Listed $699,999 MOMLS
- 2004-11-01 Sold (Public Records) $370,000 Public Records
Property tax history
+0.8%/yrLatest (2025): $9,293 · +4.7% YoY. Source: county tax records.
Cash-flow waterfall
monthlySold comps — $/sqft
last 12 mo · ≤1 miLoading sold comps…