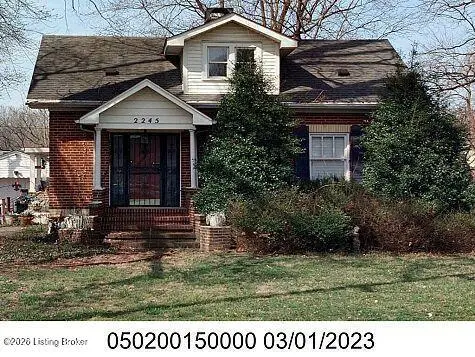
2245 Beargrass Ave · Louisville/Jefferson County metro government (balance), KY
Flood risk 1/10 · Minimal
- FEMA flood zone
- X (unshaded)
- Chance of flooding over 30 yrs
- 0.0%
- Est. flood insurance / yr
- $507 – $1,088
Fire risk 1/10 · Minimal
- Est. fire insurance / yr
- $839 – $1,559
Heat risk 5/10 · Moderate
- Hot days now (above 103°F)
- 7 days/yr
- Hot days in 30 yrs
- 20 days/yr
Wind risk 2/10 · Minimal
- Chance of severe wind over 30 yrs
- 2.0%
Air-quality risk 3/10 · Minor
- Unhealthy air days now
- 2 days/yr
- Unhealthy air days in 30 yrs
- 5 days/yr
Risk factors via First Street. Map © Google.
Why this score? — see what drove the C- grade
The composite is a weighted blend of 9 inputs, each scored 0–100. Each bar is that input's sub-score; the figure is the points it added to the 100-point composite (weight × sub-score).
- Cash flow +17.6/30.0
- ARV discount +15.0/15.0
- DSCR +5.5/10.0
- 1% rule +4.7/10.0
- Livability +2.5/5.0
- Condition / age +2.5/5.0
- Schools +2.3/10.0
- Rent growth +1.6/5.0
- Appreciation +0.0/10.0
$170,000
🖨 Deal sheet (PDF) 📄 Offer letter ✓ Due diligence
Key facts
- 0.39 acre lot
- Garage
- Built 1920
Property features AI
Finance
- Other: Building area reported by appraiser
- HOA & community: No association fee
Exterior
- Parking: Detached garage with 1 garage space
- Utilities: Electricity connected; Natural gas available
- Home design: Single-family residence; Cape Cod architectural style; Two stories; Built in 1920
- Construction: Brick construction; Concrete block foundation; Shingle roof
- Exterior features: Lot measures approximately 0.39 acres (100 x 167.5); Location of parking: garage
Interior
- Kitchen: Kitchen included (first floor)
- Bedrooms: Two bedrooms (both on the first floor)
- Bathrooms: One full bathroom
- Heating & cooling: Forced air heating; Natural gas heating; Gravity heating; Central air conditioning; One HVAC unit for heating and one for cooling
- Interior features: Five total rooms; Two closets; No basement; Dining room on the first floor; Kitchen on the first floor; Laundry on the first floor; First-floor primary bedroom
- Laundry & utility: Laundry room on the first floor
Neighborhood map
What this means for you Summary
Snapshot
- This is a 2-bed/1.0-bath single-family listed at $170k.
Deal economics
- At list price, monthly cash flow is $133 ($2k/yr) — positive.
- The deal already cash-flows at list — no discount required.
- To meet the 1% rule (rent ≥ 1% of price), the offer needs to be $165k (2.7% below list).
- Recommended offer: $165k (2.7% below list) — sets the bar for 1% rule.
- Cap rate 7.2% vs local median 4.0% in Louisville/Jefferson County metro government (balance) — top-decile yield for the area; either an underpriced asset or a hidden risk that comps aren't pricing in. Stress-test before assuming the spread holds.
Location & tenants
- Location reads: area grade C — affects rentability + tenant quality, not the cash-flow math above.
- Jefferson County (urban): math 19% / reading 35% proficiency, ranked #121 of 165 in KY (top 73%) — low school quality limits family demand, transient renter base, plan for 1-2y turnover.
- Zoned schools: Watterson Elementary (math 8% / reading 17%, grade F, #630 of 676 statewide, top 95%, 494 students, 70% FRL); Ramsey Middle (math 11% / reading 34%, grade F, #200 of 217 statewide, top 93%, 1,008 students, 62% FRL); Fern Creek High (math 20% / reading 27%, grade F, #199 of 254 statewide, top 78%, 1,688 students, 60% FRL).
- Market conditions: Rents falling (-3.5%/yr); 103 active listings in the ZIP; 15 comparable units currently listed for rent nearby; rentals at typical pace (median 18d on market — plan ~3-4 weeks tenant-placement turnaround); 2,836 units permitted in Jefferson County in 2024 (1,558 in 5+ unit buildings).
- This rent runs 34% of the median local income ($59k/yr) — at the standard rent-burdened threshold; future hikes will face affordability resistance.
Forward outlook
- Local home prices are declining (-3.0%/yr); year-one equity from $1k of loan paydown is wiped out by about $5k of value loss. Plan a longer hold.
- Jefferson County population projected at +13% by 2050 — modest demand growth; plan on rents tracking national, not racing it.
Negotiation context
- It's been on market 17 days — a 2% lower offer ($167k) is reasonable based on typical stale-listing flexibility.
Risks & watch-outs
- Watch-outs: built in 1920 — expect roof / HVAC / electrical / plumbing capex.
- Climate carrying-cost: extreme-heat days projected 7→20/yr by 2055 (HVAC capex compounding) — expect insurance premiums to compound above CPI over the hold.
Questions for the listing agent
- Built in 1920 — when were the roof, HVAC, electrical panel, plumbing, and water heater last replaced?
- Is there a deadline driving the sale (1031 exchange, divorce, estate, relocation)? That informs how much negotiation room exists.
- What's the average days-on-market for RENTAL listings here right now (not sales)? A rising rental-DOM trend means longer vacancies and softer asking-rent achievability than the comps imply.
- What's the recent tenant-quality profile in this submarket — average credit score on applications, eviction rate, late-payment / NSF rate, and stable-employment percentage? A property-management company in the area should have these aggregated.
- How much new for-sale + rental construction is in the pipeline within 1–3 miles? Heavy new supply typically softens prices + rents 12–24 months out; constrained supply supports both.
Investment metrics
- 1% rule
- 0.97% ✗
- Cap rate
- 7.23%
- Cash-on-cash
- 3.35%
- DSCR
- 1.15
- GRM
- 8.6
CMA / ARV
- ARV (on-the-fly)
- $289,602
- Comps found
- 12
Show comp detail 12 sales within ~0.75 mi
| Address | Dist | Beds/Ba | Sqft | Sold | Price | $/sf | Match |
|---|---|---|---|---|---|---|---|
| 2231 Beargrass Ave | 0.08mi | 3/1.0 (+1) | 1,501 (-10%) | 5mo | $260,000 | $173 | 70 |
| 2224 Beargrass Ave | 0.10mi | 2/1.0 | 1,450 (-13%) | 9mo | $248,000 | $171 | 66 |
| 6208 Cutter Dr | 0.36mi | 3/1.5 (+1) | 1,849 (+10%) | 2mo | $250,000 | $135 | 57 |
| 6402 By Way Ln | 0.27mi | 3/1.5 (+1) | 1,850 (+10%) | 12mo | $255,000 | $138 | 52 |
| 4012 Crawford Ave | 0.51mi | 3/2.0 (+1) | 1,529 (-9%) | 7mo | $280,000 | $183 | 47 |
| 2805 Klondike Ln | 0.66mi | 3/2.0 (+1) | 1,784 (+7%) | 3mo | $325,000 | $182 | 46 |
| 4000 White Plains Ct | 0.66mi | 3/2.0 (+1) | 1,787 (+7%) | 3mo | $291,000 | $163 | 46 |
| 4206 Winter Park Dr | 0.52mi | 3/3.0 (+1) | 1,500 (-10%) | 1mo | $350,000 | $233 | 44 |
| 3805 Stigwood Ct | 0.60mi | 3/2.0 (+1) | 1,590 (-5%) | 13mo | $267,000 | $168 | 44 |
| 6008 Six Mile Ln | 0.55mi | 3/2.0 (+1) | 1,508 (-10%) | 7mo | $295,000 | $196 | 43 |
| 3916 Glen Oak Dr | 0.64mi | 2/2.0 | 1,499 (-10%) | 11mo | $340,000 | $227 | 39 |
| 3926 Glen Oak Dr | 0.57mi | 3/1.0 (+1) | 1,449 (-13%) | 12mo | $215,000 | $148 | 36 |
Match score weights: distance 35% · size 25% · config 20% · recency 20%. Top-matched comps best support the ARV.
Projected returns pro-forma
-3.0% appreciation · 0.0% rent growth · sell at horizon
- IRR
- -14.4%
- Equity multiple
- 0.50×
- Total profit
- $-23,908
- Equity at exit
- $25,348
- IRR
- -11.6%
- Equity multiple
- 0.40×
- Total profit
- $-28,552
- Equity at exit
- $14,698
Cash invested: $47,600 (down + closing). Projections, not guarantees.
Landlord ↔ Tenant lean methodology
- Overall (STATE)
- 83 Strongly Landlord-Friendly
- State Kentucky
- 83 Strongly Landlord-Friendly · R+16
- County
- — inherits STATE
- City
- — inherits STATE
ZIP-level market 40218
- Rents YoY
- -3.5%
- Active inventory
- 103
- Price-to-rent
- 8.6×
Monthly cashflow live
- Estimated rent
- $1,653 high interval (Pro) →
- Mortgage (P&I)
- −$891
- Tax from tax record
- −$211 /mo · $2,532/yr
- Insurance
- −$71
- HOA
- −$0
- Vacancy / Maint / Mgmt
- −$347
- Net cashflow
- $133
Break-even live
Sensitivity live
| Price | -10% $229 | -5% $181 | +0% $133 | +5% $85 | +10% $37 |
|---|---|---|---|---|---|
| Rent | -10% $2 | -5% $68 | +0% $133 | +5% $198 | +10% $263 |
| Rate | -1.0pp $218 | -0.5pp $176 | base $133 | +0.5pp $89 | +1.0pp $44 |
UW: 25.0% down · 7.5% · 30yr · 1.5% tax · 5.0% vac · 8.0% maint · 8.0% mgmt
Financing live
Cash to close
- Down payment
- $42,500
- Closing costs
- $5,100
- Reserves months
- —
- Total cash needed
- —
Loan-product check · same deal, 3 products live
Conventional
25% down · 7.5% · 30yr
- Down + closing
- —
- Monthly P&I
- —
- Monthly cashflow
- —
- DSCR
- —
- Eligible?
- —
Personal DTI + credit; lowest rate.
DSCR
20% down · 8.5% · 30yr
- Down + closing
- —
- Monthly P&I
- —
- Monthly cashflow
- —
- DSCR
- —
- Eligible?
- —
No personal income docs; deal must DSCR.
Hard money
10% down · 12.0% · 12mo
- Down + closing
- —
- Monthly P&I
- —
- Monthly cashflow
- —
- DSCR
- —
- Eligible?
- —
Short-term bridge; refi at stabilization.
Rent comps 15 comps
| Address | Beds | Baths | Sqft | Rent | $/sqft | DOM | Units | Dist |
|---|---|---|---|---|---|---|---|---|
| 226 Granvil Dr Louisville, KY | 3.0 | 1.0 | 1050 | $1,800 | $1.71 | 5d | 1 | 0.41mi |
| 279 Granvil Dr Louisville, KY | 3.0 | 1.0 | 1280 | $1,625 | $1.27 | 22d | 1 | 0.49mi |
| 4011 Crawford Ave Louisville, KY | 3.0 | 2.0 | 1476 | $1,895 | $1.28 | 5d | 1 | 0.52mi |
| 2106 Buechel Bank Rd Louisville, KY | 1.0–3.0 | 1.0 | 1000 | $1,234 | $1.23 | 5d | 7 | 0.53mi |
| 4012 White Plains Ct Louisville, KY | 3.0 | 1.5 | 2000 | $2,200 | $1.10 | 13d | 1 | 0.64mi |
| 2041 Shady Grove Way Louisville, KY | 3.0 | 1.0–2.0 | 754 | $1,238 | $1.64 | 25d | 4 | 0.67mi |
| 7025 Bronner Cir Louisville, KY | 1.0–2.0 | 1.0–2.5 | 1050 | $1,403 | $1.34 | 13d | 9 | 0.76mi |
| 7105 Nachand Ln Louisville, KY | 3.0 | 2.0 | 1986 | $2,000 | $1.01 | 17d | 1 | 0.80mi |
| 4004 Carol Rd Louisville, KY | 3.0 | 1.5 | 1150 | $1,495 | $1.30 | 17d | 1 | 0.84mi |
| 3931 Manner Dale Dr Louisville, KY | 3.0 | 1.5 | 2090 | $2,150 | $1.03 | 17d | 1 | 1.07mi |
| 5706 Bannon Crossings Dr Louisville, KY | 3.0 | 2.0 | 1255 | $2,000 | $1.59 | 25d | 1 | 1.18mi |
| 3552 Lisbon Ln Louisville, KY | 3.0 | 1.0 | 1964 | $1,895 | $0.96 | 25d | 1 | 1.35mi |
| 5925 Brandon Dunes Dr Louisville, KY | 3.0 | 2.5 | 1516 | $1,890 | $1.25 | 25d | 1 | 1.39mi |
| 7008 Wildwood Cir #60 Louisville, KY | 3.0 | 2.0 | 1250 | $1,299 | $1.04 | 5d | 1 | 1.44mi |
| 3701 Hunsinger Ln Louisville, KY | 3.0 | 2.0 | 1777 | $2,200 | $1.24 | 5d | 1 | 1.48mi |
Listing history 8 events
-
2026-06-21days on market $170,000 Active 17 DOM
-
2026-06-18days on market $170,000 Active 14 DOM
-
2026-06-17days on market $170,000 Active 13 DOM
-
2026-06-16status $170,000 Active 12 DOM
-
2026-06-02status $170,000 Pending 12 DOM
-
2026-06-01days on market $170,000 Active 12 DOM
-
2026-05-31days on market $170,000 Active 11 DOM
-
2026-05-20$170,000 Active
ⓘ Source: listings_history table (triggers on properties + properties_extension) + one-shot
backfill from property_details.listing_events for pre-trigger history.
Tax reassessment forecast KY · Resets to sale price
- Current annual tax
- $2,532 · $211/mo
- Projected year-2 tax
- $2,532 · $211/mo
- Expected delta
- $0/yr ($0/mo · 0.0%)
ⓘ Screening estimate from a state-policy table — verify with the county assessor before closing.
Climate risk First Street
- Flood 1/10 Low FEMA zone X (unshaded) · 0% chance over 30 yrs
- Wildfire 1/10 Low
- Heat 5/10 Major 7 d/yr ≥103°F today · 20 d/yr by 30 yrs out
- Wind 2/10 Low 2% chance of damaging wind over 30 yrs
- Air quality 3/10 Moderate 2 unhealthy d/yr today · 5 by 30 yrs out
Nearby sold comps map
Loading sold comps map…
Walkable amenities ~0.75 mi
Loading nearby amenities…
Taxation est. · year 1
- Rental income
- $19,841
- − Mortgage interest
- −$9,523
- − Property taxes
- −$2,532
- − Insurance
- −$850
- − Repairs & maintenance
- −$1,587
- − Management
- −$1,587
- − Depreciation
- −$4,945
- Taxable loss
- −$1,184
- Est. tax savings @ 24.0%
- +$284
- After-tax cash flow
- $1,878/yr
For passive investors: Depreciation is non-cash, so a rental often shows a tax loss while cash-flowing — sheltering income. Rental losses are passive: they offset passive income freely, and up to $25,000/yr can offset ordinary (W-2) income if you actively participate and your MAGI is under $100k (phasing out to $0 by $150k); unused losses carry forward. On sale, claimed depreciation is recaptured at up to 25%, and gains may owe capital-gains tax (a 1031 exchange can defer both). Figures are a year-1 estimate at your 24.0% rate — not tax advice; consult a CPA.
Schools (NCES district)
- District
- Jefferson County
- NCES district ID
- 2102990
- Math proficiency
- 19% ▼ -17.00%
- Reading proficiency
- 35% ▼ -11.00%
- Median HH income
- $47,885
- Composite
- 23.45/100
- National rank
- #7884
- State rank
- #121 of 165 in KY
Livability — Louisville/Jefferson County metro government (balance)
No livability data for this city. (Only ~50 U.S. cities are tracked.)
Census & demographics
- Census place
- Louisville/Jefferson County metro government (balance), KY
- County
- Jefferson County · 790,184 people
- City population
- 419,741
- Metro
- Louisville/Jefferson County, KY-IN
- Population (ZIP)
- 33,736
- Household income
- $58,811
- Rent vs Own
- Severe rent burden
- 1590.0
Population outlook (Jefferson County) Hauer SSP2
- Today (2025)
- 823,112 people
- By 2030
- 849,343 · +3.2%
- By 2040
- 895,696 · +8.8%
- By 2050
- 933,630 · +13.4%
- By 2075
- 1,028,262 · +24.9%
- By 2100
- 1,072,675 · +30.3%
Race, ethnicity, and origin ACS 2023
- Neighborhood character
- Diverse neighborhood (Simpson 0.69)
- Race & ethnicity
- White 42% Black 32% Hispanic / Latino 17% Two or more races 16% Asian 4%
- Hispanic origin (detail)
- Mexican 5% Puerto Rican 1% Cuban 7%
- Common ancestry
- Lithuanian 1% Portuguese 1% Swiss 1%
- Foreign-born
- 20% · Canada, India, Jamaica
- Languages at home
- 77% English-only · Spanish 12% Other Indo-European 3% Arabic 1%
Political lean MEDSL · Jefferson
- 2024 margin
- D (+16.6) · D 57.4% · R 40.9% · Other 1.7%
- 2008→2024 swing
- +4.5pp toward D · 2008: 12.0pp · 2024: 16.6pp
- All cycles
- 2024: D+16.6 2020: D+20.1 2016: D+13.3 2012: D+11.1 2008: D+12.0
Not yet ingested
- Civics
- —
Market trends
- HPI YoY
- ▼ -208.23%
- Current HPI
- 257.9528
- Rent YoY
- ▼ -3.47%
- Metro
- Louisville/Jefferson County, KY-IN
- State GDP YoY
- ▲ 1.81%
- F500 in state
- 4
Industry mix (Fortune 500 HQ in KY)
| Industry | F500 HQs | Revenue |
|---|---|---|
| Healthcare | 1 | $118B |
|
||
| Food / Beverage | 1 | $7B |
|
||
Price history
1 event — show timeline
- 2026-05-20 Listed $170,000 Metro Search MLS
Property tax history
+12.5%/yrLatest (2025): $2,532 · -2.1% YoY. Source: county tax records.
Cash-flow waterfall
monthlySold comps — $/sqft
last 12 mo · ≤1 miLoading sold comps…