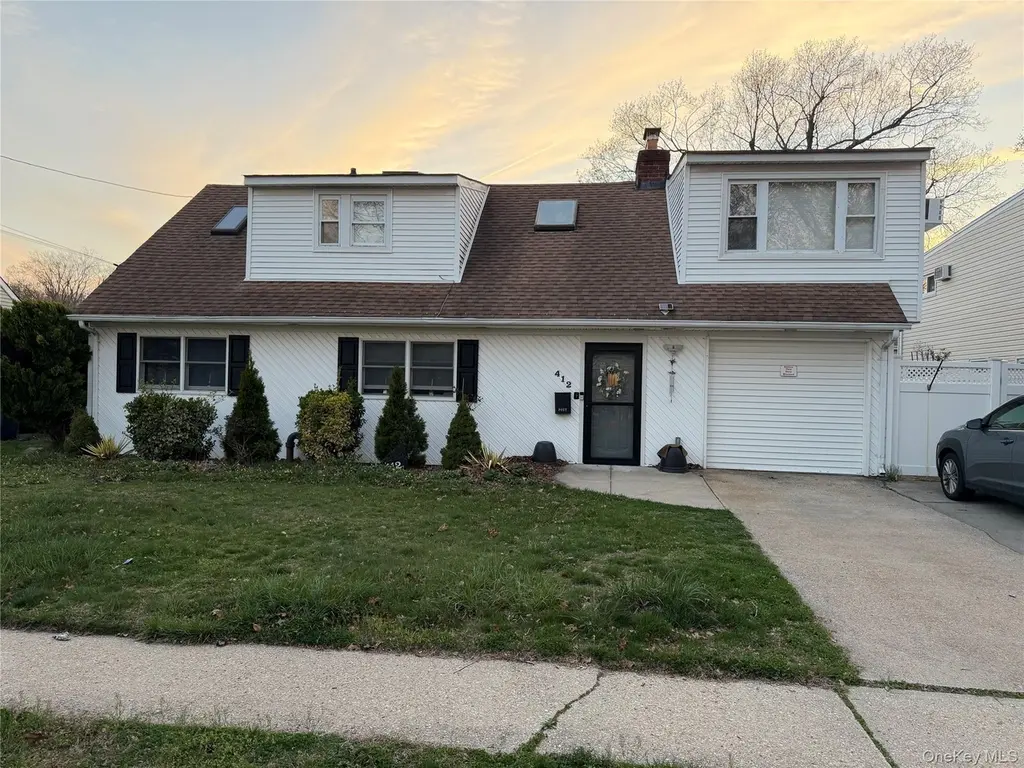
412 Seaford Ave · Massapequa, NY
Flood risk 1/10 · Minimal
- FEMA flood zone
- X (unshaded)
- Chance of flooding over 30 yrs
- 0.0%
- Est. flood insurance / yr
- $507 – $1,088
Fire risk 3/10 · Minor
- Est. fire insurance / yr
- $691 – $1,283
Heat risk 6/10 · Moderate
- Hot days now (above 94°F)
- 7 days/yr
- Hot days in 30 yrs
- 17 days/yr
Wind risk 6/10 · Moderate
- Chance of severe wind over 30 yrs
- 74.0%
Air-quality risk 4/10 · Minor
- Unhealthy air days now
- 3 days/yr
- Unhealthy air days in 30 yrs
- 5 days/yr
Risk factors via First Street. Map © Google.
Why this score? — see what drove the D grade
The composite is a weighted blend of 9 inputs, each scored 0–100. Each bar is that input's sub-score; the figure is the points it added to the 100-point composite (weight × sub-score).
- ARV discount +15.0/15.0
- Schools +7.4/10.0
- Cash flow +7.3/30.0
- Livability +4.1/5.0
- Rent growth +2.5/5.0
- Condition / age +2.5/5.0
- 1% rule +2.1/10.0
- DSCR +1.4/10.0
- Appreciation +0.0/10.0
$649,000
🖨 Deal sheet (PDF) 📄 Offer letter ✓ Due diligence
Listing remarks MLS
This "Fix up and Live" Exp. Cape Needs TLC. Perfect for someone looking to bring their own style. Some of the current features are: Laminate Wood-Like Flooring Thruout, Eat-in-kitchen, Large Livingroom W/ Wood-Burning Fireplace & French Doors To Large Yard, Formal Diningroom W/ updated sheetrock, 1 Mastersuite W/ 1 updated Bath + 1 Other updated Bath & 1 Bedroom. 2nd Floor: Refinished Hardwood Floors W/ 2 Huge Hallway Closets + 2 Bedrooms & Alcove. 2 updated Washers/1 updated Dryer & updated Roof. Gas Line In The Street. Needs Work., Additional information: Appearance:Excellent+,Separate Hotwater Heater:n
Key facts
- 6,000 sq ft lot
- 2 parking spots
- Built 1950
Property features AI
Exterior
- Parking: Driveway; Private parking; 2 parking spaces
- Utilities: Electric service: PSEG; Public sewer; Private trash collection
- Home design: Single family residence; Bi-level
- Construction: Vinyl siding; Full attic
- Exterior features: Fenced yard; Not waterfront
Interior
- Kitchen: Gas oven; Gas range; Refrigerator; Eat-in kitchen
- Bedrooms: Master on main level
- Bathrooms: 3 full bathrooms
- Heating & cooling: Natural gas heating; Wall/window air conditioning units
- Interior features: First-floor bedroom; First-floor full bath; Ceiling fans; Eat-in kitchen; Formal dining room; Primary bathroom; Master bedroom on main level; Skylights; Window blinds; Deck
- Laundry & utility: Washer; Dryer; Laundry inside
Neighborhood map
What this means for you Summary
Snapshot
- This is a 4-bed/3.0-bath single-family listed at $649k.
Deal economics
- At list price, monthly cash flow is $-871 ($-10k/yr) — negative.
- To cash-flow at today's rent, offer at most $495k (23.7% below list).
- To meet the 1% rule (rent ≥ 1% of price), the offer needs to be $463k (28.7% below list).
- Recommended offer: $463k (28.7% below list) — sets the bar for 1% rule.
- Cap rate 4.7% vs local median 2.5% in Massapequa — top-decile yield for the area; either an underpriced asset or a hidden risk that comps aren't pricing in. Stress-test before assuming the spread holds.
Location & tenants
- Location reads 82/100 on livability (#82 in NY, #1,242 nationally) — a professional / high-income tenant draw. Strengths: commute A+, employment A+, housing A+; Watch: amenities D, cost of living F.
- Massapequa Union Free School District (suburban): math 76% / reading 83% proficiency, ranked #39 of 590 in NY (top 7%) — strong family-tenant draw, lease renewals of 3-5y typical; only 4% free/reduced lunch — higher-income household profile.
- Zoned schools: Fairfield Elementary School (math 62% / reading 72%, grade B+, #525 of 2,108 statewide, top 27%, 530 students, 12% FRL); Berner Middle School (math 63% / reading 71%, grade A-, #101 of 729 statewide, top 15%, 1,596 students, 10% FRL); Massapequa High School (math 97% / reading 100%, grade A+, #10 of 1,100 statewide, top 1%, 1,453 students, 10% FRL).
- Market conditions: 269 active listings in the ZIP; 4 comparable units currently listed for rent nearby; rentals lingering (median 46d on market — plan ~5-8 weeks vacancy on turnover, expect pricing pressure); 50% of comp listings sitting > 30 days — soft ceiling on asking rent; 824 units permitted in Nassau County in 2024 (153 in 5+ unit buildings).
Forward outlook
- Local home prices are declining (-3.0%/yr); year-one equity from $4k of loan paydown is wiped out by about $19k of value loss. Plan a longer hold.
- Nassau County population projected at +7% by 2050 — modest demand growth; plan on rents tracking national, not racing it.
Negotiation context
- It's been on market 25 days — a 2% lower offer ($639k) is reasonable based on typical stale-listing flexibility.
- 4 sale attempts since 10y ago with the ask held roughly flat each time — persistent listings suggest the price (not the market) is what's stuck; bring a comps-based counter.
- Current owner paid $425k; list at $649k implies a 53% gain — meaningful room to come down on a strong offer.
Risks & watch-outs
- Watch-outs: built in 1950 — expect roof / HVAC / electrical / plumbing capex.
- Climate carrying-cost: major wind risk, 74% chance of damaging wind over 30y; extreme-heat days projected 7→17/yr by 2055 (HVAC capex compounding) — expect insurance premiums to compound above CPI over the hold.
Questions for the listing agent
- What do current leases actually rent for vs. the listed asking? Can we see a recent rent roll and the last 12 months of T-12 income?
- Built in 1950 — when were the roof, HVAC, electrical panel, plumbing, and water heater last replaced?
- Is there a deadline driving the sale (1031 exchange, divorce, estate, relocation)? That informs how much negotiation room exists.
- Schools are A-rated — typically a magnet for longer-tenancy family renters. What's the average tenant stay here, and is there a school-zone premium baked into asking?
- The area grade is low — what's the realistic commute time and amenity access for the typical tenant pool here? Any planned neighborhood developments (good or bad) we should know about?
- What's the average days-on-market for RENTAL listings here right now (not sales)? A rising rental-DOM trend means longer vacancies and softer asking-rent achievability than the comps imply.
- What's the recent tenant-quality profile in this submarket — average credit score on applications, eviction rate, late-payment / NSF rate, and stable-employment percentage? A property-management company in the area should have these aggregated.
- How much new for-sale + rental construction is in the pipeline within 1–3 miles? Heavy new supply typically softens prices + rents 12–24 months out; constrained supply supports both.
Investment metrics
- 1% rule
- 0.71% ✗
- Cap rate
- 4.68%
- Cash-on-cash
- -5.75%
- DSCR
- 0.74
- GRM
- 11.7
CMA / ARV
- ARV (median comp)
- $795,102
- List price
- $649,000
- Delta
- -18.38%
- Verdict
- UNDERPRICED
- Comps
- 20 within 1.0 mi
Show comp detail 12 sales within ~0.75 mi
| Address | Dist | Beds/Ba | Sqft | Sold | Price | $/sf | Match |
|---|---|---|---|---|---|---|---|
| 388 Forest Ave | 0.15mi | 3/3.5 (-1) | 1,694 (0%) | 1mo | $837,000 | $494 | 86 |
| 85 Riverside Ave | 0.02mi | 4/2.0 | 1,557 (-8%) | 0mo | $730,910 | $469 | 81 |
| 60 Cherry St | 0.30mi | 4/3.0 | 1,533 (-10%) | 2mo | $760,000 | $496 | 69 |
| 2067 Jackson Ave | 0.38mi | 3/1.5 (-1) | 1,705 (+1%) | 5mo | $775,000 | $455 | 66 |
| 3969 Marlow Ct | 0.30mi | 4/2.0 | 1,820 (+7%) | 4mo | $904,000 | $497 | 66 |
| 17 Hawthorne St | 0.09mi | 3/2.0 (-1) | 1,443 (-15%) | 1mo | $728,000 | $505 | 61 |
| 3861 Wilburne Ave | 0.46mi | 3/2.0 (-1) | 1,558 (-8%) | 3mo | $790,000 | $507 | 54 |
| 187 Massapequa Ave | 0.72mi | 4/2.5 | 1,820 (+7%) | 0mo | $1,125,000 | $618 | 52 |
| 3887 Hudson Ave | 0.52mi | 5/2.0 (+1) | 1,546 (-9%) | 3mo | $865,000 | $560 | 50 |
| 84 Ohio Ave | 0.58mi | 5/3.0 (+1) | 1,907 (+13%) | 1mo | $925,000 | $485 | 46 |
| 264 W End Ave | 0.69mi | 3/2.5 (-1) | 1,840 (+9%) | 3mo | $850,000 | $462 | 44 |
| 3992 William St | 0.60mi | 5/2.0 (+1) | 1,496 (-12%) | 2mo | $765,000 | $511 | 42 |
Match score weights: distance 35% · size 25% · config 20% · recency 20%. Top-matched comps best support the ARV.
Projected returns pro-forma
-3.0% appreciation · 3.0% rent growth · sell at horizon
- IRR
- -26.1%
- Equity multiple
- 0.12×
- Total profit
- $-160,536
- Equity at exit
- $96,768
- IRR
- -22.9%
- Equity multiple
- -0.16×
- Total profit
- $-210,821
- Equity at exit
- $56,114
Cash invested: $181,720 (down + closing). Projections, not guarantees.
Landlord ↔ Tenant lean methodology
- Overall (STATE)
- 15 Strongly Tenant-Friendly
- State New York
- 15 Strongly Tenant-Friendly · D+10
- County
- — inherits STATE
- City
- — inherits STATE
ZIP-level market 11758
- Active inventory
- 269
- Price-to-rent
- 11.7×
Monthly cashflow live
- Estimated rent
- $4,630 medium interval (Pro) →
- Mortgage (P&I)
- −$3,403
- Tax from tax record
- −$855 /mo · $10,257/yr
- Insurance
- −$270
- HOA
- −$0
- Vacancy / Maint / Mgmt
- −$972
- Net cashflow
- $-871
Break-even live
Sensitivity live
| Price | -10% $-503 | -5% $-687 | +0% $-871 | +5% $-1,055 | +10% $-1,238 |
|---|---|---|---|---|---|
| Rent | -10% $-1,237 | -5% $-1,054 | +0% $-871 | +5% $-688 | +10% $-505 |
| Rate | -1.0pp $-544 | -0.5pp $-706 | base $-871 | +0.5pp $-1,039 | +1.0pp $-1,210 |
UW: 25.0% down · 7.5% · 30yr · 1.5% tax · 5.0% vac · 8.0% maint · 8.0% mgmt
Financing live
Cash to close
- Down payment
- $162,250
- Closing costs
- $19,470
- Reserves months
- —
- Total cash needed
- —
Loan-product check · same deal, 3 products live
Conventional
25% down · 7.5% · 30yr
- Down + closing
- —
- Monthly P&I
- —
- Monthly cashflow
- —
- DSCR
- —
- Eligible?
- —
Personal DTI + credit; lowest rate.
DSCR
20% down · 8.5% · 30yr
- Down + closing
- —
- Monthly P&I
- —
- Monthly cashflow
- —
- DSCR
- —
- Eligible?
- —
No personal income docs; deal must DSCR.
Hard money
10% down · 12.0% · 12mo
- Down + closing
- —
- Monthly P&I
- —
- Monthly cashflow
- —
- DSCR
- —
- Eligible?
- —
Short-term bridge; refi at stabilization.
Rent comps 4 comps
| Address | Beds | Baths | Sqft | Rent | $/sqft | DOM | Units | Dist |
|---|---|---|---|---|---|---|---|---|
| 405 Massapequa Ave Massapequa, NY | 4.0 | 2.0 | 2034 | $5,300 | $2.61 | 26d | 1 | 0.46mi |
| 405 Massapequa Ave Massapequa, NY | 3.0 | 1.0 | 1550 | $3,700 | $2.39 | 6d | 1 | 0.46mi |
| 3883 Franklin Ave Seaford, NY | 4.0 | 2.0 | 1593 | $5,500 | $3.45 | 45d | 1 | 0.56mi |
| 398 Harrison Ave Massapequa, NY | 3.0 | 1.0 | 1098 | $3,800 | $3.46 | 45d | 1 | 0.65mi |
Listing history 13 events
-
2026-05-15status Pending 920-char remark
-
2026-04-20$649,000 Active 920-char remark
-
2021-03-10soldstatus $425,000
-
2021-02-12soldstatus $425,000 Closed 638-char remark
Show marketing remark (638 chars)
This "Fix up and Live" Exp. Cape Needs TLC. Perfect for someone looking to bring their own style. Some of the current features are: Laminate Wood-Like Flooring Thruout, Eat-in-kitchen, Large Livingroom W/ Wood-Burning Fireplace & French Doors To Large Yard, Formal Diningroom W/ updated sheetrock, 1 Mastersuite W/ 1 updated Bath + 1 Other updated Bath & 1 Bedroom. 2nd Floor: Refinished Hardwood Floors W/ 2 Huge Hallway Closets + 2 Bedrooms & Alcove. 2 updated Washers/1 updated Dryer & updated Roof. Gas Line In The Street. Needs Work., Additional information: Appearance:Excellent+,Separate Hotwater Heater:n
-
2020-11-17status Pending 638-char remark
Show marketing remark (638 chars)
This "Fix up and Live" Exp. Cape Needs TLC. Perfect for someone looking to bring their own style. Some of the current features are: Laminate Wood-Like Flooring Thruout, Eat-in-kitchen, Large Livingroom W/ Wood-Burning Fireplace & French Doors To Large Yard, Formal Diningroom W/ updated sheetrock, 1 Mastersuite W/ 1 updated Bath + 1 Other updated Bath & 1 Bedroom. 2nd Floor: Refinished Hardwood Floors W/ 2 Huge Hallway Closets + 2 Bedrooms & Alcove. 2 updated Washers/1 updated Dryer & updated Roof. Gas Line In The Street. Needs Work., Additional information: Appearance:Excellent+,Separate Hotwater Heater:n
-
2020-10-20price $459,000 638-char remark
Show marketing remark (638 chars)
This "Fix up and Live" Exp. Cape Needs TLC. Perfect for someone looking to bring their own style. Some of the current features are: Laminate Wood-Like Flooring Thruout, Eat-in-kitchen, Large Livingroom W/ Wood-Burning Fireplace & French Doors To Large Yard, Formal Diningroom W/ updated sheetrock, 1 Mastersuite W/ 1 updated Bath + 1 Other updated Bath & 1 Bedroom. 2nd Floor: Refinished Hardwood Floors W/ 2 Huge Hallway Closets + 2 Bedrooms & Alcove. 2 updated Washers/1 updated Dryer & updated Roof. Gas Line In The Street. Needs Work., Additional information: Appearance:Excellent+,Separate Hotwater Heater:n
-
2020-10-15$479,000 Active 638-char remark
Show marketing remark (638 chars)
This "Fix up and Live" Exp. Cape Needs TLC. Perfect for someone looking to bring their own style. Some of the current features are: Laminate Wood-Like Flooring Thruout, Eat-in-kitchen, Large Livingroom W/ Wood-Burning Fireplace & French Doors To Large Yard, Formal Diningroom W/ updated sheetrock, 1 Mastersuite W/ 1 updated Bath + 1 Other updated Bath & 1 Bedroom. 2nd Floor: Refinished Hardwood Floors W/ 2 Huge Hallway Closets + 2 Bedrooms & Alcove. 2 updated Washers/1 updated Dryer & updated Roof. Gas Line In The Street. Needs Work., Additional information: Appearance:Excellent+,Separate Hotwater Heater:n
-
2016-07-25historical
-
2016-06-16status Back On Market
-
2016-04-19historical
-
2016-02-10$415,000 New
-
1995-07-06soldstatus $176,500
-
1990-03-30soldstatus $150,000
ⓘ Source: listings_history table (triggers on properties + properties_extension) + one-shot
backfill from property_details.listing_events for pre-trigger history.
Tax reassessment forecast NY · Partial reset (capped growth)
- Current annual tax
- $10,257 · $855/mo
- Projected year-2 tax
- $10,613 · $884/mo
- Expected delta
- +$355/yr (+$30/mo · 3.5%)
ⓘ Screening estimate from a state-policy table — verify with the county assessor before closing.
Climate risk First Street
- Flood 1/10 Low FEMA zone X (unshaded) · 0% chance over 30 yrs
- Wildfire 3/10 Moderate
- Heat 6/10 Major 7 d/yr ≥94°F today · 17 d/yr by 30 yrs out
- Wind 6/10 Major 74% chance of damaging wind over 30 yrs
- Air quality 4/10 Moderate 3 unhealthy d/yr today · 5 by 30 yrs out
Nearby sold comps map
Loading sold comps map…
Walkable amenities ~0.75 mi
Loading nearby amenities…
Taxation est. · year 1
- Rental income
- $55,560
- − Mortgage interest
- −$36,354
- − Property taxes
- −$10,257
- − Insurance
- −$3,245
- − Repairs & maintenance
- −$4,445
- − Management
- −$4,445
- − Depreciation
- −$18,880
- Taxable loss
- −$22,065
- Est. tax savings @ 24.0%
- +$5,296
- After-tax cash flow
- $-5,155/yr
For passive investors: Depreciation is non-cash, so a rental often shows a tax loss while cash-flowing — sheltering income. Rental losses are passive: they offset passive income freely, and up to $25,000/yr can offset ordinary (W-2) income if you actively participate and your MAGI is under $100k (phasing out to $0 by $150k); unused losses carry forward. On sale, claimed depreciation is recaptured at up to 25%, and gains may owe capital-gains tax (a 1031 exchange can defer both). Figures are a year-1 estimate at your 24.0% rate — not tax advice; consult a CPA.
Schools (NCES district)
- District
- Massapequa Union Free School District
- NCES district ID
- 3618630
- Math proficiency
- 76% ▼ -3.00%
- Reading proficiency
- 83% ▲ 12.00%
- Median HH income
- $116,173
- Composite
- 73.55/100
- National rank
- #178
- State rank
- #39 of 590 in NY
Livability — Massapequa
- Score
- 82/100
- State rank
- #82
- US rank
- #1242
Category grades
Schools grade is shown separately in the Schools card above.
Census & demographics
- Census place
- Massapequa, NY
- City population
- 54,741
- Population (ZIP)
- 54,741
Population outlook (Nassau County) Hauer SSP2
- Today (2025)
- 1,409,302 people
- By 2030
- 1,431,482 · +1.6%
- By 2040
- 1,471,607 · +4.4%
- By 2050
- 1,502,845 · +6.6%
- By 2075
- 1,575,403 · +11.8%
- By 2100
- 1,554,356 · +10.3%
Race, ethnicity, and origin ACS 2023
- Neighborhood character
- Predominantly White (80%)
- Race & ethnicity
- White 80% Hispanic / Latino 11% Two or more races 7% Black 6% Asian 2%
- Hispanic origin (detail)
- Puerto Rican 4% Dominican 1%
- Common ancestry
- Romanian 4% Scotch-Irish 2% Italian 1%
- Foreign-born
- 8% · Canada, China
- Languages at home
- 89% English-only · Spanish 6% Other Indo-European 3% Russian/Polish/Slavic 1%
Political lean MEDSL · Nassau
- 2024 margin
- Toss-up / Even · D 47.9% · R 52.1%
- 2008→2024 swing
- -12.6pp toward R · 2008: 8.4pp · 2024: -4.2pp
- All cycles
- 2024: R+4.2 2020: D+9.5 2016: D+5.3 2012: D+6.7 2008: D+8.4
Not yet ingested
- Civics
- —
Market trends
- HPI YoY
- ▼ -765.19%
- Current HPI
- 287.8085
- Rent YoY
- —
- Metro
- —
- State GDP YoY
- ▲ 2.60%
- F500 in state
- 92
Industry mix (Fortune 500 HQ in NY)
| Industry | F500 HQs | Revenue |
|---|---|---|
| Financial Services | 10 | $950B |
|
||
| Consumer Goods | 9 | $162B |
|
||
| Insurance | 4 | $225B |
|
||
| Telecommunications | 2 | $144B |
|
||
| Pharmaceuticals | 2 | $112B |
|
||
| Media / Entertainment | 2 | $69B |
|
||
Price history
+332.7% since first listed13 events — show timeline
- 2026-05-15 Pending — OneKey® MLS as Distributed by MLS Grid
- 2026-04-20 Listed $649,000 OneKey® MLS as Distributed by MLS Grid
- 2021-03-10 Sold (Public Records) $425,000 Public Records
- 2021-02-12 Sold (MLS) $425,000 OneKey® MLS as Distributed by MLS Grid
- 2020-11-17 Pending — OneKey® MLS as Distributed by MLS Grid
- 2020-10-20 Price Changed $459,000 OneKey® MLS as Distributed by MLS Grid
- 2020-10-15 Listed $479,000 OneKey® MLS as Distributed by MLS Grid
- 2016-07-25 Listing Removed — OneKey® MLS as Distributed by MLS Grid
- 2016-06-16 Relisted — OneKey® MLS as Distributed by MLS Grid
- 2016-04-19 Listing Removed — OneKey® MLS as Distributed by MLS Grid
- 2016-02-10 Listed $415,000 OneKey® MLS as Distributed by MLS Grid
- 1995-07-06 Sold (Public Records) $176,500 Public Records
- 1990-03-30 Sold (Public Records) $150,000 Public Records
Property tax history
+0.9%/yrLatest (2024): $10,257 · +10.4% YoY. Source: county tax records.
Cash-flow waterfall
monthlySold comps — $/sqft
last 12 mo · ≤1 miLoading sold comps…