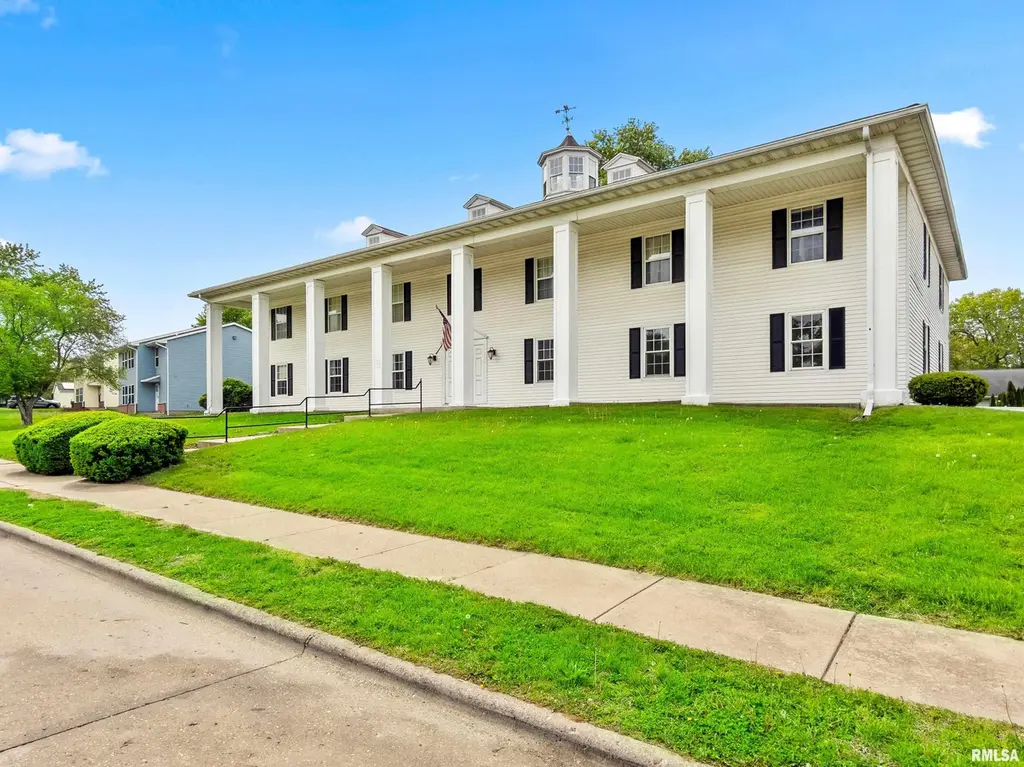
3438 W Villa Rdg Unit B · Peoria, IL
Flood risk 1/10 · Minimal
- FEMA flood zone
- X
- Chance of flooding over 30 yrs
- 0.0%
- Est. flood insurance / yr
- $507 – $1,088
Fire risk 1/10 · Minimal
- Est. fire insurance / yr
- $804 – $1,492
Heat risk 3/10 · Minor
- Hot days now (above 104°F)
- 7 days/yr
- Hot days in 30 yrs
- 18 days/yr
Wind risk 2/10 · Minimal
- Chance of severe wind over 30 yrs
- 1.0%
Air-quality risk 3/10 · Minor
- Unhealthy air days now
- 1 days/yr
- Unhealthy air days in 30 yrs
- 3 days/yr
Risk factors via First Street. Map © Google.
Why this score? — see what drove the B+ grade
The composite is a weighted blend of 9 inputs, each scored 0–100. Each bar is that input's sub-score; the figure is the points it added to the 100-point composite (weight × sub-score).
- Cash flow +30.0/30.0
- ARV discount +12.1/15.0
- 1% rule +10.0/10.0
- DSCR +10.0/10.0
- Rent growth +5.0/5.0
- Livability +3.7/5.0
- Schools +2.9/10.0
- Condition / age +2.5/5.0
- Appreciation +0.0/10.0
$69,900
🖨 Deal sheet 📄 Offer letter ✓ Due diligence
Listing remarks
Modern Sophistication Meets Turn-Key Convenience. Experience a "Sovereign" standard of living in this meticulously renovated condominium. Designed for the homeowner who values aesthetic precision and functional durability, this unit features all hard-surface flooring throughout, offering a clean, expansive flow from room to room. The Gourmet Kitchen, the heart of the home, has been completely reimagined with: • New white cabinetry providing ample, bright storage. • Granite countertops that offer a high-performance workspace. • Precision Cooking: Featuring a high-quality induction range/oven and a new dishwasher. • Stainless Steel Suite: Completed by a reliable
Key facts
- Gourmet kitchen
- Induction range oven
- Granite countertops
Tags
Property features AI
Finance
- Other: Living area 874; Level: 1 story
- HOA & community: HOA fee covers landscaping, grounds maintenance, common area maintenance, assigned storage and trash; Association fee: $175
Exterior
- Parking: Carport (no garage)
- Utilities: Public water; Public sewer
- Home design: Condo with attached property; Single-story; Built in 1978
- Construction: Shingle roof
- Exterior features: Level lot
Interior
- Kitchen: Dishwasher; Microwave; Refrigerator
- Bedrooms: 2 bedrooms (main level)
- Flooring: Laminate flooring in bedrooms, living and dining areas; Tile flooring in kitchen
- Bathrooms: 1 full bathroom; 1 half bathroom
- Heating & cooling: Central air; Electric forced air heating; Electric water heater
- Interior features: Cable available; No fireplaces
Neighborhood map
What this means for you Summary
Snapshot
- This is a 2-bed/1.5-bath townhouse listed at $70k.
Deal economics
- At list price, monthly cash flow is $260 ($3k/yr) — positive.
- The deal already cash-flows at list — no discount required.
- Meets the 1% rule at list price ($1k rent vs $70k).
- Recommended offer: $68k (3.0% below list) — sets the bar for market timing.
- Cap rate 10.8% vs local median 5.6% in Peoria — top-decile yield for the area; either an underpriced asset or a hidden risk that comps aren't pricing in. Stress-test before assuming the spread holds.
Location & tenants
- Location reads 73/100 on livability (#270 in IL) — a middle-class / working-renter tenant base. Strengths: commute A+, cost of living A+, housing A+; Watch: employment D+, crime F.
- Limestone Chsd 310 (rural): math 25% / reading 35% proficiency, ranked #486 of 919 in IL (top 53%) — families likely to look elsewhere, expect single-tenant / working-renter base with shorter leases.
- Zoned schools: Limestone Community High School (math 17% / reading 22%, grade F, #397 of 693 statewide, top 61%, 924 students, 0% FRL).
- Market conditions: Rents rising fast (+10.3%/yr); 150 active listings in the ZIP; 12 comparable units currently listed for rent nearby; rentals leasing fast (median 13d on market — plan ~1-2 weeks tenant-placement turnaround); 73 units permitted in Peoria County in 2024 (0 in 5+ unit buildings).
Forward outlook
- Local home prices are declining (-3.0%/yr); year-one equity from $483 of loan paydown is wiped out by about $2k of value loss. Plan a longer hold.
- Peoria County population projected at -11% by 2050 — secular population decline; favor cash flow + early exit over multi-decade hold.
- At projected returns (-3.0% appreciation + 8.0% rent growth), your $20k cash investment doubles in ~6 years — after that, you're playing with house money.
Negotiation context
- It's been on market 43 days — a 3% lower offer ($68k) is reasonable based on typical stale-listing flexibility.
- 3 sale attempts since 20y ago with the ask held roughly flat each time — persistent listings suggest the price (not the market) is what's stuck; bring a comps-based counter.
Questions for the listing agent
- It's been on market 43 days. Have you received any prior offers? Is the seller open to a 3% concession, seller financing, or rate buy-down credit?
- Built in 1978 — when were the roof, HVAC, electrical panel, plumbing, and water heater last replaced?
- What does the HOA fee cover, when was the last increase, and are there any pending special assessments or reserve-fund shortfalls?
- Is there a deadline driving the sale (1031 exchange, divorce, estate, relocation)? That informs how much negotiation room exists.
- Schools are F-rated, which usually means shorter tenancies and higher turnover. Who's the typical renter profile here, and what's been the actual vacancy rate?
- Crime grade is F in this area — have there been break-ins, vandalism, or insurance claims at this property in the last 3 years? What carrier currently insures it and at what premium?
- What's the average days-on-market for RENTAL listings here right now (not sales)? A rising rental-DOM trend means longer vacancies and softer asking-rent achievability than the comps imply.
- What's the recent tenant-quality profile in this submarket — average credit score on applications, eviction rate, late-payment / NSF rate, and stable-employment percentage? A property-management company in the area should have these aggregated.
- How much new for-sale + rental construction is in the pipeline within 1–3 miles? Heavy new supply typically softens prices + rents 12–24 months out; constrained supply supports both.
Investment metrics
- 1% rule
- 1.66% ✓
- Cap rate
- 10.76%
- Cash-on-cash
- 15.97%
- DSCR
- 1.71
- GRM
- 5.0
CMA / ARV
- ARV (on-the-fly)
- $77,786
- Comps found
- 12
Show comp detail 12 sales within ~0.75 mi
| Address | Dist | Beds/Ba | Sqft | Sold | Price | $/sf | Match |
|---|---|---|---|---|---|---|---|
| 3438 W Villa Rdg Unit A | 0.04mi | 2/1.5 | 874 (0%) | 4mo | $50,000 | $57 | 95 |
| 3438 W Villa Rdg Unit C | 0.04mi | 2/1.5 | 874 (0%) | 20mo | $53,000 | $61 | 82 |
| 3418 W Dorchester Rdg Unit A-1 | 0.06mi | 2/1.0 | 757 (-13%) | 2mo | $58,500 | $77 | 71 |
| 3512 N Sandia Dr #76 | 0.25mi | 2/1.5 | 952 (+9%) | 3mo | $88,500 | $93 | 71 |
| 3550 W Richwoods Blvd | 0.26mi | 2/1.5 | 952 (+9%) | 3mo | $87,000 | $91 | 70 |
| 3636 N Sandia Dr #41 | 0.28mi | 2/1.5 | 952 (+9%) | 3mo | $88,000 | $92 | 70 |
| 3445 W Dorchester Rdg Unit B | 0.08mi | 2/2.0 | 944 (+8%) | 16mo | $74,000 | $78 | 67 |
| 3640 N Sandia Dr | 0.28mi | 2/1.5 | 952 (+9%) | 7mo | $78,000 | $82 | 66 |
| 3438 N Sandia Dr #134 | 0.25mi | 2/1.5 | 952 (+9%) | 12mo | $85,000 | $89 | 63 |
| 3626 N Sandia Dr #46 | 0.27mi | 2/1.5 | 952 (+9%) | 14mo | $95,000 | $100 | 61 |
| 3811 W Palmyra Ct #114 | 0.33mi | 2/1.5 | 936 (+7%) | 16mo | $77,900 | $83 | 60 |
| 3422 W Dorchester Rdg Unit C-1 | 0.07mi | 2/1.0 | 757 (-13%) | 22mo | $68,000 | $90 | 54 |
Match score weights: distance 35% · size 25% · config 20% · recency 20%. Top-matched comps best support the ARV.
Projected returns pro-forma
-3.0% appreciation · 8.0% rent growth · sell at horizon
- IRR
- 13.7%
- Equity multiple
- 1.59×
- Total profit
- $11,528
- Equity at exit
- $10,422
- IRR
- 26.8%
- Equity multiple
- 4.06×
- Total profit
- $59,868
- Equity at exit
- $6,044
Cash invested: $19,572 (down + closing). Projections, not guarantees.
Landlord ↔ Tenant lean methodology
- Overall (STATE)
- 43 Moderately Tenant-Leaning
- State Illinois
- 43 Moderately Tenant-Leaning · D+7
- County
- — inherits STATE
- City
- — inherits STATE
ZIP-level market 61614
- Home prices YoY
- -29.1%
- Rents YoY
- 10.3%
- Active inventory
- 150
- Price-to-rent
- 5.0×
Monthly cashflow live
- Estimated rent
- $1,163 high interval (Pro) →
- Mortgage (P&I)
- −$367
- Tax est. 1.5%
- −$87 /mo · $1,048/yr
- Insurance
- −$29
- HOA
- −$175
- Vacancy / Maint / Mgmt
- −$244
- Net cashflow
- $260
Break-even live
UW: 25.0% down · 7.5% · 30yr · 1.5% tax · 5.0% vac · 8.0% maint · 8.0% mgmt
Financing live
Cash to close
- Down payment
- $17,475
- Closing costs
- $2,097
- Reserves months
- —
- Total cash needed
- —
Loan-product check · same deal, 3 products live
Conventional
25% down · 7.5% · 30yr
- Down + closing
- —
- Monthly P&I
- —
- Monthly cashflow
- —
- DSCR
- —
- Eligible?
- —
Personal DTI + credit; lowest rate.
DSCR
20% down · 8.5% · 30yr
- Down + closing
- —
- Monthly P&I
- —
- Monthly cashflow
- —
- DSCR
- —
- Eligible?
- —
No personal income docs; deal must DSCR.
Hard money
10% down · 12.0% · 12mo
- Down + closing
- —
- Monthly P&I
- —
- Monthly cashflow
- —
- DSCR
- —
- Eligible?
- —
Short-term bridge; refi at stabilization.
Rent comps 12 comps
| Address | Beds | Baths | Sqft | Rent | $/sqft | DOM | Units | Dist |
|---|---|---|---|---|---|---|---|---|
| 3438 W Villa Rdg Unit A Peoria, IL | 2.0 | 1.5 | 874 | $1,200 | $1.37 | 21d | 1 | 0.05mi |
| 3444 W Dorchester Rdg Peoria, IL | 2.0 | 2.0 | 1089 | $1,275 | $1.17 | 13d | 1 | 0.11mi |
| 3601 N Kingston Dr Peoria, IL | 2.0 | 2.0 | 1030 | $1,420 | $1.38 | 13d | 3 | 0.46mi |
| 2600 N Lavalle Ct Peoria, IL | 1.0–3.0 | 1.0–2.0 | 803 | $1,000 | $1.25 | 13d | 26 | 0.58mi |
| 2700 W Forrest Hill Ave Peoria, IL | 2.0 | 1.0 | 850 | $850 | $1.00 | 43d | 1 | 0.75mi |
| 2511 W Wardcliffe Dr Unit H Peoria, IL | 2.0 | 1.0 | 800 | $875 | $1.09 | 43d | 1 | 0.90mi |
| 2920 N Rockwood Dr Apt B Peoria, IL | 2.0 | 1.0 | 800 | $895 | $1.12 | 13d | 1 | 0.92mi |
| 2805 W Larchmont Ln Peoria, IL | 1.0–2.0 | 1.0 | 695 | $1,060 | $1.53 | 13d | 3 | 0.98mi |
| 2109 N Abbey Cir Peoria, IL | 3.0 | 2.0 | 1088 | $1,009 | $0.93 | 13d | 1 | 1.04mi |
| 2610 N Renwood Ave Peoria, IL | 2.0 | 1.0 | 904 | $1,300 | $1.44 | 13d | 1 | 1.12mi |
| 3629 N Leroy Ave Unit A Peoria, IL | 2.0 | 1.0 | 1000 | $1,150 | $1.15 | 43d | 1 | 1.17mi |
| 1801 N Gentry Ln West Peoria, IL | 3.0 | 1.0 | 1000 | $1,650 | $1.65 | 13d | 1 | 1.41mi |
HOA detail
- Monthly dues
- $175 · $2,100/yr
Listing history 28 events
-
2026-06-19days on market $69,900 Active 43 DOM
-
2026-06-18days on market $69,900 Active 42 DOM
-
2026-06-17days on market $69,900 Active 41 DOM
-
2026-06-16days on market $69,900 Active 40 DOM
-
2026-06-15days on market $69,900 Active 39 DOM
-
2026-06-14days on market $69,900 Active 37 DOM
-
2026-06-13days on market $69,900 Active 36 DOM
-
2026-06-10days on market $69,900 Active 34 DOM
-
2026-06-09days on market $69,900 Active 33 DOM
-
2026-06-08days on market $69,900 Active 32 DOM
-
2026-06-07days on market $69,900 Active 31 DOM
-
2026-06-03days on market $69,900 Active 27 DOM
-
2026-06-02days on market $69,900 Active 26 DOM
-
2026-06-01days on market $69,900 Active 25 DOM
-
2026-05-31days on market $69,900 Active 24 DOM
-
2026-05-30days on market $69,900 Active 23 DOM
-
2026-05-07$69,900 Active
-
2025-12-17historical
-
2021-08-06historical
-
2021-08-06historical
-
2007-05-29soldstatus $66,500
-
2007-05-25soldstatus $61,250
-
2007-02-22$72,500
-
2006-08-11soldstatus $47,500
-
2006-07-07$64,900
-
1999-01-20soldstatus $46,500
-
1998-03-18soldstatus $40,000
-
1997-12-30soldstatus $39,500
ⓘ Source: listings_history table (triggers on properties + properties_extension) + one-shot
backfill from property_details.listing_events for pre-trigger history.
Climate risk First Street
- Flood 1/10 Low FEMA zone X · 0% chance over 30 yrs
- Wildfire 1/10 Low
- Heat 3/10 Moderate 7 d/yr ≥104°F today · 18 d/yr by 30 yrs out
- Wind 2/10 Low 100% chance of damaging wind over 30 yrs
- Air quality 3/10 Moderate 1 unhealthy d/yr today · 3 by 30 yrs out
Nearby sold comps map
Loading sold comps map…
Walkable amenities ~0.75 mi
Loading nearby amenities…
Taxation est. · year 1
- Rental income
- $13,951
- − Mortgage interest
- −$3,915
- − Property taxes
- −$1,048
- − Insurance
- −$350
- − Repairs & maintenance
- −$1,116
- − Management
- −$1,116
- − HOA
- −$2,100
- − Depreciation
- −$2,033
- Taxable income
- $2,272
- Est. tax owed @ 24.0%
- −$545
- After-tax cash flow
- $2,580/yr
For passive investors: Depreciation is non-cash, so a rental often shows a tax loss while cash-flowing — sheltering income. Rental losses are passive: they offset passive income freely, and up to $25,000/yr can offset ordinary (W-2) income if you actively participate and your MAGI is under $100k (phasing out to $0 by $150k); unused losses carry forward. On sale, claimed depreciation is recaptured at up to 25%, and gains may owe capital-gains tax (a 1031 exchange can defer both). Figures are a year-1 estimate at your 24.0% rate — not tax advice; consult a CPA.
Schools (NCES district)
- District
- Limestone Chsd 310
- NCES district ID
- 1722950
- Math proficiency
- 25% ▲ 5.00%
- Reading proficiency
- 35% ▲ 4.00%
- Median HH income
- $49,759
- Composite
- 28.99/100
- National rank
- #11932
- State rank
- #486 of 919 in IL
Livability — Peoria
- Score
- 73/100
- State rank
- #270
- US rank
- #5096
Category grades
Schools grade is shown separately in the Schools card above.
Census & demographics
- Census place
- Peoria, IL
- County
- Peoria County · 120,495 people
- City population
- 114,670
- Metro
- Peoria, IL
- Population (ZIP)
- 27,370
- Household income
- $66,924
- Rent vs Own
- Severe rent burden
- 1179.0
Population outlook (Peoria County) Hauer SSP2
- Today (2025)
- 183,007 people
- By 2030
- 179,643 · -1.8%
- By 2040
- 171,782 · -6.1%
- By 2050
- 163,508 · -10.7%
- By 2075
- 140,178 · -23.4%
- By 2100
- 114,493 · -37.4%
Race, ethnicity, and origin ACS 2023
- Neighborhood character
- Predominantly White (70%)
- Race & ethnicity
- White 70% Black 17% Two or more races 5% Asian 5% Hispanic / Latino 5%
- Common ancestry
- Romanian 2% Lithuanian 2% Italian 2%
- Foreign-born
- 9% · Canada, South Korea, China
- Languages at home
- 92% English-only · Spanish 2% Other Asian/Pacific 2% Other Indo-European 1%
Political lean MEDSL · Peoria
- 2024 margin
- Toss-up / Even · D 51.5% · R 46.9% · Other 1.6%
- 2008→2024 swing
- -9.2pp toward R · 2008: 13.9pp · 2024: 4.7pp
- All cycles
- 2024: D+4.7 2020: D+6.3 2016: D+2.8 2012: D+4.4 2008: D+13.9
Not yet ingested
- Civics
- —
Market trends
- HPI YoY
- ▼ -76.07%
- Current HPI
- 185.122
- Rent YoY
- ▲ 10.35%
- Metro
- Peoria, IL
- State GDP YoY
- ▲ 1.59%
- F500 in state
- 60
Industry mix (Fortune 500 HQ in IL)
| Industry | F500 HQs | Revenue |
|---|---|---|
| Insurance | 4 | $201B |
|
||
| Consumer Goods | 4 | $87B |
|
||
| Industrial Machinery | 3 | $64B |
|
||
| Healthcare | 2 | $55B |
|
||
| Retail / Pharmacy | 1 | $148B |
|
||
| Agriculture / Food | 1 | $86B |
|
||
Price history
+77.0% since first listed12 events — show timeline
- 2026-05-07 Listed $69,900 RMLSA as Distributed by MLS Grid
- 2025-12-17 Listing Removed — MRED as Distributed by MLS Grid
- 2021-08-06 Listing Removed — RMLSA as Distributed by MLS Grid
- 2021-08-06 Listing Removed — RMLSA as Distributed by MLS Grid
- 2007-05-29 Sold (Public Records) $66,500 Public Records
- 2007-05-25 Sold (MLS) $61,250 RMLSA as Distributed by MLS Grid
- 2007-02-22 Listed $72,500 RMLSA as Distributed by MLS Grid
- 2006-08-11 Sold (MLS) $47,500 RMLSA as Distributed by MLS Grid
- 2006-07-07 Listed $64,900 RMLSA as Distributed by MLS Grid
- 1999-01-20 Sold (Public Records) $46,500 Public Records
- 1998-03-18 Sold (Public Records) $40,000 Public Records
- 1997-12-30 Sold (Public Records) $39,500 Public Records
Cash-flow waterfall
monthlySold comps — $/sqft
last 12 mo · ≤1 miLoading sold comps…