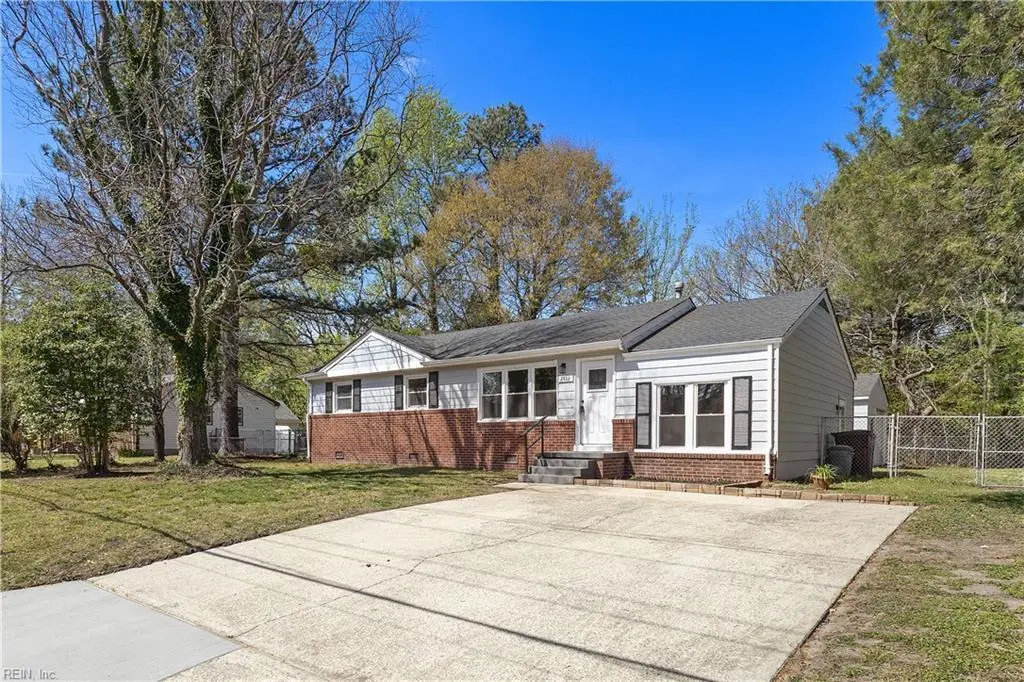
2712 Fenway Ave · Chesapeake, VA
Flood risk 4/10 · Minor
- FEMA flood zone
- X (unshaded)
- Chance of flooding over 30 yrs
- 0.2%
- Est. flood insurance / yr
- $507 – $1,088
Fire risk 1/10 · Minimal
- Est. fire insurance / yr
- $666 – $1,236
Heat risk 9/10 · Severe
- Hot days now (above 107°F)
- 7 days/yr
- Hot days in 30 yrs
- 16 days/yr
Wind risk 8/10 · Major
- Chance of severe wind over 30 yrs
- 80.0%
Air-quality risk 5/10 · Moderate
- Unhealthy air days now
- 6 days/yr
- Unhealthy air days in 30 yrs
- 7 days/yr
Risk factors via First Street. Map © Google.
Why this score? — see what drove the F grade
The composite is a weighted blend of 9 inputs, each scored 0–100. Each bar is that input's sub-score; the figure is the points it added to the 100-point composite (weight × sub-score).
- Cash flow +8.4/30.0
- Schools +5.8/10.0
- Rent growth +4.0/5.0
- Livability +3.5/5.0
- Condition / age +2.5/5.0
- DSCR +2.3/10.0
- ARV discount +2.1/15.0
- 1% rule +1.8/10.0
- Appreciation +0.0/10.0
$358,900
🖨 Deal sheet 📄 Offer letter ✓ Due diligence
Listing remarks
Beautifully renovated ranch in Chesapeake. This 4 bedroom, 1.5 bath oasis has new windows, roof, bathroom vanities, kitchen cabinets, stainless steel appliances, granite countertops, HVAC system, luxury vinyl flooring, with a private backyard and detached garage. Make this fantastic home your dream home.
Key facts
- Garage
- Built 1963
- Listed 57 days
Property features AI
Finance
- HOA & community: No HOA fees reported
Exterior
- Parking: Detached 1-car garage; Driveway parking (2 spaces)
- Utilities: City/County water; City/County sewer; Electric water heater
- Home design: Detached single-family home; Ranch style; Single-story (1 living level); Simple ownership; Facing wooded view
- Construction: Brick and vinyl siding; Asphalt shingle roof; Crawl space foundation; Built as a detached ranch
- Exterior features: Deck; Back yard fenced with chain link; Wooded view
Interior
- Kitchen: Dishwasher; Microwave; Electric range; Refrigerator
- Bedrooms: First-floor master bedroom; Bedroom and full bathroom on first floor
- Flooring: Ceramic floors; Laminate floors
- Bathrooms: 1 full bath; 1 half bath
- Heating & cooling: Natural gas heating; Central air conditioning
- Interior features: Cable hookup; Converted garage; Utility room
- Laundry & utility: Washer hookup; Dryer hookup
Neighborhood map
What this means for you Summary
Snapshot
- This is a 3-bed/1.0-bath single-family listed at $359k.
Deal economics
- At list price, monthly cash flow is $-320 ($-4k/yr) — negative.
- To cash-flow at today's rent, offer at most $302k (15.7% below list).
- To meet the 1% rule (rent ≥ 1% of price), the offer needs to be $245k (31.8% below list).
- Recommended offer: $245k (31.8% below list) — sets the bar for 1% rule.
- Cap rate 5.2% vs local median 3.7% in Chesapeake — top-decile yield for the area; either an underpriced asset or a hidden risk that comps aren't pricing in. Stress-test before assuming the spread holds.
Location & tenants
- Location reads 70/100 on livability (#236 in VA) — a middle-class / working-renter tenant base. Strengths: employment A+, housing A+; Watch: crime C-, cost of living C-, amenities F.
- Chesapeake City Public School District (suburban): math 58% / reading 74% proficiency, ranked #31 of 131 in VA (top 24%) — acceptable for families but not a draw, mixed tenant base, ~2y average lease.
- Zoned schools: Deep Creek Elementary (math 66% / reading 72%, grade A-, #351 of 1,108 statewide, top 32%, 763 students, 45% FRL); Deep Creek High (math 70% / reading 82%, grade A-, #102 of 319 statewide, top 32%, 1,597 students, 49% FRL) — zoned schools average 47% FRL vs 28% district-wide (19 pts higher); higher-poverty schools than district average — tighter screening recommended.
- Market conditions: Rents rising fast (+6.1%/yr); 177 active listings in the ZIP; 10 comparable units currently listed for rent nearby; rentals at typical pace (median 24d on market — plan ~3-4 weeks tenant-placement turnaround); solid renter incomes; 597 units permitted in Chesapeake city in 2024 (0 in 5+ unit buildings).
Forward outlook
- Local home prices are declining (-3.0%/yr); year-one equity from $2k of loan paydown is wiped out by about $11k of value loss. Plan a longer hold.
- Chesapeake County population projected at +21% by 2050 — long-run rental-demand tailwind backs the buy-and-hold thesis.
Negotiation context
- It's been on market 57 days — a 3% lower offer ($348k) is reasonable based on typical stale-listing flexibility.
- Current owner paid $165k; list at $359k implies a 118% gain — meaningful room to come down on a strong offer.
Risks & watch-outs
- Climate carrying-cost: severe wind risk, 80% chance of damaging wind over 30y; extreme-heat days projected 7→16/yr by 2055 (HVAC capex compounding) — expect insurance premiums to compound above CPI over the hold.
Questions for the listing agent
- What do current leases actually rent for vs. the listed asking? Can we see a recent rent roll and the last 12 months of T-12 income?
- It's been on market 57 days. Have you received any prior offers? Is the seller open to a 32% concession, seller financing, or rate buy-down credit?
- Built in 1963 — when were the roof, HVAC, electrical panel, plumbing, and water heater last replaced?
- Is there a deadline driving the sale (1031 exchange, divorce, estate, relocation)? That informs how much negotiation room exists.
- Schools are A-rated — typically a magnet for longer-tenancy family renters. What's the average tenant stay here, and is there a school-zone premium baked into asking?
- The area grade is low — what's the realistic commute time and amenity access for the typical tenant pool here? Any planned neighborhood developments (good or bad) we should know about?
- What's the average days-on-market for RENTAL listings here right now (not sales)? A rising rental-DOM trend means longer vacancies and softer asking-rent achievability than the comps imply.
- What's the recent tenant-quality profile in this submarket — average credit score on applications, eviction rate, late-payment / NSF rate, and stable-employment percentage? A property-management company in the area should have these aggregated.
- How much new for-sale + rental construction is in the pipeline within 1–3 miles? Heavy new supply typically softens prices + rents 12–24 months out; constrained supply supports both.
Investment metrics
- 1% rule
- 0.68% ✗
- Cap rate
- 5.22%
- Cash-on-cash
- -3.82%
- DSCR
- 0.83
- GRM
- 12.2
CMA / ARV
- ARV (on-the-fly)
- $320,535
- Comps found
- 11
Show comp detail 11 sales within ~0.75 mi
| Address | Dist | Beds/Ba | Sqft | Sold | Price | $/sf | Match |
|---|---|---|---|---|---|---|---|
| 2712 Fenway Ave | 0.00mi | 4/1.5 (+1) | 1,350 (+7%) | 1mo | $358,900 | $266 | 80 |
| 2700 Hoyt Dr | 0.18mi | 3/1.0 | 1,314 (+4%) | 6mo | $332,000 | $253 | 78 |
| 2856 Flag Rd | 0.45mi | 3/1.0 | 1,319 (+5%) | 1mo | $325,000 | $246 | 70 |
| 2825 Willowwood Dr | 0.64mi | 3/1.5 | 1,272 (+1%) | 6mo | $305,000 | $240 | 61 |
| 820 Henry Ave | 0.58mi | 3/1.5 | 1,176 (-6%) | 0mo | $300,000 | $255 | 60 |
| 237 Stubbs Dr | 0.65mi | 3/2.0 | 1,240 (-1%) | 9mo | $340,000 | $274 | 56 |
| 2620 Hillard St | 0.31mi | 4/1.0 (+1) | 1,428 (+14%) | 9mo | $334,900 | $235 | 50 |
| 448 Plummer Dr | 0.68mi | 3/1.5 | 1,126 (-10%) | 4mo | $365,000 | $324 | 46 |
| 3229 Troy Ln | 0.75mi | 4/2.0 (+1) | 1,303 (+4%) | 6mo | $370,000 | $284 | 45 |
| 413 George Washington Hwy N | 0.70mi | 2/2.0 (-1) | 1,356 (+8%) | 2mo | $151,600 | $112 | 44 |
| 473 W Blanche Dr | 0.74mi | 3/2.0 | 1,200 (-4%) | 13mo | $338,000 | $282 | 43 |
Match score weights: distance 35% · size 25% · config 20% · recency 20%. Top-matched comps best support the ARV.
Projected returns pro-forma
-3.0% appreciation · 6.13% rent growth · sell at horizon
- IRR
- -19.7%
- Equity multiple
- 0.30×
- Total profit
- $-70,675
- Equity at exit
- $53,513
- IRR
- -7.5%
- Equity multiple
- 0.47×
- Total profit
- $-53,390
- Equity at exit
- $31,031
Cash invested: $100,492 (down + closing). Projections, not guarantees.
Landlord ↔ Tenant lean methodology
- Overall (STATE)
- 55 Moderately Landlord-Leaning
- State Virginia
- 55 Moderately Landlord-Leaning · D+2
- County
- — inherits STATE
- City
- — inherits STATE
ZIP-level market 23323
- Home prices YoY
- -21.8%
- Rents YoY
- 6.1%
- Active inventory
- 177
- Price-to-rent
- 12.2×
Monthly cashflow live
- Estimated rent
- $2,448 high interval (Pro) →
- Mortgage (P&I)
- −$1,882
- Tax from tax record
- −$222 /mo · $2,663/yr
- Insurance
- −$150
- HOA
- −$0
- Vacancy / Maint / Mgmt
- −$514
- Net cashflow
- $-320
Break-even live
UW: 25.0% down · 7.5% · 30yr · 1.5% tax · 5.0% vac · 8.0% maint · 8.0% mgmt
Financing live
Cash to close
- Down payment
- $89,725
- Closing costs
- $10,767
- Reserves months
- —
- Total cash needed
- —
Loan-product check · same deal, 3 products live
Conventional
25% down · 7.5% · 30yr
- Down + closing
- —
- Monthly P&I
- —
- Monthly cashflow
- —
- DSCR
- —
- Eligible?
- —
Personal DTI + credit; lowest rate.
DSCR
20% down · 8.5% · 30yr
- Down + closing
- —
- Monthly P&I
- —
- Monthly cashflow
- —
- DSCR
- —
- Eligible?
- —
No personal income docs; deal must DSCR.
Hard money
10% down · 12.0% · 12mo
- Down + closing
- —
- Monthly P&I
- —
- Monthly cashflow
- —
- DSCR
- —
- Eligible?
- —
Short-term bridge; refi at stabilization.
Rent comps 10 comps
| Address | Beds | Baths | Sqft | Rent | $/sqft | DOM | Units | Dist |
|---|---|---|---|---|---|---|---|---|
| 622 Wooddale Ct Chesapeake, VA | 4.0 | 2.0 | 1475 | $2,450 | $1.66 | 23d | 1 | 0.22mi |
| 2509 Meiggs Rd Chesapeake, VA | 3.0 | 2.0 | 1664 | $2,500 | $1.50 | 10d | 1 | 0.45mi |
| 2604 Townhouse Ln Chesapeake, VA | 1.0–3.0 | 1.5 | 1050 | $1,885 | $1.80 | 2d | 1 | 1.01mi |
| 2270 Grace St Chesapeake, VA | 3.0 | 2.0 | 1384 | $2,400 | $1.73 | 23d | 1 | 1.15mi |
| 2400 Broadnax Cir Chesapeake, VA | 4.0 | 2.0 | 1800 | $2,575 | $1.43 | 21d | 1 | 1.17mi |
| 908 Lake Village Dr Chesapeake, VA | 2.0–3.0 | 1.0 | 972 | $1,508 | $1.55 | 2d | 7 | 1.35mi |
| 102 Diamond Ave Unit B Chesapeake, VA | 2.0 | 1.0 | 900 | $1,350 | $1.50 | 23d | 1 | 1.36mi |
| 3208 Sir Meliot Dr Chesapeake, VA | 3.0 | 2.0 | 1400 | $2,295 | $1.64 | 23d | 1 | 1.36mi |
| 846 Drawbridge Dr Chesapeake, VA | 3.0 | 2.0 | 1400 | $2,600 | $1.86 | 23d | 1 | 1.40mi |
| 2164 Shipyard Rd Chesapeake, VA | 4.0 | 2.0 | 1459 | $2,750 | $1.88 | 7d | 1 | 1.42mi |
Listing history 4 events
-
2026-05-06historical Active Under Contract
-
2026-04-02$358,900 Active
-
2026-01-23soldstatus $165,000
-
2013-08-15soldstatus $138,500
ⓘ Source: listings_history table (triggers on properties + properties_extension) + one-shot
backfill from property_details.listing_events for pre-trigger history.
Tax reassessment forecast VA · Resets to sale price
- Current annual tax
- $2,663 · $222/mo
- Projected year-2 tax
- $2,943 · $245/mo
- Expected delta
- +$280/yr (+$23/mo · 10.5%)
ⓘ Screening estimate from a state-policy table — verify with the county assessor before closing.
Climate risk First Street
- Flood 4/10 Moderate FEMA zone X (unshaded) · 20% chance over 30 yrs
- Wildfire 1/10 Low
- Heat 9/10 Extreme 7 d/yr ≥107°F today · 16 d/yr by 30 yrs out
- Wind 8/10 Severe 80% chance of damaging wind over 30 yrs
- Air quality 5/10 Major 6 unhealthy d/yr today · 7 by 30 yrs out
Nearby sold comps map
Loading sold comps map…
Walkable amenities ~0.75 mi
Loading nearby amenities…
Taxation est. · year 1
- Rental income
- $29,375
- − Mortgage interest
- −$20,104
- − Property taxes
- −$2,663
- − Insurance
- −$1,794
- − Repairs & maintenance
- −$2,350
- − Management
- −$2,350
- − Depreciation
- −$10,441
- Taxable loss
- −$10,328
- Est. tax savings @ 24.0%
- +$2,479
- After-tax cash flow
- $-1,359/yr
For passive investors: Depreciation is non-cash, so a rental often shows a tax loss while cash-flowing — sheltering income. Rental losses are passive: they offset passive income freely, and up to $25,000/yr can offset ordinary (W-2) income if you actively participate and your MAGI is under $100k (phasing out to $0 by $150k); unused losses carry forward. On sale, claimed depreciation is recaptured at up to 25%, and gains may owe capital-gains tax (a 1031 exchange can defer both). Figures are a year-1 estimate at your 24.0% rate — not tax advice; consult a CPA.
Schools (NCES district)
- District
- Chesapeake City Public School District
- NCES district ID
- 5100810
- Math proficiency
- 58% ▼ -29.00%
- Reading proficiency
- 74% ▼ -7.00%
- Median HH income
- $69,356
- Composite
- 57.84/100
- National rank
- #1047
- State rank
- #31 of 131 in VA
Livability — Chesapeake
- Score
- 70/100
- State rank
- #236
- US rank
- #7942
Category grades
Schools grade is shown separately in the Schools card above.
Census & demographics
- Census place
- Chesapeake, VA
- County
- Chesapeake City · 253,091 people
- City population
- 253,091
- Metro
- Virginia Beach-Norfolk-Newport News, VA-NC
- Population (ZIP)
- 43,043
- Household income
- $108,730
- Rent vs Own
- Severe rent burden
- 699.0
Population outlook (Chesapeake County) Hauer SSP2
- Today (2025)
- 263,804 people
- By 2030
- 276,798 · +4.9%
- By 2040
- 299,906 · +13.7%
- By 2050
- 318,284 · +20.7%
- By 2075
- 362,137 · +37.3%
- By 2100
- 372,225 · +41.1%
Race, ethnicity, and origin ACS 2023
- Neighborhood character
- Diverse neighborhood (Simpson 0.62)
- Race & ethnicity
- White 54% Black 27% Two or more races 11% Hispanic / Latino 8% Asian 3%
- Hispanic origin (detail)
- Mexican 2% Puerto Rican 4%
- Common ancestry
- Italian 3% Romanian 2% Slovak 2%
- Foreign-born
- 5% · Canada, South Korea, Jamaica
- Languages at home
- 93% English-only · Spanish 4% Tagalog/Filipino 1% Other Indo-European 1%
Political lean MEDSL · Chesapeake
- 2024 margin
- Toss-up / Even · D 51.3% · R 47.5% · Other 1.2%
- 2008→2024 swing
- +2.5pp toward D · 2008: 1.3pp · 2024: 3.8pp
- All cycles
- 2024: D+3.8 2020: D+6.5 2016: R+1.3 2012: D+1.1 2008: D+1.3
Not yet ingested
- Civics
- —
Market trends
- HPI YoY
- ▼ -86.09%
- Current HPI
- 309.6925
- Rent YoY
- ▲ 6.13%
- Metro
- Virginia Beach-Norfolk-Newport News, VA-NC
- State GDP YoY
- ▲ 2.40%
- F500 in state
- 50
Industry mix (Fortune 500 HQ in VA)
| Industry | F500 HQs | Revenue |
|---|---|---|
| Aerospace / Defense | 4 | $236B |
|
||
| Technology / Defense | 3 | $32B |
|
||
| Financial Services | 2 | $176B |
|
||
| Utilities | 2 | $27B |
|
||
| Insurance | 2 | $25B |
|
||
| Technology | 2 | $15B |
|
||
Price history
+159.1% since first listed4 events — show timeline
- 2026-05-06 Contingent — REINMLS
- 2026-04-02 Listed $358,900 REINMLS
- 2026-01-23 Sold (Public Records) $165,000 Public Records
- 2013-08-15 Sold (Public Records) $138,500 Public Records
Property tax history
+3.4%/yrLatest (2025): $2,663 · +4.9% YoY. Source: county tax records.
Cash-flow waterfall
monthlySold comps — $/sqft
last 12 mo · ≤1 miLoading sold comps…