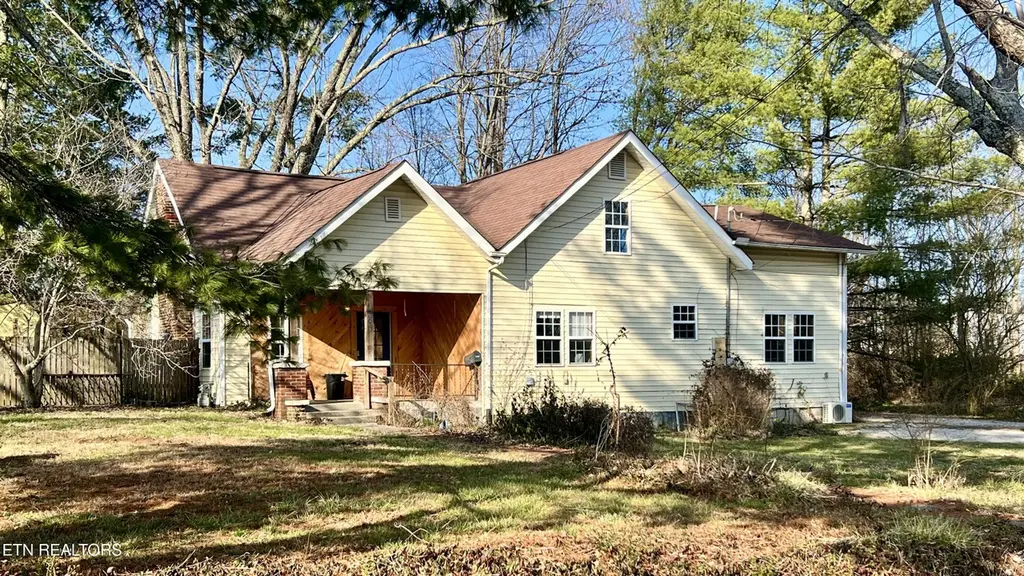
426 Rosedale Ave · Jamestown, TN
Flood risk 1/10 · Minimal
- FEMA flood zone
- X (unshaded)
- Chance of flooding over 30 yrs
- 0.0%
- Est. flood insurance / yr
- $507 – $1,088
Fire risk 5/10 · Moderate
- Est. fire insurance / yr
- $949 – $1,763
Heat risk 3/10 · Minor
- Hot days now (above 99°F)
- 7 days/yr
- Hot days in 30 yrs
- 20 days/yr
Wind risk 3/10 · Minor
- Chance of severe wind over 30 yrs
- 6.0%
Air-quality risk 2/10 · Minimal
- Unhealthy air days now
- 2 days/yr
- Unhealthy air days in 30 yrs
- 2 days/yr
Risk factors via First Street. Map © Google.
Why this score? — see what drove the C grade
The composite is a weighted blend of 9 inputs, each scored 0–100. Each bar is that input's sub-score; the figure is the points it added to the 100-point composite (weight × sub-score).
- Cash flow +14.6/30.0
- ARV discount +13.2/15.0
- Appreciation +10.0/10.0
- DSCR +4.5/10.0
- Livability +3.1/5.0
- 1% rule +2.8/10.0
- Rent growth +2.5/5.0
- Condition / age +2.5/5.0
- Schools +2.1/10.0
$200,000
🖨 Deal sheet (PDF) 📄 Offer letter ✓ Due diligence
Listing remarks MLS
This home has multiple bedrooms and lots of potential. The home has a partially fenced backyard with a chicken coup and raised flower beds. Outdoor storage building is staying with the home. An amazing gas cooking range will be with the home and other appliances staying include washer, dryer, fridge, and microwave. This house has a separated master bedroom with his own mini split system and walk in closet. Your new home is within minutes of local shopping and dining. The Big South Fork National Park and Pickett State Park are within a short drive. There are multiple adventures for you waiting at your new home. Home is being sold in ''AS-IS'' condition.
Key facts
- Chicken coup
- Gas cooking range
- Raised flower beds
Tags
Neighborhood map
What this means for you Summary
Snapshot
- This is a 5-bed/1.0-bath single-family listed at $200k.
Deal economics
- At list price, monthly cash flow is $49 ($591/yr) — positive.
- The deal already cash-flows at list — no discount required.
- To meet the 1% rule (rent ≥ 1% of price), the offer needs to be $156k (22.0% below list).
- Recommended offer: $156k (22.0% below list) — sets the bar for 1% rule.
Location & tenants
- Location reads 61/100 on livability (#250 in TN) — a middle-class / working-renter tenant base. Strengths: cost of living A+, health & safety A+; Watch: housing D, crime F, amenities F.
- Fentress County (rural): math 24% / reading 27% proficiency, ranked #91 of 139 in TN (top 66%) — low school quality limits family demand, transient renter base, plan for 1-2y turnover; 65% free/reduced lunch — lower-income household profile, screen leases tightly.
- Zoned schools: South Fentress Elementary School (math 19% / reading 25%, grade F, #601 of 952 statewide, top 66%, 632 students, 0% FRL); Clarkrange High School (math 17% / reading 44%, grade F, #73 of 332 statewide, top 22%, 260 students, 0% FRL) — zoned schools average 0% FRL vs 65% district-wide (65 pts lower); this property's tenant base skews higher-income than the district average.
- Market conditions: 325 active listings in the ZIP.
Forward outlook
- In year one you build about $21k of equity ($1k loan paydown + $20k appreciation (10.0% local appreciation)).
- Fentress County population projected at -19% by 2050 — secular population decline; favor cash flow + early exit over multi-decade hold.
- At projected returns (10.0% appreciation + 3.0% rent growth), your $56k cash investment doubles in ~3 years — after that, you're playing with house money.
- By year 2, paydown + projected appreciation supports a ~$34k cash-out refi (75% LTV) — recoverable capital for the next deal without selling this one.
Negotiation context
- It's been on market 110 days — a 9% lower offer ($182k) is reasonable based on typical stale-listing flexibility.
- 3 sale attempts since 10y ago; this cycle's ask has dropped $25k (11%) from the opening price — seller is motivated, your offer sets the floor, not the list.
- Current owner paid $43k; list at $200k implies a 365% gain — meaningful room to come down on a strong offer.
Risks & watch-outs
- Watch-outs: built in 1945 — expect roof / HVAC / electrical / plumbing capex.
- Climate carrying-cost: moderate wildfire risk — expect insurance premiums to compound above CPI over the hold.
Questions for the listing agent
- It's been on market 110 days. Have you received any prior offers? Is the seller open to a 22% concession, seller financing, or rate buy-down credit?
- Built in 1945 — when were the roof, HVAC, electrical panel, plumbing, and water heater last replaced?
- Why hasn't it sold? Are there any deal-killer items the seller is aware of (foundation, flood, title, zoning, code violations)?
- Is there a deadline driving the sale (1031 exchange, divorce, estate, relocation)? That informs how much negotiation room exists.
- Schools are F-rated, which usually means shorter tenancies and higher turnover. Who's the typical renter profile here, and what's been the actual vacancy rate?
- Crime grade is F in this area — have there been break-ins, vandalism, or insurance claims at this property in the last 3 years? What carrier currently insures it and at what premium?
- What's the average days-on-market for RENTAL listings here right now (not sales)? A rising rental-DOM trend means longer vacancies and softer asking-rent achievability than the comps imply.
- What's the recent tenant-quality profile in this submarket — average credit score on applications, eviction rate, late-payment / NSF rate, and stable-employment percentage? A property-management company in the area should have these aggregated.
- How much new for-sale + rental construction is in the pipeline within 1–3 miles? Heavy new supply typically softens prices + rents 12–24 months out; constrained supply supports both.
Investment metrics
- 1% rule
- 0.78% ✗
- Cap rate
- 6.59%
- Cash-on-cash
- 1.06%
- DSCR
- 1.05
- GRM
- 10.7
CMA / ARV
- ARV (median comp)
- $229,236
- List price
- $200,000
- Delta
- -12.75%
- Verdict
- UNDERPRICED
- Comps
- 5 within 1.0 mi
Projected returns pro-forma
10.0% appreciation · 3.0% rent growth · sell at horizon
- IRR
- 25.0%
- Equity multiple
- 3.00×
- Total profit
- $111,965
- Equity at exit
- $180,176
- IRR
- 22.1%
- Equity multiple
- 6.84×
- Total profit
- $327,055
- Equity at exit
- $388,556
Cash invested: $56,000 (down + closing). Projections, not guarantees.
Landlord ↔ Tenant lean methodology
- Overall (STATE)
- 87 Strongly Landlord-Friendly
- State Tennessee
- 87 Strongly Landlord-Friendly · R+13
- County
- — inherits STATE
- City
- — inherits STATE
ZIP-level market 38556
- Home prices YoY
- 13.5%
- Active inventory
- 325
- Price-to-rent
- 10.7×
Monthly cashflow live
- Estimated rent
- $1,560 medium interval (Pro) →
- Mortgage (P&I)
- −$1,049
- Tax from tax record
- −$51 /mo · $616/yr
- Insurance
- −$83
- HOA
- −$0
- Vacancy / Maint / Mgmt
- −$328
- Net cashflow
- $49
Break-even live
Sensitivity live
| Price | -10% $162 | -5% $106 | +0% $49 | +5% $-7 | +10% $-64 |
|---|---|---|---|---|---|
| Rent | -10% $-74 | -5% $-12 | +0% $49 | +5% $111 | +10% $173 |
| Rate | -1.0pp $150 | -0.5pp $100 | base $49 | +0.5pp $-3 | +1.0pp $-55 |
UW: 25.0% down · 7.5% · 30yr · 1.5% tax · 5.0% vac · 8.0% maint · 8.0% mgmt
Financing live
Cash to close
- Down payment
- $50,000
- Closing costs
- $6,000
- Reserves months
- —
- Total cash needed
- —
Loan-product check · same deal, 3 products live
Conventional
25% down · 7.5% · 30yr
- Down + closing
- —
- Monthly P&I
- —
- Monthly cashflow
- —
- DSCR
- —
- Eligible?
- —
Personal DTI + credit; lowest rate.
DSCR
20% down · 8.5% · 30yr
- Down + closing
- —
- Monthly P&I
- —
- Monthly cashflow
- —
- DSCR
- —
- Eligible?
- —
No personal income docs; deal must DSCR.
Hard money
10% down · 12.0% · 12mo
- Down + closing
- —
- Monthly P&I
- —
- Monthly cashflow
- —
- DSCR
- —
- Eligible?
- —
Short-term bridge; refi at stabilization.
Listing history 25 events
-
2026-06-21days on market $200,000 Active 110 DOM
-
2026-06-21days on market $200,000 Active 109 DOM
-
2026-06-18days on market $200,000 Active 107 DOM
-
2026-06-17pricedays on market $200,000 Active 106 DOM
-
2026-06-16days on market $210,000 Active 105 DOM
-
2026-06-15days on market $210,000 Active 104 DOM
-
2026-06-13days on market $210,000 Active 102 DOM
-
2026-06-12days on market $210,000 Active 101 DOM
-
2026-06-09days on market $210,000 Active 98 DOM
-
2026-06-08days on market $210,000 Active 97 DOM
-
2026-06-08days on market $210,000 Active 96 DOM
-
2026-06-07days on market $210,000 Active 95 DOM
-
2026-06-03days on market $210,000 Active 92 DOM
-
2026-06-02days on market $210,000 Active 91 DOM
-
2026-06-01days on market $210,000 Active 90 DOM
-
2026-05-31days on market $210,000 Active 89 DOM
-
2026-04-29price $210,000 667-char remark
Show marketing remark (667 chars)
This home has multiple bedrooms and lots of potential. The home has a partially fenced backyard with a chicken coup and raised flower beds. Outdoor storage building is staying with the home. An amazing gas cooking range will be with the home and other appliances staying include washer, dryer, fridge, and microwave. This house has a separated master bedroom with his own mini split system and walk in closet. Your new home is within minutes of local shopping and dining. The Big South Fork National Park and Pickett State Park are within a short drive. There are multiple adventures for you waiting at your new home. Home is being sold in ''AS-IS'' condition.
-
2026-03-03$225,000 Active 667-char remark
Show marketing remark (667 chars)
This home has multiple bedrooms and lots of potential. The home has a partially fenced backyard with a chicken coup and raised flower beds. Outdoor storage building is staying with the home. An amazing gas cooking range will be with the home and other appliances staying include washer, dryer, fridge, and microwave. This house has a separated master bedroom with his own mini split system and walk in closet. Your new home is within minutes of local shopping and dining. The Big South Fork National Park and Pickett State Park are within a short drive. There are multiple adventures for you waiting at your new home. Home is being sold in ''AS-IS'' condition.
-
2018-10-13historical
-
2018-04-16$124,000 Active
-
2018-04-16price $122,000
-
2017-05-01historical
-
2016-05-02$129,000 Active
-
1996-08-12soldstatus $43,000
-
1987-11-12soldstatus $23,571
ⓘ Source: listings_history table (triggers on properties + properties_extension) + one-shot
backfill from property_details.listing_events for pre-trigger history.
Tax reassessment forecast TN · Resets to sale price
- Current annual tax
- $616 · $51/mo
- Projected year-2 tax
- $1,420 · $118/mo
- Expected delta
- +$804/yr (+$67/mo · 130.6%)
ⓘ Screening estimate from a state-policy table — verify with the county assessor before closing.
Climate risk First Street
- Flood 1/10 Low FEMA zone X (unshaded) · 0% chance over 30 yrs
- Wildfire 5/10 Major
- Heat 3/10 Moderate 7 d/yr ≥99°F today · 20 d/yr by 30 yrs out
- Wind 3/10 Moderate 6% chance of damaging wind over 30 yrs
- Air quality 2/10 Low 2 unhealthy d/yr today · 2 by 30 yrs out
Nearby sold comps map
Loading sold comps map…
Walkable amenities ~0.75 mi
Loading nearby amenities…
Taxation est. · year 1
- Rental income
- $18,725
- − Mortgage interest
- −$11,203
- − Property taxes
- −$616
- − Insurance
- −$1,000
- − Repairs & maintenance
- −$1,498
- − Management
- −$1,498
- − Depreciation
- −$5,818
- Taxable loss
- −$2,908
- Est. tax savings @ 24.0%
- +$698
- After-tax cash flow
- $1,289/yr
For passive investors: Depreciation is non-cash, so a rental often shows a tax loss while cash-flowing — sheltering income. Rental losses are passive: they offset passive income freely, and up to $25,000/yr can offset ordinary (W-2) income if you actively participate and your MAGI is under $100k (phasing out to $0 by $150k); unused losses carry forward. On sale, claimed depreciation is recaptured at up to 25%, and gains may owe capital-gains tax (a 1031 exchange can defer both). Figures are a year-1 estimate at your 24.0% rate — not tax advice; consult a CPA.
Schools (NCES district)
- District
- Fentress County
- NCES district ID
- 4701230
- Math proficiency
- 24% ▼ -13.00%
- Reading proficiency
- 27% ▼ -8.00%
- Median HH income
- $30,419
- Composite
- 20.6/100
- National rank
- #8552
- State rank
- #91 of 139 in TN
Livability — Jamestown
- Score
- 61/100
- State rank
- #250
- US rank
- #17976
Category grades
Schools grade is shown separately in the Schools card above.
Census & demographics
- Census place
- Jamestown, TN
- Population (ZIP)
- 12,531
Population outlook (Fentress County) Hauer SSP2
- Today (2025)
- 17,295 people
- By 2030
- 16,749 · -3.2%
- By 2040
- 15,443 · -10.7%
- By 2050
- 14,077 · -18.6%
- By 2075
- 11,482 · -33.6%
- By 2100
- 9,658 · -44.2%
Race, ethnicity, and origin ACS 2023
- Neighborhood character
- Predominantly White (96%)
- Race & ethnicity
- White 96% Two or more races 3% Hispanic / Latino 1%
- Common ancestry
- Serbian 3% Lithuanian 2% Iranian 1%
- Foreign-born
- 1% · Canada
- Languages at home
- 99% English-only · Spanish 1%
Political lean MEDSL · Fentress
- 2024 margin
- Solid R (+75.8) · D 11.8% · R 87.6%
- 2008→2024 swing
- -31.9pp toward R · 2008: -43.9pp · 2024: -75.8pp
- All cycles
- 2024: R+75.8 2020: R+71.3 2016: R+67.5 2012: R+53.4 2008: R+43.9
Not yet ingested
- Civics
- —
Market trends
- HPI YoY
- ▲ 44.31%
- Current HPI
- 372.5676
- Rent YoY
- —
- Metro
- —
- State GDP YoY
- ▲ 2.78%
- F500 in state
- 22
Industry mix (Fortune 500 HQ in TN)
| Industry | F500 HQs | Revenue |
|---|---|---|
| Healthcare | 3 | $91B |
|
||
| Retail | 3 | $72B |
|
||
| Transportation / Logistics | 1 | $88B |
|
||
| Paper / Packaging | 1 | $19B |
|
||
| Insurance | 1 | $13B |
|
||
| Energy | 1 | $12B |
|
||
Price history
+790.9% since first listed9 events — show timeline
- 2026-04-29 Price Changed $210,000 Knoxville MLS
- 2026-03-03 Listed $225,000 Knoxville MLS
- 2018-10-13 Listing Removed — Knoxville MLS
- 2018-04-16 Listed $124,000 Knoxville MLS
- 2018-04-16 Price Changed $122,000 Knoxville MLS
- 2017-05-01 Listing Removed — Knoxville MLS
- 2016-05-02 Listed $129,000 Knoxville MLS
- 1996-08-12 Sold (Public Records) $43,000 Public Records
- 1987-11-12 Sold (Public Records) $23,571 Public Records
Property tax history
+2.6%/yrLatest (2025): $616 · +0.0% YoY. Source: county tax records.
Cash-flow waterfall
monthlySold comps — $/sqft
last 12 mo · ≤1 miLoading sold comps…