242 Symns Pond Rd · Barnet, VT
Flood risk 1/10 · Minimal
- FEMA flood zone
- A
- Chance of flooding over 30 yrs
- 0.0%
- Est. flood insurance / yr
- $946 – $6,584
Fire risk 1/10 · Minimal
- Est. fire insurance / yr
- $480 – $892
Heat risk 2/10 · Minimal
- Hot days now (above 92°F)
- 7 days/yr
- Hot days in 30 yrs
- 16 days/yr
Wind risk 2/10 · Minimal
- Chance of severe wind over 30 yrs
- 3.0%
Air-quality risk 2/10 · Minimal
- Unhealthy air days now
- 1 days/yr
- Unhealthy air days in 30 yrs
- 1 days/yr
Risk factors via First Street. Map © Google.
Why this score? — see what drove the B+ grade
The composite is a weighted blend of 9 inputs, each scored 0–100. Each bar is that input's sub-score; the figure is the points it added to the 100-point composite (weight × sub-score).
- Cash flow +30.0/30.0
- 1% rule +10.0/10.0
- DSCR +10.0/10.0
- Appreciation +8.3/10.0
- ARV discount +7.5/15.0
- Schools +5.0/10.0
- Livability +2.7/5.0
- Rent growth +2.5/5.0
- Condition / age +2.5/5.0
$45,000
🖨 Deal sheet (PDF) 📄 Offer letter ✓ Due diligence
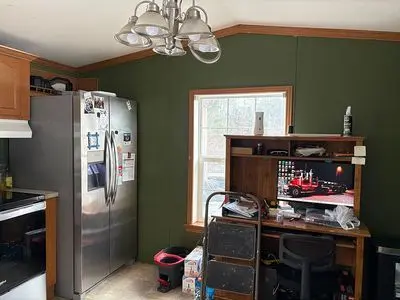
Listing remarks
2007 Skyline single wide mobile home. 14x54ft. 2 Bedroom, 1 Bathroom. Comes with all the appliances. Fridge, stove, dishwasher are only a year old. Washer and dryer are approx 6 years old but work great. Propane furnace serviced last winter. Axels, tires and hitch are underneath it and in good shape we used them to move it to this location 5 years ago. Roof is shingles and in excellent condition! NEEDS TO BE MOVED! The people who were going to buy it can & acirc; & euro; & trade; t now so it & acirc; & euro; & trade; s back for sale.
Key facts
- Built 1986
Neighborhood map
What this means for you Summary
Snapshot
- This is a 2-bed/2.0-bath manufactured listed at $45k.
Deal economics
- At list price, monthly cash flow is $207 ($2k/yr) — positive.
- The deal already cash-flows at list — no discount required.
- Meets the 1% rule at list price ($1k rent vs $45k).
Location & tenants
- Location reads 53/100 on livability (#117 in VT) — a working-class tenant base; expect higher turnover. Strengths: cost of living A+; Watch: crime C-, housing D, schools F.
- Market conditions: 20 active listings in the ZIP; 112 units permitted in Caledonia County in 2024 (15 in 5+ unit buildings).
Forward outlook
- In year one you build about $3k of equity ($311 loan paydown + $3k appreciation (6.6% local appreciation)).
- Caledonia County population projected at -20% by 2050 — secular population decline; favor cash flow + early exit over multi-decade hold.
- At projected returns (6.6% appreciation + 3.0% rent growth), your $13k cash investment doubles in ~3 years — after that, you're playing with house money.
- By year 9, paydown + projected appreciation supports a ~$30k cash-out refi (75% LTV) — recoverable capital for the next deal without selling this one.
Negotiation context
- Only 0 days on market — expect competitive offers; lowballing is unlikely to land.
- Current owner paid $10k; list at $45k implies a 374% gain — meaningful room to come down on a strong offer.
Risks & watch-outs
- Watch-outs: flood insurance adds $314/mo.
- Climate carrying-cost: in FEMA flood zone A (mandatory federal flood insurance) — expect insurance premiums to compound above CPI over the hold.
Questions for the listing agent
- What's the actual annual flood-insurance premium (NFIP or private), and is the property in a SFHA with mandatory coverage?
- Is there a deadline driving the sale (1031 exchange, divorce, estate, relocation)? That informs how much negotiation room exists.
- Schools are F-rated, which usually means shorter tenancies and higher turnover. Who's the typical renter profile here, and what's been the actual vacancy rate?
- What's the average days-on-market for RENTAL listings here right now (not sales)? A rising rental-DOM trend means longer vacancies and softer asking-rent achievability than the comps imply.
- What's the recent tenant-quality profile in this submarket — average credit score on applications, eviction rate, late-payment / NSF rate, and stable-employment percentage? A property-management company in the area should have these aggregated.
- How much new for-sale + rental construction is in the pipeline within 1–3 miles? Heavy new supply typically softens prices + rents 12–24 months out; constrained supply supports both.
Investment metrics
- 1% rule
- 2.37% ✓
- Cap rate
- 20.18%
- Cash-on-cash
- 49.59%
- DSCR
- 3.21
- GRM
- 3.5
CMA / ARV
No comps found within radius.
Projected returns pro-forma
6.6% appreciation · 3.0% rent growth · sell at horizon
- IRR
- 33.2%
- Equity multiple
- 3.22×
- Total profit
- $28,017
- Equity at exit
- $30,020
- IRR
- 30.6%
- Equity multiple
- 6.73×
- Total profit
- $72,149
- Equity at exit
- $56,002
Cash invested: $12,600 (down + closing). Projections, not guarantees.
Landlord ↔ Tenant lean methodology
- Overall (STATE)
- 41 Moderately Tenant-Leaning
- State Vermont
- 41 Moderately Tenant-Leaning · D+15
- County
- — inherits STATE
- City
- — inherits STATE
ZIP-level market 05821
- Home prices YoY
- 3.6%
- Active inventory
- 20
- Price-to-rent
- 3.5×
Monthly cashflow live
- Estimated rent
- $1,067 medium interval (Pro) →
- Mortgage (P&I)
- −$236
- Tax from tax record
- −$68 /mo · $813/yr
- Insurance
- −$19
- Flood insurance flood zone
- −$314 /mo · $3,765/yr
- HOA
- −$0
- Vacancy / Maint / Mgmt
- −$224
- Net cashflow
- $207
Break-even live
Sensitivity live
| Price | -10% $232 | -5% $220 | +0% $207 | +5% $194 | +10% $181 |
|---|---|---|---|---|---|
| Rent | -10% $123 | -5% $165 | +0% $207 | +5% $249 | +10% $291 |
| Rate | -1.0pp $230 | -0.5pp $218 | base $207 | +0.5pp $195 | +1.0pp $183 |
UW: 25.0% down · 7.5% · 30yr · 1.5% tax · 5.0% vac · 8.0% maint · 8.0% mgmt
Financing live
Cash to close
- Down payment
- $11,250
- Closing costs
- $1,350
- Reserves months
- —
- Total cash needed
- —
Loan-product check · same deal, 3 products live
Conventional
25% down · 7.5% · 30yr
- Down + closing
- —
- Monthly P&I
- —
- Monthly cashflow
- —
- DSCR
- —
- Eligible?
- —
Personal DTI + credit; lowest rate.
DSCR
20% down · 8.5% · 30yr
- Down + closing
- —
- Monthly P&I
- —
- Monthly cashflow
- —
- DSCR
- —
- Eligible?
- —
No personal income docs; deal must DSCR.
Hard money
10% down · 12.0% · 12mo
- Down + closing
- —
- Monthly P&I
- —
- Monthly cashflow
- —
- DSCR
- —
- Eligible?
- —
Short-term bridge; refi at stabilization.
Listing history 3 events
-
2026-05-26$45,000
-
2020-06-15soldstatus $9,500
-
2018-06-29soldstatus $25,000
ⓘ Source: listings_history table (triggers on properties + properties_extension) + one-shot
backfill from property_details.listing_events for pre-trigger history.
Tax reassessment forecast VT · Partial reset (capped growth)
- Current annual tax
- $813 · $68/mo
- Projected year-2 tax
- $834 · $70/mo
- Expected delta
- +$21/yr (+$2/mo · 2.6%)
ⓘ Screening estimate from a state-policy table — verify with the county assessor before closing.
Climate risk First Street
- Flood 1/10 Low FEMA zone A · 0% chance over 30 yrs
- Wildfire 1/10 Low
- Heat 2/10 Low 7 d/yr ≥92°F today · 16 d/yr by 30 yrs out
- Wind 2/10 Low 3% chance of damaging wind over 30 yrs
- Air quality 2/10 Low 1 unhealthy d/yr today · 1 by 30 yrs out
Nearby sold comps map
Loading sold comps map…
Walkable amenities ~0.75 mi
Loading nearby amenities…
Taxation est. · year 1
- Rental income
- $12,808
- − Mortgage interest
- −$2,521
- − Property taxes
- −$813
- − Insurance
- −$3,990
- − Repairs & maintenance
- −$1,025
- − Management
- −$1,025
- − Depreciation
- −$1,309
- Taxable income
- $2,126
- Est. tax owed @ 24.0%
- −$510
- After-tax cash flow
- $1,973/yr
For passive investors: Depreciation is non-cash, so a rental often shows a tax loss while cash-flowing — sheltering income. Rental losses are passive: they offset passive income freely, and up to $25,000/yr can offset ordinary (W-2) income if you actively participate and your MAGI is under $100k (phasing out to $0 by $150k); unused losses carry forward. On sale, claimed depreciation is recaptured at up to 25%, and gains may owe capital-gains tax (a 1031 exchange can defer both). Figures are a year-1 estimate at your 24.0% rate — not tax advice; consult a CPA.
Schools (NCES district)
No district data.
Livability — Barnet
- Score
- 53/100
- State rank
- #117
- US rank
- #24511
Category grades
Schools grade is shown separately in the Schools card above.
Census & demographics
- Population (ZIP)
- 1,025
Population outlook (Caledonia County) Hauer SSP2
- Today (2025)
- 29,828 people
- By 2030
- 28,820 · -3.4%
- By 2040
- 26,262 · -12.0%
- By 2050
- 23,780 · -20.3%
- By 2075
- 18,516 · -37.9%
- By 2100
- 13,647 · -54.2%
Race, ethnicity, and origin ACS 2023
- Neighborhood character
- Predominantly White (93%)
- Race & ethnicity
- White 93% Two or more races 5% Hispanic / Latino 3%
- Common ancestry
- Italian 7% Slovak 6% Romanian 4%
- Foreign-born
- 0%
Political lean MEDSL · Caledonia
- 2024 margin
- D (+12.4) · D 54.5% · R 42.0% · Other 3.5%
- 2008→2024 swing
- -10.8pp toward R · 2008: 23.3pp · 2024: 12.4pp
- All cycles
- 2024: D+12.4 2020: D+15.2 2016: D+7.0 2012: D+22.9 2008: D+23.3
Not yet ingested
- Civics
- —
Market trends
- HPI YoY
- ▲ 6.60%
- Current HPI
- 190.7344
- Rent YoY
- —
- Metro
- —
- State GDP YoY
- —
- F500 in state
- 0
Price history
+80.0% since first listed3 events — show timeline
- 2026-05-26 Listed $45,000 FSBO.com
- 2020-06-15 Sold (Public Records) $9,500 Public Records
- 2018-06-29 Sold (Public Records) $25,000 Public Records
Property tax history
-1.0%/yrLatest (2024): $813 · +9.3% YoY. Source: county tax records.
Cash-flow waterfall
monthlySold comps — $/sqft
last 12 mo · ≤1 miLoading sold comps…