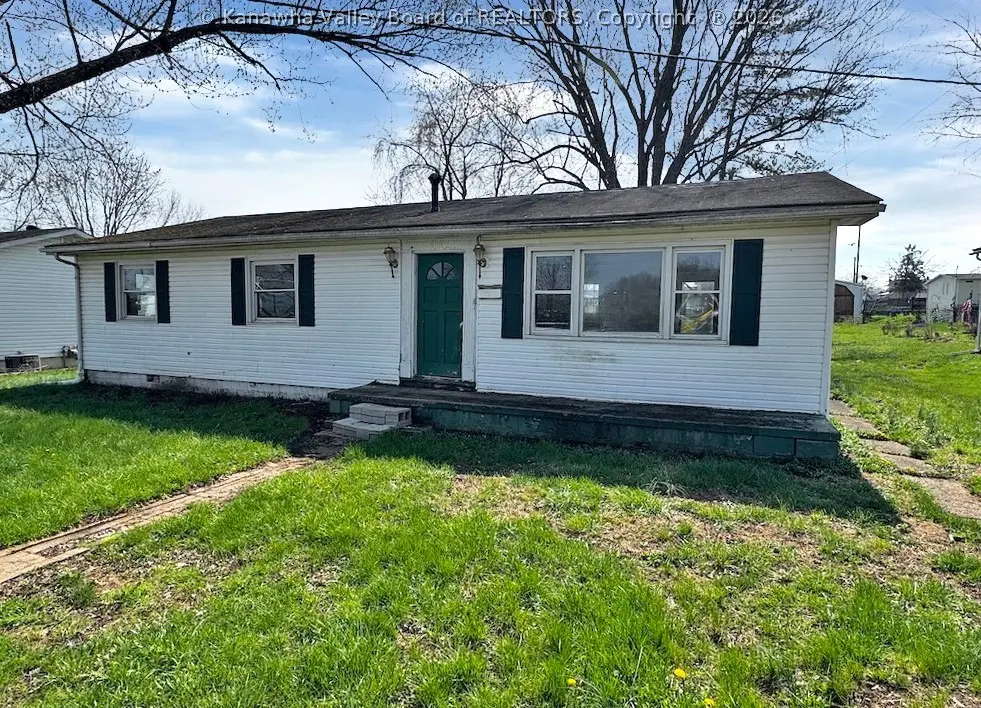
2957 Shank Ave · Hurricane, WV
Flood risk 1/10 · Minimal
- FEMA flood zone
- X (unshaded)
- Chance of flooding over 30 yrs
- 0.0%
- Est. flood insurance / yr
- $507 – $1,088
Fire risk 4/10 · Minor
- Est. fire insurance / yr
- $787 – $1,461
Heat risk 5/10 · Moderate
- Hot days now (above 101°F)
- 7 days/yr
- Hot days in 30 yrs
- 20 days/yr
Wind risk 2/10 · Minimal
- Chance of severe wind over 30 yrs
- 1.0%
Air-quality risk 1/10 · Minimal
- Unhealthy air days now
- 0 days/yr
- Unhealthy air days in 30 yrs
- 0 days/yr
Risk factors via First Street. Map © Google.
Why this score? — see what drove the B grade
The composite is a weighted blend of 9 inputs, each scored 0–100. Each bar is that input's sub-score; the figure is the points it added to the 100-point composite (weight × sub-score).
- Cash flow +30.0/30.0
- 1% rule +10.0/10.0
- DSCR +10.0/10.0
- ARV discount +7.5/15.0
- Schools +3.9/10.0
- Livability +3.6/5.0
- Rent growth +2.5/5.0
- Condition / age +2.5/5.0
- Appreciation +0.0/10.0
$59,900
🖨 Deal sheet 📄 Offer letter ✓ Due diligence
Listing remarks
JUST LISTED!! One level home on double lot * 3 bedrooms / 1.5 baths * Formal dining room * Backyard access from alley * First Look period expires 7/13/26. * This is a Fannie Mae HomePath property.
Key facts
- Formal dining room
- Double lot
- 0.25 acre lot
Tags
Property features AI
Finance
- Financial info: Annual tax amount: $1,060
Exterior
- Security: Smoke detectors installed
- Utilities: Public water; Public sewer
- Home design: Residential ranch-style property
- Construction: Aluminum siding and frame construction
- Exterior features: Composition/shingle roof; Lot approximately 0.25 acres with dimensions ~80 x 80 x 140 x 140
Interior
- Bedrooms: Total of 6 rooms (bedrooms and living spaces combined)
- Flooring: Hardwood; Vinyl
- Bathrooms: 1 full bathroom; 1 half bathroom
- Heating & cooling: Heat pump heating; Heat pump cooling
- Interior features: Hardwood and vinyl flooring; No basement
Neighborhood map
What this means for you Summary
Snapshot
- This is a 3-bed/1.5-bath single-family listed at $60k.
Deal economics
- At list price, monthly cash flow is $713 ($9k/yr) — positive.
- The deal already cash-flows at list — no discount required.
- Meets the 1% rule at list price ($1k rent vs $60k).
- Cap rate 20.6% vs local median 4.0% in Hurricane — top-decile yield for the area; either an underpriced asset or a hidden risk that comps aren't pricing in. Stress-test before assuming the spread holds.
Location & tenants
- Location reads 72/100 on livability (#47 in WV) — a middle-class / working-renter tenant base. Strengths: crime A+, cost of living A+, housing A+; Watch: amenities F, commute F, health & safety F.
- Putnam County Schools (suburban): math 40% / reading 50% proficiency, ranked #2 of 55 in WV (top 4%) — families likely to look elsewhere, expect single-tenant / working-renter base with shorter leases.
- Zoned schools: Conner Street Elementary (math 32% / reading 42%, grade F, #130 of 377 statewide, top 39%, 357 students, 0% FRL); Hurricane Middle (math 44% / reading 50%, grade D+, #6 of 109 statewide, top 6%, 849 students, 0% FRL); Hurricane High School (math 38% / reading 62%, grade D+, #6 of 110 statewide, top 5%, 1,256 students, 0% FRL) — zoned schools average 0% FRL vs 33% district-wide (33 pts lower); this property's tenant base skews higher-income than the district average.
- Market conditions: 119 active listings in the ZIP; solid renter incomes; 111 units permitted in Putnam County in 2024 (0 in 5+ unit buildings).
Forward outlook
- Local home prices are declining (-3.0%/yr); year-one equity from $414 of loan paydown is wiped out by about $2k of value loss. Plan a longer hold.
- At projected returns (-3.0% appreciation + 3.0% rent growth), your $17k cash investment doubles in ~3 years — after that, you're playing with house money.
Negotiation context
- Only 4 days on market — expect competitive offers; lowballing is unlikely to land.
Risks & watch-outs
- Climate carrying-cost: extreme-heat days projected 7→20/yr by 2055 (HVAC capex compounding) — expect insurance premiums to compound above CPI over the hold.
Questions for the listing agent
- Built in 1964 — when were the roof, HVAC, electrical panel, plumbing, and water heater last replaced?
- Is there a deadline driving the sale (1031 exchange, divorce, estate, relocation)? That informs how much negotiation room exists.
- Schools are D-rated, which usually means shorter tenancies and higher turnover. Who's the typical renter profile here, and what's been the actual vacancy rate?
- What's the average days-on-market for RENTAL listings here right now (not sales)? A rising rental-DOM trend means longer vacancies and softer asking-rent achievability than the comps imply.
- What's the recent tenant-quality profile in this submarket — average credit score on applications, eviction rate, late-payment / NSF rate, and stable-employment percentage? A property-management company in the area should have these aggregated.
- How much new for-sale + rental construction is in the pipeline within 1–3 miles? Heavy new supply typically softens prices + rents 12–24 months out; constrained supply supports both.
Investment metrics
- 1% rule
- 2.38% ✓
- Cap rate
- 20.58%
- Cash-on-cash
- 51.02%
- DSCR
- 3.27
- GRM
- 3.5
CMA / ARV
- ARV (on-the-fly)
- $204,400
- Comps found
- 12
Show comp detail 12 sales within ~0.75 mi
| Address | Dist | Beds/Ba | Sqft | Sold | Price | $/sf | Match |
|---|---|---|---|---|---|---|---|
| 2967 Shank Ave | 0.05mi | 3/1.0 | 1,506 (+8%) | 5mo | $137,500 | $91 | 79 |
| 2831 Washington Ave | 0.17mi | 3/1.0 | 1,310 (-6%) | 6mo | $209,600 | $160 | 74 |
| 2920 Virginia Ave | 0.21mi | 2/1.5 (-1) | 1,320 (-6%) | 10mo | $192,500 | $146 | 67 |
| 434 Brook Cir | 0.19mi | 3/1.0 | 1,601 (+14%) | 1mo | $219,000 | $137 | 64 |
| 102 Peak Cir | 0.15mi | 3/1.0 | 1,225 (-12%) | 9mo | $201,000 | $164 | 62 |
| 2490 Montana Ave | 0.27mi | 3/2.0 | 1,215 (-13%) | 3mo | $182,000 | $150 | 61 |
| 219 Melrose Dr | 0.71mi | 3/1.0 | 1,377 (-2%) | 2mo | $192,500 | $140 | 61 |
| 3309 Morning Rd | 0.69mi | 3/2.0 | 1,276 (-9%) | 0mo | $236,649 | $185 | 50 |
| 406 Dudding Ave | 0.56mi | 3/1.5 | 1,520 (+9%) | 12mo | $200,000 | $132 | 49 |
| 3253 Putnam Ave | 0.67mi | 3/1.5 | 1,244 (-11%) | 4mo | $160,000 | $129 | 47 |
| 523 Dudding Ave | 0.67mi | 3/1.0 | 1,512 (+8%) | 8mo | $227,900 | $151 | 47 |
| 134 Taylor St | 0.49mi | 4/2.0 (+1) | 1,583 (+13%) | 7mo | $180,000 | $114 | 42 |
Match score weights: distance 35% · size 25% · config 20% · recency 20%. Top-matched comps best support the ARV.
Projected returns pro-forma
-3.0% appreciation · 3.0% rent growth · sell at horizon
- IRR
- 48.9%
- Equity multiple
- 3.13×
- Total profit
- $35,734
- Equity at exit
- $8,931
- IRR
- 54.4%
- Equity multiple
- 6.35×
- Total profit
- $89,687
- Equity at exit
- $5,179
Cash invested: $16,772 (down + closing). Projections, not guarantees.
Landlord ↔ Tenant lean methodology
- Overall (STATE)
- 83 Strongly Landlord-Friendly
- State West Virginia
- 83 Strongly Landlord-Friendly · R+22
- County
- — inherits STATE
- City
- — inherits STATE
ZIP-level market 25526
- Home prices YoY
- -30.1%
- Active inventory
- 119
- Price-to-rent
- 3.5×
Monthly cashflow live
- Estimated rent
- $1,427 medium interval (Pro) →
- Mortgage (P&I)
- −$314
- Tax est. 1.5%
- −$75 /mo · $898/yr
- Insurance
- −$25
- HOA
- −$0
- Vacancy / Maint / Mgmt
- −$300
- Net cashflow
- $713
Break-even live
UW: 25.0% down · 7.5% · 30yr · 1.5% tax · 5.0% vac · 8.0% maint · 8.0% mgmt
Financing live
Cash to close
- Down payment
- $14,975
- Closing costs
- $1,797
- Reserves months
- —
- Total cash needed
- —
Loan-product check · same deal, 3 products live
Conventional
25% down · 7.5% · 30yr
- Down + closing
- —
- Monthly P&I
- —
- Monthly cashflow
- —
- DSCR
- —
- Eligible?
- —
Personal DTI + credit; lowest rate.
DSCR
20% down · 8.5% · 30yr
- Down + closing
- —
- Monthly P&I
- —
- Monthly cashflow
- —
- DSCR
- —
- Eligible?
- —
No personal income docs; deal must DSCR.
Hard money
10% down · 12.0% · 12mo
- Down + closing
- —
- Monthly P&I
- —
- Monthly cashflow
- —
- DSCR
- —
- Eligible?
- —
Short-term bridge; refi at stabilization.
Listing history 5 events
-
2026-06-17status $59,900 Pending 4 DOM
-
2026-06-16days on market $59,900 Active 4 DOM
-
2026-06-15days on market $59,900 Active 3 DOM
-
2026-06-13remarks 197-char remark
-
2026-06-13$59,900 Active 1 DOM
ⓘ Source: listings_history table (triggers on properties + properties_extension) + one-shot
backfill from property_details.listing_events for pre-trigger history.
Climate risk First Street
- Flood 1/10 Low FEMA zone X (unshaded) · 0% chance over 30 yrs
- Wildfire 4/10 Moderate
- Heat 5/10 Major 7 d/yr ≥101°F today · 20 d/yr by 30 yrs out
- Wind 2/10 Low 100% chance of damaging wind over 30 yrs
- Air quality 1/10 Low 0 unhealthy d/yr today · 0 by 30 yrs out
Nearby sold comps map
Loading sold comps map…
Walkable amenities ~0.75 mi
Loading nearby amenities…
Taxation est. · year 1
- Rental income
- $17,120
- − Mortgage interest
- −$3,355
- − Property taxes
- −$898
- − Insurance
- −$300
- − Repairs & maintenance
- −$1,370
- − Management
- −$1,370
- − Depreciation
- −$1,743
- Taxable income
- $8,085
- Est. tax owed @ 24.0%
- −$1,940
- After-tax cash flow
- $6,617/yr
For passive investors: Depreciation is non-cash, so a rental often shows a tax loss while cash-flowing — sheltering income. Rental losses are passive: they offset passive income freely, and up to $25,000/yr can offset ordinary (W-2) income if you actively participate and your MAGI is under $100k (phasing out to $0 by $150k); unused losses carry forward. On sale, claimed depreciation is recaptured at up to 25%, and gains may owe capital-gains tax (a 1031 exchange can defer both). Figures are a year-1 estimate at your 24.0% rate — not tax advice; consult a CPA.
Schools (NCES district)
- District
- Putnam County Schools
- NCES district ID
- 5401200
- Math proficiency
- 40% ▼ -13.00%
- Reading proficiency
- 50% ▼ -6.00%
- Median HH income
- $54,783
- Composite
- 39.06/100
- National rank
- #4060
- State rank
- #2 of 55 in WV
Livability — Hurricane
- Score
- 72/100
- State rank
- #47
- US rank
- #5846
Category grades
Schools grade is shown separately in the Schools card above.
Census & demographics
- Census place
- Hurricane, WV
- County
- Putnam County · 22,514 people
- City population
- 22,514
- Metro
- Huntington-Ashland, WV-KY-OH
- Population (ZIP)
- 22,514
- Household income
- $85,176
- Rent vs Own
- Severe rent burden
- 205.0
Population outlook (Putnam County) Hauer SSP2
- Today (2025)
- 58,915 people
- By 2030
- 59,400 · +0.8%
- By 2040
- 59,444 · +0.9%
- By 2050
- 58,510 · -0.7%
- By 2075
- 54,603 · -7.3%
- By 2100
- 46,202 · -21.6%
Race, ethnicity, and origin ACS 2023
- Neighborhood character
- Predominantly White (94%)
- Race & ethnicity
- White 94% Two or more races 3% Hispanic / Latino 2% Asian 1%
- Common ancestry
- Slovak 3% Italian 1% Serbian 1%
- Foreign-born
- 2% · Canada
- Languages at home
- 98% English-only · Spanish 1% Other Asian/Pacific 0%
Political lean MEDSL · Putnam
- 2024 margin
- Solid R (+46.3) · D 25.9% · R 72.2% · Other 1.9%
- 2008→2024 swing
- -22.8pp toward R · 2008: -23.5pp · 2024: -46.3pp
- All cycles
- 2024: R+46.3 2020: R+42.6 2016: R+47.8 2012: R+37.1 2008: R+23.5
Not yet ingested
- Civics
- —
Market trends
- HPI YoY
- ▼ -68.01%
- Current HPI
- 157.7355
- Rent YoY
- —
- Metro
- Huntington-Ashland, WV-KY-OH
- State GDP YoY
- —
- F500 in state
- 0
Price history
-13.8% since first listed2 events — show timeline
- 2026-06-12 Listed $59,900 KVBOR
- 2026-05-07 Sold (Public Records) $69,454 Public Records
Cash-flow waterfall
monthlySold comps — $/sqft
last 12 mo · ≤1 miLoading sold comps…