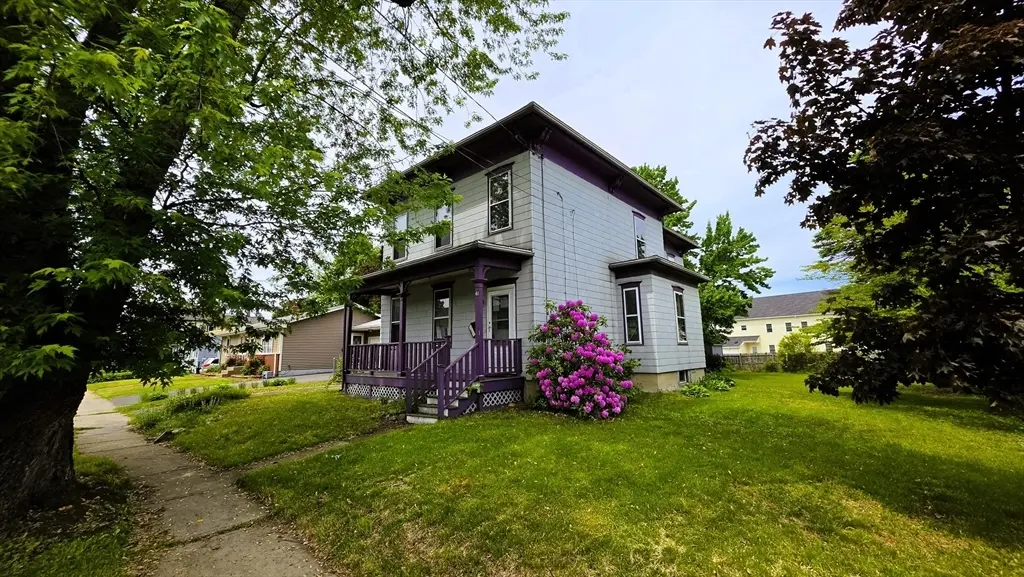
40 Marion · Chicopee, MA
Flood risk 1/10 · Minimal
- FEMA flood zone
- X (unshaded)
- Chance of flooding over 30 yrs
- 0.0%
- Est. flood insurance / yr
- $473 – $860
Fire risk 1/10 · Minimal
- Est. fire insurance / yr
- $915 – $1,699
Heat risk 4/10 · Minor
- Hot days now (above 98°F)
- 7 days/yr
- Hot days in 30 yrs
- 16 days/yr
Wind risk 5/10 · Moderate
- Chance of severe wind over 30 yrs
- 23.0%
Air-quality risk 2/10 · Minimal
- Unhealthy air days now
- 1 days/yr
- Unhealthy air days in 30 yrs
- 2 days/yr
Risk factors via First Street. Map © Google.
Why this score? — see what drove the C grade
The composite is a weighted blend of 9 inputs, each scored 0–100. Each bar is that input's sub-score; the figure is the points it added to the 100-point composite (weight × sub-score).
- Cash flow +18.0/30.0
- ARV discount +15.0/15.0
- DSCR +5.6/10.0
- Appreciation +5.0/10.0
- 1% rule +4.8/10.0
- Livability +3.8/5.0
- Rent growth +2.5/5.0
- Schools +2.3/10.0
- Condition / age +2.2/5.0
$229,900
🖨 Deal sheet (PDF) 📄 Offer letter ✓ Due diligence
Listing remarks
Charming 1920 Colonial offering 1,887 square feet of living space and loaded with character and potential. This spacious home features 3 generously sized bedrooms, 1 full bathroom, high ceilings, and beautiful hardwood floors throughout much of the main level. Sun filled rooms create a warm and inviting atmosphere, while the formal dining room provides the perfect space for entertaining. A covered front porch welcomes you home, and a private balcony off the primary bedroom offers a great spot to relax. The flexible floor plan provides the potential for a first floor primary bedroom if desired. The basement offers additional possibilities for future finished living space. Situated on a nice
Key facts
- 9,583 sq ft lot
- 4 parking spots
- Built 1920
Property features AI
Finance
- HOA & community: Not a senior community
Exterior
- Parking: Off-street paved parking; Four parking spaces; Open parking
- Utilities: Public water; Public sewer; Electric service with fuses
- Home design: Single family residence; Above-grade finished living area reported
- Construction: Frame construction; Block foundation; Shingle roof; Built year per public records
- Exterior features: Porch; Balcony; Level lot; Public road frontage
Interior
- Kitchen: Oven
- Bedrooms: Master bedroom on the second floor; Second bedroom on the second floor; Third bedroom on the second floor
- Flooring: Wood flooring; Vinyl flooring; Carpet
- Bathrooms: One full bathroom; Master bathroom present
- Heating & cooling: Baseboard heating; Natural gas heating
- Interior features: Seven total rooms; Full, unfinished basement
- Laundry & utility: Gas water heater; Tankless water heater
Neighborhood map
What this means for you Summary
Snapshot
- This is a 3-bed/1.0-bath single-family listed at $230k. Condition is rated fair.
Deal economics
- At list price, monthly cash flow is $196 ($2k/yr) — positive.
- The deal already cash-flows at list — no discount required.
- To meet the 1% rule (rent ≥ 1% of price), the offer needs to be $226k (1.7% below list).
- Recommended offer: $226k (1.7% below list) — sets the bar for 1% rule.
- Cap rate 7.3% vs local median 4.6% in Chicopee — top-decile yield for the area; either an underpriced asset or a hidden risk that comps aren't pricing in. Stress-test before assuming the spread holds.
Location & tenants
- Location reads 76/100 on livability (#66 in MA, #3,658 nationally) — a middle-class / working-renter tenant base. Strengths: commute A+, housing A+, health & safety A+; Watch: employment D+, schools D, crime F.
- Chicopee (suburban): math 20% / reading 33% proficiency, ranked #270 of 302 in MA (top 89%) — low school quality limits family demand, transient renter base, plan for 1-2y turnover.
- Market conditions: 1 active listings in the ZIP; 3 comparable units currently listed for rent nearby; rentals at typical pace (median 22d on market — plan ~3-4 weeks tenant-placement turnaround); 453 units permitted in Hampden County in 2024 (116 in 5+ unit buildings).
Forward outlook
- In year one you build about $8k of equity ($2k loan paydown + $7k appreciation (3.0% local appreciation)).
- Hampden County population projected at +5% by 2050 — modest demand growth; plan on rents tracking national, not racing it.
- At projected returns (3.0% appreciation + 3.0% rent growth), your $64k cash investment doubles in ~6 years — after that, you're playing with house money.
- By year 5, paydown + projected appreciation supports a ~$37k cash-out refi (75% LTV) — recoverable capital for the next deal without selling this one.
Negotiation context
- Only 5 days on market — expect competitive offers; lowballing is unlikely to land.
Risks & watch-outs
- Watch-outs: built in 1920 — expect roof / HVAC / electrical / plumbing capex.
- Climate carrying-cost: moderate wind risk, 23% chance of damaging wind over 30y — expect insurance premiums to compound above CPI over the hold.
Questions for the listing agent
- Have any recent inspections been done? Can we get a copy of the seller's disclosures and any deferred-maintenance estimates?
- Built in 1920 — when were the roof, HVAC, electrical panel, plumbing, and water heater last replaced?
- Is there a deadline driving the sale (1031 exchange, divorce, estate, relocation)? That informs how much negotiation room exists.
- Schools are D-rated, which usually means shorter tenancies and higher turnover. Who's the typical renter profile here, and what's been the actual vacancy rate?
- Crime grade is F in this area — have there been break-ins, vandalism, or insurance claims at this property in the last 3 years? What carrier currently insures it and at what premium?
- What's the average days-on-market for RENTAL listings here right now (not sales)? A rising rental-DOM trend means longer vacancies and softer asking-rent achievability than the comps imply.
- What's the recent tenant-quality profile in this submarket — average credit score on applications, eviction rate, late-payment / NSF rate, and stable-employment percentage? A property-management company in the area should have these aggregated.
- How much new for-sale + rental construction is in the pipeline within 1–3 miles? Heavy new supply typically softens prices + rents 12–24 months out; constrained supply supports both.
Investment metrics
- 1% rule
- 0.98% ✗
- Cap rate
- 7.32%
- Cash-on-cash
- 3.66%
- DSCR
- 1.16
- GRM
- 8.5
CMA / ARV
- ARV (on-the-fly)
- $350,982
- Comps found
- 10
Show comp detail 10 sales within ~0.75 mi
| Address | Dist | Beds/Ba | Sqft | Sold | Price | $/sf | Match |
|---|---|---|---|---|---|---|---|
| 81 Northwood St | 0.34mi | 3/1.0 | 1,790 (-5%) | 12mo | $325,000 | $182 | 66 |
| 126 Casino Ave | 0.21mi | 2/1.0 (-1) | 1,712 (-9%) | 7mo | $300,000 | $175 | 64 |
| 196 Nonotuck Ave | 0.15mi | 3/2.0 | 1,798 (-5%) | 23mo | $360,000 | $200 | 62 |
| 95 Weaver Rd | 0.51mi | 3/2.0 | 1,813 (-4%) | 7mo | $259,000 | $143 | 60 |
| 121 Donlyn Dr | 0.36mi | 4/1.0 (+1) | 1,720 (-9%) | 10mo | $350,000 | $203 | 55 |
| 41 Nevada St | 0.66mi | 3/2.5 | 1,840 (-2%) | 8mo | $310,000 | $168 | 52 |
| 91 Haven Ave | 0.52mi | 4/2.0 (+1) | 2,070 (+10%) | 1mo | $385,000 | $186 | 50 |
| 255 Moore St | 0.60mi | 4/3.0 (+1) | 1,839 (-2%) | 8mo | $405,000 | $220 | 48 |
| 13 Louise Ave | 0.59mi | 3/3.0 | 1,689 (-10%) | 10mo | $318,000 | $188 | 38 |
| 132 Hamburg St | 0.69mi | 3/2.0 | 1,752 (-7%) | 22mo | $291,000 | $166 | 34 |
Match score weights: distance 35% · size 25% · config 20% · recency 20%. Top-matched comps best support the ARV.
Projected returns pro-forma
3.0% appreciation · 3.0% rent growth · sell at horizon
- IRR
- 10.9%
- Equity multiple
- 1.63×
- Total profit
- $40,243
- Equity at exit
- $103,373
- IRR
- 13.2%
- Equity multiple
- 2.95×
- Total profit
- $125,806
- Equity at exit
- $159,310
Cash invested: $64,372 (down + closing). Projections, not guarantees.
Landlord ↔ Tenant lean methodology
- Overall (STATE)
- 20 Strongly Tenant-Friendly
- State Massachusetts
- 20 Strongly Tenant-Friendly · D+15
- County
- — inherits STATE
- City
- — inherits STATE
ZIP-level market 03013
- Active inventory
- 1
- Price-to-rent
- 8.5×
Monthly cashflow live
- Estimated rent
- $2,260 medium interval (Pro) →
- Mortgage (P&I)
- −$1,206
- Tax est. 1.5%
- −$287 /mo · $3,448/yr
- Insurance
- −$96
- HOA
- −$0
- Vacancy / Maint / Mgmt
- −$475
- Net cashflow
- $196
Break-even live
Sensitivity live
| Price | -10% $355 | -5% $276 | +0% $196 | +5% $117 | +10% $38 |
|---|---|---|---|---|---|
| Rent | -10% $18 | -5% $107 | +0% $196 | +5% $286 | +10% $375 |
| Rate | -1.0pp $312 | -0.5pp $255 | base $196 | +0.5pp $137 | +1.0pp $76 |
UW: 25.0% down · 7.5% · 30yr · 1.5% tax · 5.0% vac · 8.0% maint · 8.0% mgmt
Financing live
Cash to close
- Down payment
- $57,475
- Closing costs
- $6,897
- Reserves months
- —
- Total cash needed
- —
Loan-product check · same deal, 3 products live
Conventional
25% down · 7.5% · 30yr
- Down + closing
- —
- Monthly P&I
- —
- Monthly cashflow
- —
- DSCR
- —
- Eligible?
- —
Personal DTI + credit; lowest rate.
DSCR
20% down · 8.5% · 30yr
- Down + closing
- —
- Monthly P&I
- —
- Monthly cashflow
- —
- DSCR
- —
- Eligible?
- —
No personal income docs; deal must DSCR.
Hard money
10% down · 12.0% · 12mo
- Down + closing
- —
- Monthly P&I
- —
- Monthly cashflow
- —
- DSCR
- —
- Eligible?
- —
Short-term bridge; refi at stabilization.
Rent comps 3 comps
| Address | Beds | Baths | Sqft | Rent | $/sqft | DOM | Units | Dist |
|---|---|---|---|---|---|---|---|---|
| 63 Chapin St Unit A Chicopee, MA | 3.0 | 1.0 | 1332 | $2,499 | $1.88 | 44d | 1 | 0.33mi |
| 78 Wheatland Ave Unit 2 Chicopee, MA | 2.0 | 1.0 | 1353 | $1,850 | $1.37 | 21d | 1 | 1.05mi |
| 367 Broadway St Unit 1 Chicopee, MA | 2.0 | 1.0 | 1320 | $1,800 | $1.36 | 14d | 1 | 1.37mi |
Listing history 4 events
-
2026-06-09days on market $229,900 Active 5 DOM
-
2026-06-08statusdays on market $229,900 Active 4 DOM
-
2026-06-07remarks 699-char remark
-
2026-06-07$229,900 New 3 DOM
ⓘ Source: listings_history table (triggers on properties + properties_extension) + one-shot
backfill from property_details.listing_events for pre-trigger history.
Climate risk First Street
- Flood 1/10 Low FEMA zone X (unshaded) · 0% chance over 30 yrs
- Wildfire 1/10 Low
- Heat 4/10 Moderate 7 d/yr ≥98°F today · 16 d/yr by 30 yrs out
- Wind 5/10 Major 23% chance of damaging wind over 30 yrs
- Air quality 2/10 Low 1 unhealthy d/yr today · 2 by 30 yrs out
Nearby sold comps map
Loading sold comps map…
Walkable amenities ~0.75 mi
Loading nearby amenities…
Taxation est. · year 1
- Rental income
- $27,118
- − Mortgage interest
- −$12,878
- − Property taxes
- −$3,448
- − Insurance
- −$1,150
- − Repairs & maintenance
- −$2,169
- − Management
- −$2,169
- − Depreciation
- −$6,688
- Taxable loss
- −$1,385
- Est. tax savings @ 24.0%
- +$332
- After-tax cash flow
- $2,690/yr
For passive investors: Depreciation is non-cash, so a rental often shows a tax loss while cash-flowing — sheltering income. Rental losses are passive: they offset passive income freely, and up to $25,000/yr can offset ordinary (W-2) income if you actively participate and your MAGI is under $100k (phasing out to $0 by $150k); unused losses carry forward. On sale, claimed depreciation is recaptured at up to 25%, and gains may owe capital-gains tax (a 1031 exchange can defer both). Figures are a year-1 estimate at your 24.0% rate — not tax advice; consult a CPA.
Condition & rehab AI · 13 photos
This 1920 Colonial home requires moderate renovations to update its kitchen and bathroom, and improve its exterior. These updates will significantly increase its resale and rental value.
Repairs flagged
- Major Kitchen cabinets — Yellow cabinets are outdated and in poor condition.
- Major Bathroom — Small, outdated bathroom with basic fixtures.
- Moderate Exterior siding — Purple trim and some wear on siding.
- Minor Landscaping — Overgrown landscaping needs trimming.
Value-add opportunities
- Resale New kitchen cabinets and flooring — Modern kitchen cabinets and flooring will attract more buyers.
- Resale Updated bathroom — A modern bathroom will enhance the home's appeal.
- Both Landscaping improvements — A well-maintained exterior will improve curb appeal and value.
Renovation cost estimate screening
| Repair item | Severity | Est. cost |
|---|---|---|
| Kitchen cabinets · Yellow cabinets are outdated and in poor condition. | Major | $15,000–50,000 |
| Bathroom · Small, outdated bathroom with basic fixtures. | Major | $15,000–50,000 |
| Exterior siding · Purple trim and some wear on siding. | Moderate | $3,000–15,000 |
| Landscaping · Overgrown landscaping needs trimming. | Minor | $500–3,000 |
| Total estimated repair cost · 4 items | $33,500–118,000 |
Value-add ROI direction
- Resale New kitchen cabinets and flooring — Modern kitchen cabinets and flooring will attract more buyers. ↑
- Resale Updated bathroom — A modern bathroom will enhance the home's appeal. ↑
- Both Landscaping improvements — A well-maintained exterior will improve curb appeal and value. ↑
ⓘ Cost ranges are severity-bucket heuristics (US national rule-of-thumb). Get contractor quotes + a written scope before underwriting a rehab budget.
Schools (NCES district)
- District
- Chicopee
- NCES district ID
- 2503660
- Math proficiency
- 20% ▼ -22.00%
- Reading proficiency
- 33% ▼ -10.00%
- Median HH income
- $46,414
- Composite
- 22.91/100
- National rank
- #7997
- State rank
- #270 of 302 in MA
Livability — Chicopee
- Score
- 76/100
- State rank
- #66
- US rank
- #3658
Category grades
Schools grade is shown separately in the Schools card above.
Census & demographics
- Census place
- Chicopee, MA
Population outlook (Hampden County) Hauer SSP2
- Today (2025)
- 485,646 people
- By 2030
- 491,517 · +1.2%
- By 2040
- 500,539 · +3.1%
- By 2050
- 508,827 · +4.8%
- By 2075
- 539,167 · +11.0%
- By 2100
- 545,698 · +12.4%
Not yet ingested
- Political lean
- —
- Race & ethnicity
- —
- Common origin
- —
- Civics
- —
Market trends
- HPI YoY
- —
- Current HPI
- —
- Rent YoY
- —
- Metro
- —
- State GDP YoY
- ▲ 2.28%
- F500 in state
- 38
Industry mix (Fortune 500 HQ in MA)
| Industry | F500 HQs | Revenue |
|---|---|---|
| Technology | 3 | $17B |
|
||
| Insurance | 2 | $84B |
|
||
| Retail | 2 | $76B |
|
||
| Life Sciences | 1 | $43B |
|
||
| Energy Technology | 1 | $31B |
|
||
| Aerospace / Defense | 1 | $18B |
|
||
Price history
1 event — show timeline
- 2026-06-04 Listed $229,900 MLS PIN
Cash-flow waterfall
monthlySold comps — $/sqft
last 12 mo · ≤1 miLoading sold comps…