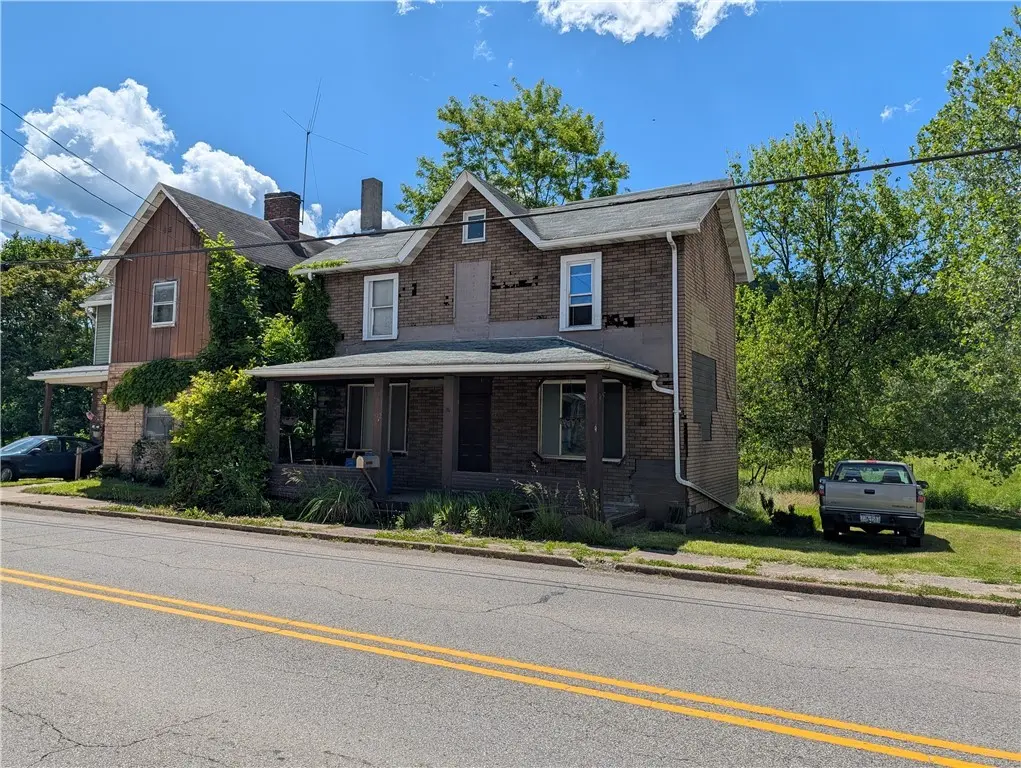
732 N Warren Ave · Apollo, PA
Flood risk 6/10 · Moderate
- FEMA flood zone
- X (unshaded)
- Chance of flooding over 30 yrs
- 0.75%
- Est. flood insurance / yr
- $507 – $1,088
Fire risk 1/10 · Minimal
- Est. fire insurance / yr
- $511 – $949
Heat risk 4/10 · Minor
- Hot days now (above 97°F)
- 7 days/yr
- Hot days in 30 yrs
- 19 days/yr
Wind risk 2/10 · Minimal
- Chance of severe wind over 30 yrs
- —
Air-quality risk 3/10 · Minor
- Unhealthy air days now
- 3 days/yr
- Unhealthy air days in 30 yrs
- 5 days/yr
Risk factors via First Street. Map © Google.
Why this score? — see what drove the D grade
The composite is a weighted blend of 9 inputs, each scored 0–100. Each bar is that input's sub-score; the figure is the points it added to the 100-point composite (weight × sub-score).
- Cash flow +15.0/30.0
- ARV discount +7.5/15.0
- 1% rule +5.0/10.0
- DSCR +5.0/10.0
- Livability +3.5/5.0
- Schools +2.9/10.0
- Rent growth +2.5/5.0
- Condition / age +2.5/5.0
- Appreciation +0.0/10.0
$19,900
🖨 Deal sheet (PDF) 📄 Offer letter ✓ Due diligence
Listing remarks
Great fixer upper in the heart of Apollo, got a few updates including wiring, has adorable living room with nice wood stove, cute kitchen with striking cabinets, spacious dining room and bedrooms, needs complete bathrooms overhauls, new furance, etc and other work as well but the potential is there,
Key facts
- New furnace
- Wood stove
- Striking cabinets
Tags
Property features AI
Exterior
- Utilities: Public water; Public sewer
- Home design: Two-story home; Resale property
- Construction: Frame construction; Asphalt roof
- Exterior features: Public transportation nearby
Interior
- Kitchen: Main-level kitchen
- Bedrooms: Three upper-level bedrooms; One additional upper-level bedroom (total 4 bedrooms)
- Flooring: Hardwood
- Bathrooms: Two full bathrooms
- Interior features: Hardwood flooring; Unfinished basement
Neighborhood map
What this means for you Summary
Snapshot
- This is a 4-bed/1.0-bath single-family listed at $20k.
Deal economics
- At list price, monthly cash flow is $983 ($12k/yr) — positive.
- The deal already cash-flows at list — no discount required.
- Meets the 1% rule at list price ($1k rent vs $20k).
- Recommended offer: $20k (1.5% below list) — sets the bar for market timing.
Location & tenants
- Location reads 70/100 on livability (#771 in PA) — a middle-class / working-renter tenant base. Strengths: crime A+, cost of living A+, housing A+; Watch: schools D+, amenities F, commute F.
- Apollo-Ridge SD (rural): math 23% / reading 45% proficiency, ranked #425 of 539 in PA (top 79%) — families likely to look elsewhere, expect single-tenant / working-renter base with shorter leases.
- Market conditions: 61 active listings in the ZIP; 1 comparable units currently listed for rent nearby; 58 units permitted in Armstrong County in 2024 (20 in 5+ unit buildings).
Forward outlook
- Local home prices are declining (-3.0%/yr); year-one equity from $138 of loan paydown is wiped out by about $597 of value loss. Plan a longer hold.
- Armstrong County population projected at -27% by 2050 — secular population decline; favor cash flow + early exit over multi-decade hold.
- At projected returns (-3.0% appreciation + 3.0% rent growth), your $6k cash investment doubles in ~1 year — after that, you're playing with house money.
Negotiation context
- It's been on market 18 days — a 2% lower offer ($20k) is reasonable based on typical stale-listing flexibility.
Risks & watch-outs
- Watch-outs: built in 1870 — expect roof / HVAC / electrical / plumbing capex.
- Climate carrying-cost: major flood risk — expect insurance premiums to compound above CPI over the hold.
Questions for the listing agent
- Built in 1870 — when were the roof, HVAC, electrical panel, plumbing, and water heater last replaced?
- Is there a deadline driving the sale (1031 exchange, divorce, estate, relocation)? That informs how much negotiation room exists.
- Schools are D-rated, which usually means shorter tenancies and higher turnover. Who's the typical renter profile here, and what's been the actual vacancy rate?
- The area grade is low — what's the realistic commute time and amenity access for the typical tenant pool here? Any planned neighborhood developments (good or bad) we should know about?
- What's the average days-on-market for RENTAL listings here right now (not sales)? A rising rental-DOM trend means longer vacancies and softer asking-rent achievability than the comps imply.
- What's the recent tenant-quality profile in this submarket — average credit score on applications, eviction rate, late-payment / NSF rate, and stable-employment percentage? A property-management company in the area should have these aggregated.
- How much new for-sale + rental construction is in the pipeline within 1–3 miles? Heavy new supply typically softens prices + rents 12–24 months out; constrained supply supports both.
Investment metrics
- 1% rule
- 7.01% ✓
- Cap rate
- 65.55%
- Cash-on-cash
- 211.62%
- DSCR
- 10.42
- GRM
- 1.2
CMA / ARV
- ARV (on-the-fly)
- $184,704
- Comps found
- 12
Show comp detail 12 sales within ~0.75 mi
| Address | Dist | Beds/Ba | Sqft | Sold | Price | $/sf | Match |
|---|---|---|---|---|---|---|---|
| 322 N 4th St | 0.24mi | 4/2.0 | 1,728 (+4%) | 2mo | $67,500 | $39 | 77 |
| 213 Whittier St | 0.47mi | 3/2.0 (-1) | 1,670 (+0%) | 5mo | $185,000 | $111 | 64 |
| 508 N 4th St | 0.23mi | 3/2.0 (-1) | 1,714 (+3%) | 13mo | $125,000 | $73 | 64 |
| 509 1st Street Ext | 0.43mi | 3/2.0 (-1) | 1,598 (-4%) | 2mo | $150,000 | $94 | 63 |
| 501 N 4th St | 0.24mi | 4/2.0 | 1,824 (+10%) | 9mo | $50,000 | $27 | 61 |
| 109 Longfellow St | 0.55mi | 3/1.0 (-1) | 1,692 (+2%) | 13mo | $7,000 | $4 | 56 |
| 822 16th St | 0.65mi | 4/1.5 | 1,600 (-4%) | 18mo | $180,000 | $113 | 46 |
| 204 Bryant St | 0.42mi | 3/2.5 (-1) | 1,848 (+11%) | 12mo | $148,000 | $80 | 41 |
| 634 Rose St | 0.71mi | 3/2.0 (-1) | 1,558 (-6%) | 8mo | $265,000 | $170 | 41 |
| 625 Rose St | 0.75mi | 3/3.5 (-1) | 1,766 (+6%) | 5mo | $340,000 | $193 | 36 |
| 1503 Birch Ave | 0.61mi | 3/2.5 (-1) | 1,420 (-15%) | 10mo | $180,000 | $127 | 28 |
| 1702 Allison Ave | 0.56mi | 3/2.0 (-1) | 1,428 (-14%) | 20mo | $185,000 | $130 | 25 |
Match score weights: distance 35% · size 25% · config 20% · recency 20%. Top-matched comps best support the ARV.
Projected returns pro-forma
-3.0% appreciation · 3.0% rent growth · sell at horizon
- IRR
- —
- Equity multiple
- 11.66×
- Total profit
- $59,370
- Equity at exit
- $2,967
- IRR
- —
- Equity multiple
- 24.75×
- Total profit
- $132,327
- Equity at exit
- $1,721
Cash invested: $5,572 (down + closing). Projections, not guarantees.
Landlord ↔ Tenant lean methodology
- Overall (STATE)
- 62 Landlord-Friendly
- State Pennsylvania
- 62 Landlord-Friendly · EVEN
- County
- — inherits STATE
- City
- — inherits STATE
ZIP-level market 15613
- Home prices YoY
- -14.8%
- Active inventory
- 61
- Price-to-rent
- 1.2×
Monthly cashflow live
- Estimated rent
- $1,395 medium interval (Pro) →
- Mortgage (P&I)
- −$104
- Tax from tax record
- −$7 /mo · $81/yr
- Insurance
- −$8
- HOA
- −$0
- Vacancy / Maint / Mgmt
- −$293
- Net cashflow
- $983
Break-even live
Sensitivity live
| Price | -10% $994 | -5% $988 | +0% $983 | +5% $977 | +10% $971 |
|---|---|---|---|---|---|
| Rent | -10% $872 | -5% $928 | +0% $983 | +5% $1,038 | +10% $1,093 |
| Rate | -1.0pp $993 | -0.5pp $988 | base $983 | +0.5pp $977 | +1.0pp $972 |
UW: 25.0% down · 7.5% · 30yr · 1.5% tax · 5.0% vac · 8.0% maint · 8.0% mgmt
Financing live
Cash to close
- Down payment
- $4,975
- Closing costs
- $597
- Reserves months
- —
- Total cash needed
- —
Loan-product check · same deal, 3 products live
Conventional
25% down · 7.5% · 30yr
- Down + closing
- —
- Monthly P&I
- —
- Monthly cashflow
- —
- DSCR
- —
- Eligible?
- —
Personal DTI + credit; lowest rate.
DSCR
20% down · 8.5% · 30yr
- Down + closing
- —
- Monthly P&I
- —
- Monthly cashflow
- —
- DSCR
- —
- Eligible?
- —
No personal income docs; deal must DSCR.
Hard money
10% down · 12.0% · 12mo
- Down + closing
- —
- Monthly P&I
- —
- Monthly cashflow
- —
- DSCR
- —
- Eligible?
- —
Short-term bridge; refi at stabilization.
Rent comps 1 comps
| Address | Beds | Baths | Sqft | Rent | $/sqft | DOM | Units | Dist |
|---|---|---|---|---|---|---|---|---|
| 1005 Hancock Ave Vandergrift, PA | 3.0 | 2.0 | 1400 | $1,395 | $1.00 | 18d | 1 | 0.44mi |
Listing history 14 events
-
2026-06-21days on market $19,900 Active 18 DOM
-
2026-06-21days on market $19,900 Active 17 DOM
-
2026-06-18days on market $19,900 Active 15 DOM
-
2026-06-17days on market $19,900 Active 14 DOM
-
2026-06-16days on market $19,900 Active 13 DOM
-
2026-06-15days on market $19,900 Active 12 DOM
-
2026-06-13days on market $19,900 Active 10 DOM
-
2026-06-12days on market $19,900 Active 9 DOM
-
2026-06-09days on market $19,900 Active 6 DOM
-
2026-06-08days on market $19,900 Active 5 DOM
-
2026-06-08days on market $19,900 Active 4 DOM
-
2026-06-07days on market $19,900 Active 3 DOM
-
2026-06-04remarks 300-char remark
-
2026-06-04$19,900 Active 1 DOM
ⓘ Source: listings_history table (triggers on properties + properties_extension) + one-shot
backfill from property_details.listing_events for pre-trigger history.
Tax reassessment forecast PA · Partial reset (capped growth)
- Current annual tax
- $81 · $7/mo
- Projected year-2 tax
- $198 · $16/mo
- Expected delta
- +$117/yr (+$10/mo · 143.8%)
ⓘ Screening estimate from a state-policy table — verify with the county assessor before closing.
Climate risk First Street
- Flood 6/10 Major FEMA zone X (unshaded) · 75% chance over 30 yrs
- Wildfire 1/10 Low
- Heat 4/10 Moderate 7 d/yr ≥97°F today · 19 d/yr by 30 yrs out
- Wind 2/10 Low
- Air quality 3/10 Moderate 3 unhealthy d/yr today · 5 by 30 yrs out
Nearby sold comps map
Loading sold comps map…
Walkable amenities ~0.75 mi
Loading nearby amenities…
Taxation est. · year 1
- Rental income
- $16,740
- − Mortgage interest
- −$1,115
- − Property taxes
- −$81
- − Insurance
- −$100
- − Repairs & maintenance
- −$1,339
- − Management
- −$1,339
- − Depreciation
- −$579
- Taxable income
- $12,187
- Est. tax owed @ 24.0%
- −$2,925
- After-tax cash flow
- $8,867/yr
For passive investors: Depreciation is non-cash, so a rental often shows a tax loss while cash-flowing — sheltering income. Rental losses are passive: they offset passive income freely, and up to $25,000/yr can offset ordinary (W-2) income if you actively participate and your MAGI is under $100k (phasing out to $0 by $150k); unused losses carry forward. On sale, claimed depreciation is recaptured at up to 25%, and gains may owe capital-gains tax (a 1031 exchange can defer both). Figures are a year-1 estimate at your 24.0% rate — not tax advice; consult a CPA.
Schools (NCES district)
- District
- Apollo-Ridge SD
- NCES district ID
- 4202550
- Math proficiency
- 23% ▼ -14.00%
- Reading proficiency
- 45% ▼ -19.00%
- Median HH income
- $43,741
- Composite
- 28.83/100
- National rank
- #6654
- State rank
- #425 of 539 in PA
Livability — Apollo
- Score
- 70/100
- State rank
- #771
- US rank
- #7781
Category grades
Schools grade is shown separately in the Schools card above.
Census & demographics
- Census place
- Apollo, PA
- Population (ZIP)
- 12,732
Population outlook (Armstrong County) Hauer SSP2
- Today (2025)
- 62,513 people
- By 2030
- 59,579 · -4.7%
- By 2040
- 52,890 · -15.4%
- By 2050
- 45,904 · -26.6%
- By 2075
- 32,023 · -48.8%
- By 2100
- 20,415 · -67.3%
Race, ethnicity, and origin ACS 2023
- Neighborhood character
- Predominantly White (93%)
- Race & ethnicity
- White 93% Two or more races 3% Hispanic / Latino 3%
- Common ancestry
- Romanian 7% Lithuanian 2% Iranian 2%
- Foreign-born
- 1% · China, Canada, Jamaica
- Languages at home
- 97% English-only · Spanish 1% Chinese 1%
Political lean MEDSL · Armstrong
- 2024 margin
- Solid R (+53.2) · D 23.0% · R 76.2%
- 2008→2024 swing
- -28.6pp toward R · 2008: -24.6pp · 2024: -53.2pp
- All cycles
- 2024: R+53.2 2020: R+52.3 2016: R+52.0 2012: R+37.2 2008: R+24.6
Not yet ingested
- Civics
- —
Market trends
- HPI YoY
- ▼ -45.35%
- Current HPI
- 261.4891
- Rent YoY
- —
- Metro
- —
- State GDP YoY
- ▲ 1.68%
- F500 in state
- 34
Industry mix (Fortune 500 HQ in PA)
| Industry | F500 HQs | Revenue |
|---|---|---|
| Healthcare | 2 | $309B |
|
||
| Insurance | 2 | $27B |
|
||
| Telecommunications / Media | 1 | $124B |
|
||
| Industrial Distribution | 1 | $22B |
|
||
| Financial Services | 1 | $20B |
|
||
| Chemicals / Materials | 1 | $18B |
|
||
Price history
1 event — show timeline
- 2026-06-03 Listed $19,900 West Penn MLS
Property tax history
+1.6%/yrLatest (2026): $81 · +3.6% YoY. Source: county tax records.
Cash-flow waterfall
monthlySold comps — $/sqft
last 12 mo · ≤1 miLoading sold comps…