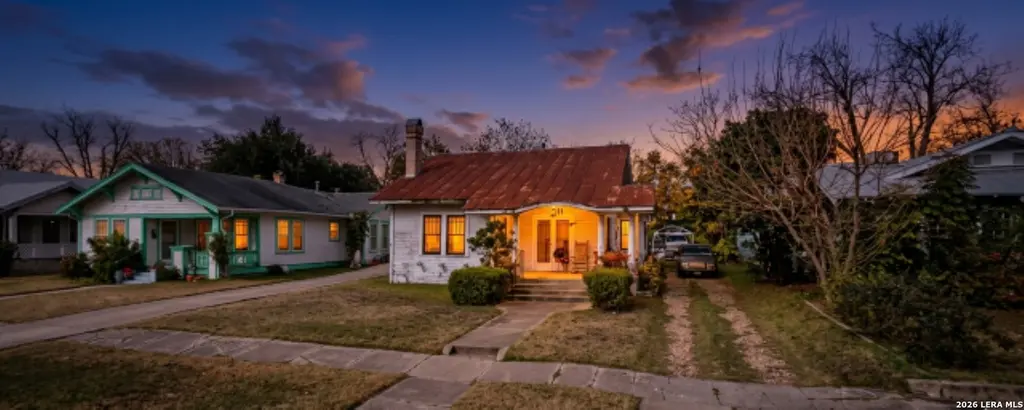
717 Kayton · San Antonio, TX
Flood risk 1/10 · Minimal
- FEMA flood zone
- X (unshaded)
- Chance of flooding over 30 yrs
- 0.0%
- Est. flood insurance / yr
- $507 – $1,088
Fire risk 1/10 · Minimal
- Est. fire insurance / yr
- $1,222 – $2,270
Heat risk 8/10 · Major
- Hot days now (above 108°F)
- 7 days/yr
- Hot days in 30 yrs
- 22 days/yr
Wind risk 8/10 · Major
- Chance of severe wind over 30 yrs
- 80.0%
Air-quality risk 2/10 · Minimal
- Unhealthy air days now
- 1 days/yr
- Unhealthy air days in 30 yrs
- 2 days/yr
Risk factors via First Street. Map © Google.
Why this score? — see what drove the B- grade
The composite is a weighted blend of 9 inputs, each scored 0–100. Each bar is that input's sub-score; the figure is the points it added to the 100-point composite (weight × sub-score).
- Cash flow +30.0/30.0
- 1% rule +10.0/10.0
- DSCR +10.0/10.0
- ARV discount +7.5/15.0
- Livability +4.0/5.0
- Rent growth +2.8/5.0
- Condition / age +2.5/5.0
- Schools +1.4/10.0
- Appreciation +0.0/10.0
$80,000
🖨 Deal sheet 📄 Offer letter ✓ Due diligence
Listing remarks MLS
Charming 2/1 historic bungalow built in 1929, this home features hardwood floors throughout, gas cooking, a metal roof, a functional layout, a cozy living area with fireplace, and a spacious lot with ample outdoor potential. Conveniently located near IH10 this property is looking for a refresh.
Key facts
- Metal roof
- Gas cooking
- Spacious lot
Tags
Neighborhood map
What this means for you Summary
Snapshot
- This is a 3-bed/1.0-bath single-family listed at $80k.
Deal economics
- At list price, monthly cash flow is $353 ($4k/yr) — positive.
- The deal already cash-flows at list — no discount required.
- Meets the 1% rule at list price ($1k rent vs $80k).
- Cap rate 11.6% vs local median 3.8% in San Antonio — top-decile yield for the area; either an underpriced asset or a hidden risk that comps aren't pricing in. Stress-test before assuming the spread holds.
Location & tenants
- Location reads 80/100 on livability (#31 in TX, #1,616 nationally) — a professional / high-income tenant draw. Strengths: amenities A+, commute A+, cost of living A+; Watch: schools C-, crime F.
- San Antonio ISD (urban): math 12% / reading 22% proficiency, ranked #805 of 826 in TX (top 98%) — low school quality limits family demand, transient renter base, plan for 1-2y turnover; 80% free/reduced lunch — lower-income household profile, screen leases tightly.
- Market conditions: Rents rising (+1.1%/yr); 269 active listings in the ZIP; 40 comparable units currently listed for rent nearby; rentals at typical pace (median 24d on market — plan ~3-4 weeks tenant-placement turnaround); 8,308 units permitted in Bexar County in 2024 (2,506 in 5+ unit buildings).
- This rent runs 31% of the median local income ($55k/yr) — at the standard rent-burdened threshold; future hikes will face affordability resistance.
Forward outlook
- Local home prices are declining (-3.0%/yr); year-one equity from $553 of loan paydown is wiped out by about $2k of value loss. Plan a longer hold.
- Bexar County population projected at +50% by 2050 — long-run rental-demand tailwind backs the buy-and-hold thesis.
- At projected returns (-3.0% appreciation + 1.1% rent growth), your $22k cash investment doubles in ~8 years — after that, you're playing with house money.
Negotiation context
- Only 14 days on market — expect competitive offers; lowballing is unlikely to land.
Risks & watch-outs
- Watch-outs: property tax is 4.6% of price; built in 1929 — expect roof / HVAC / electrical / plumbing capex.
- Climate carrying-cost: severe wind risk, 80% chance of damaging wind over 30y; extreme-heat days projected 7→22/yr by 2055 (HVAC capex compounding) — expect insurance premiums to compound above CPI over the hold.
Questions for the listing agent
- Built in 1929 — when were the roof, HVAC, electrical panel, plumbing, and water heater last replaced?
- Property tax is high relative to price — has the assessment been appealed recently, and will the sale trigger a re-assessment?
- Is there a deadline driving the sale (1031 exchange, divorce, estate, relocation)? That informs how much negotiation room exists.
- Crime grade is F in this area — have there been break-ins, vandalism, or insurance claims at this property in the last 3 years? What carrier currently insures it and at what premium?
- What's the average days-on-market for RENTAL listings here right now (not sales)? A rising rental-DOM trend means longer vacancies and softer asking-rent achievability than the comps imply.
- What's the recent tenant-quality profile in this submarket — average credit score on applications, eviction rate, late-payment / NSF rate, and stable-employment percentage? A property-management company in the area should have these aggregated.
- How much new for-sale + rental construction is in the pipeline within 1–3 miles? Heavy new supply typically softens prices + rents 12–24 months out; constrained supply supports both.
Investment metrics
- 1% rule
- 1.76% ✓
- Cap rate
- 11.58%
- Cash-on-cash
- 18.89%
- DSCR
- 1.84
- GRM
- 4.7
CMA / ARV
- ARV (median comp)
- $213,577
- List price
- $80,000
- Delta
- -62.54%
- Verdict
- UNDERPRICED
- Comps
- 20 within 1.0 mi
Show comp detail 12 sales within ~0.75 mi
| Address | Dist | Beds/Ba | Sqft | Sold | Price | $/sf | Match |
|---|---|---|---|---|---|---|---|
| 717 Kayton | 0.00mi | 2/1.0 (-1) | 1,034 (0%) | 0mo | $80,000 | $77 | 95 |
| 1530 Schley | 0.29mi | 2/2.0 (-1) | 1,032 (-0%) | 2mo | $244,900 | $237 | 75 |
| 543 Kayton | 0.20mi | 2/1.0 (-1) | 1,144 (+11%) | 2mo | $175,500 | $153 | 67 |
| 715 Avant | 0.15mi | 2/2.0 (-1) | 1,136 (+10%) | 2mo | $210,000 | $185 | 66 |
| 743 Avant | 0.16mi | 3/2.0 | 1,152 (+11%) | 5mo | $235,000 | $204 | 66 |
| 1306 Mckinley | 0.45mi | 2/1.0 (-1) | 972 (-6%) | 1mo | $110,000 | $113 | 63 |
| 621 Porter St | 0.60mi | 3/2.0 | 1,002 (-3%) | 0mo | $99,900 | $100 | 62 |
| 837 Westfall | 0.38mi | 2/1.0 (-1) | 958 (-7%) | 3mo | $139,000 | $145 | 62 |
| 1919 Steves | 0.45mi | 2/1.0 (-1) | 879 (-15%) | 5mo | $129,900 | $148 | 45 |
| 1606 Walters | 0.65mi | 3/2.0 | 1,136 (+10%) | 6mo | $170,000 | $150 | 44 |
| 1219 E Drexel Ave | 0.69mi | 2/1.0 (-1) | 918 (-11%) | 1mo | $145,000 | $158 | 43 |
| 2402 Saint Anthony | 0.68mi | 3/2.0 | 1,174 (+14%) | 7mo | $245,000 | $209 | 36 |
Match score weights: distance 35% · size 25% · config 20% · recency 20%. Top-matched comps best support the ARV.
Projected returns pro-forma
-3.0% appreciation · 1.07% rent growth · sell at horizon
- IRR
- 8.1%
- Equity multiple
- 1.31×
- Total profit
- $6,958
- Equity at exit
- $11,928
- IRR
- 15.4%
- Equity multiple
- 2.12×
- Total profit
- $24,992
- Equity at exit
- $6,917
Cash invested: $22,400 (down + closing). Projections, not guarantees.
Landlord ↔ Tenant lean methodology
- Overall (STATE)
- 87 Strongly Landlord-Friendly
- State Texas
- 87 Strongly Landlord-Friendly · R+5
- County
- — inherits STATE
- City
- — inherits STATE
ZIP-level market 78210
- Rents YoY
- 1.1%
- Active inventory
- 269
- Price-to-rent
- 4.7×
Monthly cashflow live
- Estimated rent
- $1,407 high interval (Pro) →
- Mortgage (P&I)
- −$420
- Tax from tax record
- −$306 /mo · $3,674/yr
- Insurance
- −$33
- HOA
- −$0
- Vacancy / Maint / Mgmt
- −$295
- Net cashflow
- $353
Break-even live
UW: 25.0% down · 7.5% · 30yr · 1.5% tax · 5.0% vac · 8.0% maint · 8.0% mgmt
Financing live
Cash to close
- Down payment
- $20,000
- Closing costs
- $2,400
- Reserves months
- —
- Total cash needed
- —
Loan-product check · same deal, 3 products live
Conventional
25% down · 7.5% · 30yr
- Down + closing
- —
- Monthly P&I
- —
- Monthly cashflow
- —
- DSCR
- —
- Eligible?
- —
Personal DTI + credit; lowest rate.
DSCR
20% down · 8.5% · 30yr
- Down + closing
- —
- Monthly P&I
- —
- Monthly cashflow
- —
- DSCR
- —
- Eligible?
- —
No personal income docs; deal must DSCR.
Hard money
10% down · 12.0% · 12mo
- Down + closing
- —
- Monthly P&I
- —
- Monthly cashflow
- —
- DSCR
- —
- Eligible?
- —
Short-term bridge; refi at stabilization.
Rent comps 40 comps
| Address | Beds | Baths | Sqft | Rent | $/sqft | DOM | Units | Dist |
|---|---|---|---|---|---|---|---|---|
| 636 Rigsby Ave San Antonio, TX | 3.0 | 1.0 | 1327 | $1,595 | $1.20 | 43d | 1 | 0.10mi |
| 2219 S New Braunfels Ave San Antonio, TX | 2.0 | 1.0 | 952 | $1,050 | $1.10 | 23d | 1 | 0.12mi |
| 647 Hammond Ave San Antonio, TX | 2.0 | 1.0 | 780 | $1,110 | $1.42 | 20d | 1 | 0.15mi |
| 647 Hammond Ave Unit 201 San Antonio, TX | 2.0 | 1.0 | 780 | $1,110 | $1.42 | 23d | 1 | 0.15mi |
| 838 Hammond Ave San Antonio, TX | 2.0 | 1.0 | 888 | $1,300 | $1.46 | 43d | 1 | 0.18mi |
| 2407 S New Braunfels Ave Unit 3 San Antonio, TX | 2.0 | 1.0 | 800 | $825 | $1.03 | 43d | 1 | 0.23mi |
| 2407 S New Braunfels Ave Unit 3 San Antonio, TX | 2.0 | 1.0 | 800 | $825 | $1.03 | 23d | 1 | 0.23mi |
| 534 Rigsby Ave San Antonio, TX | 3.0 | 2.0 | 1438 | $1,950 | $1.36 | 23d | 1 | 0.24mi |
| 508 Kayton Ave San Antonio, TX | 2.0 | 1.0 | 1058 | $1,200 | $1.13 | 16d | 1 | 0.28mi |
| 1627 Schley Ave San Antonio, TX | 3.0 | 1.0 | 1408 | $1,650 | $1.17 | 23d | 1 | 0.32mi |
| 523 Bailey Ave San Antonio, TX | 2.0 | 2.0 | 960 | $1,500 | $1.56 | 23d | 1 | 0.36mi |
| 1005 Essex St Unit 202 San Antonio, TX | 2.0 | 2.0 | 800 | $1,450 | $1.81 | 43d | 1 | 0.43mi |
| 1005 Essex St Unit 101 San Antonio, TX | 2.0 | 2.0 | 800 | $1,425 | $1.78 | 2d | 1 | 0.43mi |
| 1811 McKinley Ave San Antonio, TX | 2.0 | 2.0 | 1248 | $975 | $0.78 | 2d | 1 | 0.50mi |
| 413 Nopal St Unit 102 San Antonio, TX | 2.0 | 1.0 | 743 | $1,450 | $1.95 | 2d | 1 | 0.51mi |
| 331 Avant Ave San Antonio, TX | 3.0 | 2.0 | 1200 | $1,825 | $1.52 | 23d | 1 | 0.53mi |
| 1301 S Palmetto San Antonio, TX | 2.0 | 1.0 | 836 | $1,150 | $1.38 | 4d | 1 | 0.57mi |
| 1914 S Pine St San Antonio, TX | 2.0 | 1.0 | 1025 | $1,250 | $1.22 | 43d | 1 | 0.57mi |
| 627 Essex St San Antonio, TX | 3.0 | 2.5 | 1402 | $1,850 | $1.32 | 23d | 1 | 0.58mi |
| 1303 Essex St #102 San Antonio, TX | 3.0 | 2.5 | 1180 | $1,400 | $1.19 | 23d | 1 | 0.63mi |
| 1124 Vanderbilt St San Antonio, TX | 3.0 | 1.0 | 1095 | $1,350 | $1.23 | 43d | 1 | 0.63mi |
| 510 Vanderbilt St San Antonio, TX | 2.0 | 1.0 | 1208 | $1,150 | $0.95 | 43d | 1 | 0.63mi |
| 1518 S Walters St Unit 102 San Antonio, TX | 3.0 | 2.5 | 1180 | $1,400 | $1.19 | 4d | 1 | 0.63mi |
| 1131 McKinley Ave San Antonio, TX | 2.0 | 1.0 | 1000 | $1,550 | $1.55 | 4d | 1 | 0.64mi |
| 214 Nopal St Unit 201 San Antonio, TX | 4.0 | 2.0 | 1170 | $1,500 | $1.28 | 43d | 1 | 0.66mi |
| 241 Delmar St San Antonio, TX | 2.0 | 1.0 | 758 | $1,120 | $1.48 | 23d | 1 | 0.67mi |
| 302 Cooper St Unit 201 San Antonio, TX | 4.0 | 2.0 | 1170 | $1,500 | $1.28 | 43d | 1 | 0.68mi |
| 302 Cooper St Unit 201 San Antonio, TX | 4.0 | 2.0 | 1170 | $1,500 | $1.28 | 4d | 1 | 0.68mi |
| 313 San Salvador Ave San Antonio, TX | 4.0 | 2.5 | 1240 | $1,395 | $1.12 | 43d | 1 | 0.68mi |
| 730 Aransas Ave Unit 3 San Antonio, TX | 2.0 | 1.0 | 800 | $975 | $1.22 | 43d | 1 | 0.70mi |
| 1528 Steves Ave Unit 1 San Antonio, TX | 2.0 | 1.0 | 940 | $1,025 | $1.09 | 43d | 1 | 0.71mi |
| 1510 Steves Ave San Antonio, TX | 3.0 | 2.0 | 1330 | $1,800 | $1.35 | 23d | 1 | 0.74mi |
| 142 Avant Ave #1 San Antonio, TX | 3.0 | 1.0 | 1314 | $1,495 | $1.14 | 17d | 1 | 0.74mi |
| 1303 Rigsby Ave Unit 710 San Antonio, TX | 2.0 | 2.0 | 950 | $1,173 | $1.23 | 3d | 1 | 0.76mi |
| 139 San Salvador Ave Unit 103 San Antonio, TX | 2.0 | 2.5 | 1245 | $1,490 | $1.20 | 14d | 1 | 0.76mi |
| 512 Cooper St San Antonio, TX | 2.0 | 1.0 | 1116 | $1,295 | $1.16 | 23d | 1 | 0.77mi |
| 147 Vine St San Antonio, TX | 3.0 | 3.0 | 1438 | $1,700 | $1.18 | 23d | 1 | 0.79mi |
| 414 Stanfield Ave San Antonio, TX | 3.0 | 1.0 | 1250 | $1,300 | $1.04 | 43d | 1 | 0.79mi |
| 242 Vine St San Antonio, TX | 4.0 | 2.0 | 1250 | $1,695 | $1.36 | 43d | 1 | 0.80mi |
| 322 Vine St #102 San Antonio, TX | 3.0 | 2.5 | 1401 | $1,400 | $1.00 | 23d | 1 | 0.83mi |
Listing history 2 events
-
2026-05-05status Pending 295-char remark
Show marketing remark (295 chars)
Charming 2/1 historic bungalow built in 1929, this home features hardwood floors throughout, gas cooking, a metal roof, a functional layout, a cozy living area with fireplace, and a spacious lot with ample outdoor potential. Conveniently located near IH10 this property is looking for a refresh.
-
2026-03-26$80,000 New 295-char remark
Show marketing remark (295 chars)
Charming 2/1 historic bungalow built in 1929, this home features hardwood floors throughout, gas cooking, a metal roof, a functional layout, a cozy living area with fireplace, and a spacious lot with ample outdoor potential. Conveniently located near IH10 this property is looking for a refresh.
ⓘ Source: listings_history table (triggers on properties + properties_extension) + one-shot
backfill from property_details.listing_events for pre-trigger history.
Tax reassessment forecast TX · Resets to sale price
- Current annual tax
- $3,674 · $306/mo
- Projected year-2 tax
- $3,674 · $306/mo
- Expected delta
- $0/yr ($0/mo · 0.0%)
ⓘ Screening estimate from a state-policy table — verify with the county assessor before closing.
Climate risk First Street
- Flood 1/10 Low FEMA zone X (unshaded) · 0% chance over 30 yrs
- Wildfire 1/10 Low
- Heat 8/10 Severe 7 d/yr ≥108°F today · 22 d/yr by 30 yrs out
- Wind 8/10 Severe 80% chance of damaging wind over 30 yrs
- Air quality 2/10 Low 1 unhealthy d/yr today · 2 by 30 yrs out
Nearby sold comps map
Loading sold comps map…
Walkable amenities ~0.75 mi
Loading nearby amenities…
Taxation est. · year 1
- Rental income
- $16,885
- − Mortgage interest
- −$4,481
- − Property taxes
- −$3,674
- − Insurance
- −$400
- − Repairs & maintenance
- −$1,351
- − Management
- −$1,351
- − Depreciation
- −$2,327
- Taxable income
- $3,301
- Est. tax owed @ 24.0%
- −$792
- After-tax cash flow
- $3,439/yr
For passive investors: Depreciation is non-cash, so a rental often shows a tax loss while cash-flowing — sheltering income. Rental losses are passive: they offset passive income freely, and up to $25,000/yr can offset ordinary (W-2) income if you actively participate and your MAGI is under $100k (phasing out to $0 by $150k); unused losses carry forward. On sale, claimed depreciation is recaptured at up to 25%, and gains may owe capital-gains tax (a 1031 exchange can defer both). Figures are a year-1 estimate at your 24.0% rate — not tax advice; consult a CPA.
Schools (NCES district)
- District
- San Antonio ISD
- NCES district ID
- 4838730
- Math proficiency
- 12% ▼ -21.00%
- Reading proficiency
- 22% ▼ -7.00%
- Median HH income
- $30,952
- Composite
- 13.57/100
- National rank
- #9512
- State rank
- #805 of 826 in TX
Livability — San Antonio
- Score
- 80/100
- State rank
- #31
- US rank
- #1616
Category grades
Schools grade is shown separately in the Schools card above.
Census & demographics
- Census place
- San Antonio, TX
- County
- Bexar County · 1,990,555 people
- City population
- 1,806,925
- Metro
- San Antonio-New Braunfels, TX
- Population (ZIP)
- 34,940
- Household income
- $55,028
- Rent vs Own
- Severe rent burden
- 1708.0
Population outlook (Bexar County) Hauer SSP2
- Today (2025)
- 2,336,851 people
- By 2030
- 2,560,728 · +9.6%
- By 2040
- 3,020,569 · +29.3%
- By 2050
- 3,493,522 · +49.5%
- By 2075
- 4,668,459 · +99.8%
- By 2100
- 5,533,242 · +136.8%
Race, ethnicity, and origin ACS 2023
- Neighborhood character
- Predominantly Hispanic (83%)
- Race & ethnicity
- Hispanic / Latino 83% Two or more races 29% White 11% Black 4% Native American 2%
- Hispanic origin (detail)
- Mexican 72% Puerto Rican 2%
- Common ancestry
- Lithuanian 1%
- Foreign-born
- 12% · Canada
- Languages at home
- 55% English-only · Spanish 44%
Political lean MEDSL · Bexar
- 2024 margin
- Lean D (+9.8) · D 54.3% · R 44.6% · Other 1.1%
- 2008→2024 swing
- +4.2pp toward D · 2008: 5.6pp · 2024: 9.8pp
- All cycles
- 2024: D+9.8 2020: D+18.2 2016: D+13.5 2012: D+4.6 2008: D+5.6
Not yet ingested
- Civics
- —
Market trends
- HPI YoY
- ▼ -163.42%
- Current HPI
- 286.299
- Rent YoY
- ▲ 1.07%
- Metro
- San Antonio-New Braunfels, TX
- State GDP YoY
- ▲ 3.95%
- F500 in state
- 110
Industry mix (Fortune 500 HQ in TX)
| Industry | F500 HQs | Revenue |
|---|---|---|
| Energy | 16 | $1,198B |
|
||
| Technology | 5 | $198B |
|
||
| Engineering / Construction | 4 | $72B |
|
||
| Energy Services | 3 | $60B |
|
||
| Utilities | 3 | $41B |
|
||
| Healthcare | 2 | $330B |
|
||
Price history
2 events — show timeline
- 2026-05-05 Pending — LERA
- 2026-03-26 Listed $80,000 LERA
Property tax history
+6.4%/yrLatest (2025): $3,674 · +10.0% YoY. Source: county tax records.
Cash-flow waterfall
monthlySold comps — $/sqft
last 12 mo · ≤1 miLoading sold comps…