285 Tara Dr · Pleasant Hills, PA
Flood risk 9/10 · Severe
- FEMA flood zone
- X (unshaded)
- Chance of flooding over 30 yrs
- 0.99%
- Est. flood insurance / yr
- $473 – $860
Fire risk 1/10 · Minimal
- Est. fire insurance / yr
- $511 – $949
Heat risk 3/10 · Minor
- Hot days now (above 96°F)
- 7 days/yr
- Hot days in 30 yrs
- 17 days/yr
Wind risk 2/10 · Minimal
- Chance of severe wind over 30 yrs
- —
Air-quality risk 3/10 · Minor
- Unhealthy air days now
- 2 days/yr
- Unhealthy air days in 30 yrs
- 4 days/yr
Risk factors via First Street. Map © Google.
Why this score? — see what drove the C grade
The composite is a weighted blend of 9 inputs, each scored 0–100. Each bar is that input's sub-score; the figure is the points it added to the 100-point composite (weight × sub-score).
- Cash flow +15.8/30.0
- ARV discount +15.0/15.0
- 1% rule +5.5/10.0
- Schools +5.3/10.0
- DSCR +4.9/10.0
- Livability +4.2/5.0
- Rent growth +3.9/5.0
- Condition / age +2.5/5.0
- Appreciation +0.0/10.0
$199,900
🖨 Deal sheet 📄 Offer letter ✓ Due diligence
Listing remarks
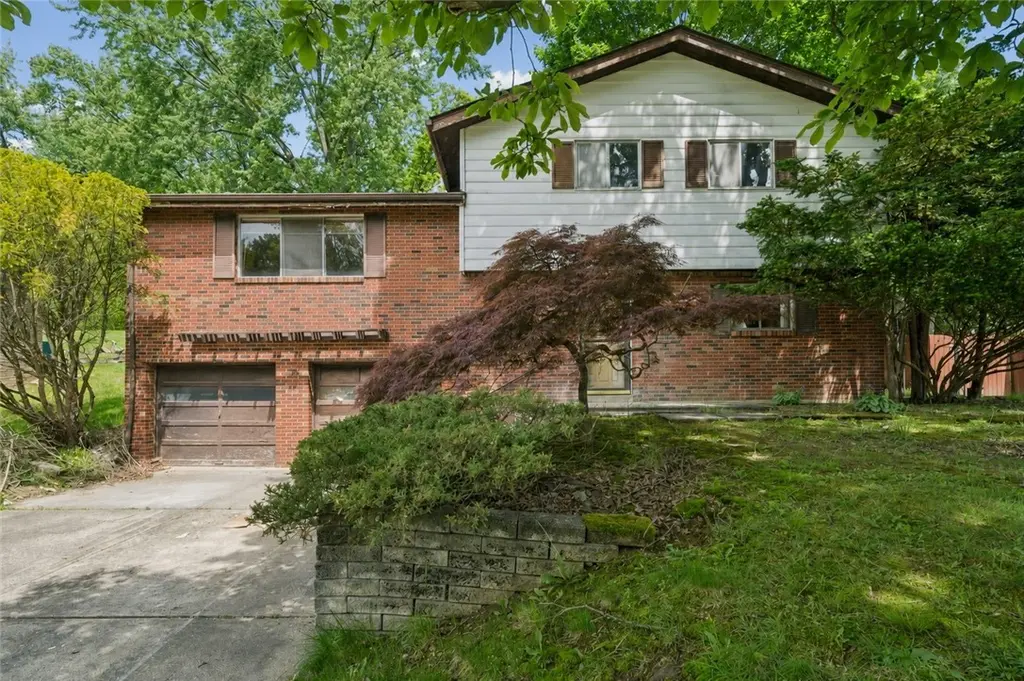
There’s something about this home that immediately feels familiar, the kind of place where memories were made for generations. Located in the heart of Pleasant Hills, 285 Tara Drive is full of character, charm, and opportunity for someone ready to bring it back to life. This is not a move-in ready home, but what it does offer is increasingly hard to find: solid bones, timeless craftsmanship, and the feeling of “home” the moment you pull into the driveway. The beautiful brick exterior has stood the test of time and remains in excellent condition, while inside you’ll find spacious bedrooms with original hardwood floors just waiting to shine again. Out front, the mature
Key facts
- Brick exterior
- Mature tree
- Private backyard
Tags
Property features AI
Exterior
- Parking: Built-in attached garage with space for 2 vehicles
- Utilities: Public water; Public sewer
- Home design: 2-story residence; Resale property
- Construction: Brick construction; Asphalt roof
- Exterior features: Small lot (approx. 0.098 acre)
Interior
- Kitchen: Kitchen on main level (approx. 12x10)
- Bedrooms: Upper-level bedrooms including three labeled bedrooms (sizes approx. 11x11, 12x12, 15x12) and an additional upper room (15x12)
- Flooring: Hardwood; Vinyl
- Bathrooms: Two full bathrooms and one half bathroom
- Heating & cooling: Forced air heating (gas); Central air conditioning
- Interior features: Hardwood and vinyl flooring; Fireplace (1)
- Laundry & utility: Main-level laundry (approx. 4x7)
Neighborhood map
What this means for you Summary
Snapshot
- This is a 3-bed/1.5-bath single-family listed at $200k.
Deal economics
- At list price, monthly cash flow is $37 ($445/yr) — positive.
- The deal already cash-flows at list — no discount required.
- Meets the 1% rule at list price ($2k rent vs $200k).
- Cap rate 6.8% vs local median 3.4% in Pleasant Hills — top-decile yield for the area; either an underpriced asset or a hidden risk that comps aren't pricing in. Stress-test before assuming the spread holds.
Location & tenants
- Location reads 84/100 on livability (#99 in PA, #718 nationally) — a professional / high-income tenant draw. Strengths: crime A+, employment A+, cost of living A+; Watch: amenities D+.
- West Jefferson Hills SD (suburban): math 48% / reading 73% proficiency, ranked #60 of 539 in PA (top 11%) — acceptable for families but not a draw, mixed tenant base, ~2y average lease; only 13% free/reduced lunch — higher-income household profile.
- Market conditions: Rents rising fast (+5.7%/yr); 115 active listings in the ZIP; 5 comparable units currently listed for rent nearby; rentals leasing fast (median 2d on market — plan ~1-2 weeks tenant-placement turnaround); solid renter incomes; 2,996 units permitted in Allegheny County in 2024 (1,588 in 5+ unit buildings).
Forward outlook
- Local home prices are declining (-3.0%/yr); year-one equity from $1k of loan paydown is wiped out by about $6k of value loss. Plan a longer hold.
Negotiation context
- Only 9 days on market — expect competitive offers; lowballing is unlikely to land.
Risks & watch-outs
- Watch-outs: property tax is 2.6% of price; flood insurance adds $56/mo; built in 1958 — expect roof / HVAC / electrical / plumbing capex.
- Climate carrying-cost: severe flood risk — expect insurance premiums to compound above CPI over the hold.
Questions for the listing agent
- Built in 1958 — when were the roof, HVAC, electrical panel, plumbing, and water heater last replaced?
- Property tax is high relative to price — has the assessment been appealed recently, and will the sale trigger a re-assessment?
- What's the actual annual flood-insurance premium (NFIP or private), and is the property in a SFHA with mandatory coverage?
- Is there a deadline driving the sale (1031 exchange, divorce, estate, relocation)? That informs how much negotiation room exists.
- Schools are B-rated — typically a magnet for longer-tenancy family renters. What's the average tenant stay here, and is there a school-zone premium baked into asking?
- What's the average days-on-market for RENTAL listings here right now (not sales)? A rising rental-DOM trend means longer vacancies and softer asking-rent achievability than the comps imply.
- What's the recent tenant-quality profile in this submarket — average credit score on applications, eviction rate, late-payment / NSF rate, and stable-employment percentage? A property-management company in the area should have these aggregated.
- How much new for-sale + rental construction is in the pipeline within 1–3 miles? Heavy new supply typically softens prices + rents 12–24 months out; constrained supply supports both.
Investment metrics
- 1% rule
- 1.05% ✓
- Cap rate
- 6.85%
- Cash-on-cash
- 1.99%
- DSCR
- 1.09
- GRM
- 8.0
CMA / ARV
- ARV (on-the-fly)
- $353,115
- Comps found
- 12
Show comp detail 12 sales within ~0.75 mi
| Address | Dist | Beds/Ba | Sqft | Sold | Price | $/sf | Match |
|---|---|---|---|---|---|---|---|
| 295 Ben Til Dr | 0.12mi | 4/2.5 (+1) | 2,102 (+5%) | 1mo | $370,000 | $176 | 76 |
| 229 Yarrow Ln | 0.20mi | 4/2.5 (+1) | 2,028 (+2%) | 7mo | $300,000 | $148 | 73 |
| 314 Cavan Dr | 0.08mi | 3/2.5 | 1,749 (-12%) | 0mo | $395,000 | $226 | 71 |
| 397 Cavan Dr | 0.32mi | 4/3.0 (+1) | 1,908 (-4%) | 6mo | $400,000 | $210 | 62 |
| 315 Challen Dr | 0.52mi | 4/2.5 (+1) | 1,936 (-3%) | 0mo | $423,000 | $218 | 62 |
| 389 Tara Dr | 0.32mi | 3/2.5 | 1,782 (-11%) | 5mo | $335,000 | $188 | 59 |
| 118 Dutch Ln | 0.34mi | 3/3.5 | 1,809 (-9%) | 4mo | $310,000 | $171 | 57 |
| 300 Picture Dr | 0.53mi | 4/2.5 (+1) | 1,944 (-3%) | 6mo | $345,000 | $177 | 57 |
| 538 Brushglen Ln | 0.71mi | 3/2.0 | 1,884 (-6%) | 3mo | $303,000 | $161 | 54 |
| 423 Woodrift Ln | 0.56mi | 4/2.0 (+1) | 1,830 (-8%) | 7mo | $275,000 | $150 | 48 |
| 515 Sequoia Dr | 0.70mi | 4/2.5 (+1) | 1,872 (-6%) | 2mo | $290,000 | $155 | 46 |
| 612 Setter Ln | 0.71mi | 4/2.5 (+1) | 2,280 (+14%) | 3mo | $485,000 | $213 | 32 |
Match score weights: distance 35% · size 25% · config 20% · recency 20%. Top-matched comps best support the ARV.
Projected returns pro-forma
-3.0% appreciation · 5.74% rent growth · sell at horizon
- IRR
- -11.4%
- Equity multiple
- 0.57×
- Total profit
- $-23,921
- Equity at exit
- $29,806
- IRR
- 1.9%
- Equity multiple
- 1.16×
- Total profit
- $8,678
- Equity at exit
- $17,284
Cash invested: $55,972 (down + closing). Projections, not guarantees.
Landlord ↔ Tenant lean methodology
- Overall (STATE)
- 62 Landlord-Friendly
- State Pennsylvania
- 62 Landlord-Friendly · EVEN
- County
- — inherits STATE
- City
- — inherits STATE
ZIP-level market 15236
- Rents YoY
- 5.7%
- Active inventory
- 115
- Price-to-rent
- 8.0×
Monthly cashflow live
- Estimated rent
- $2,094 high interval (Pro) →
- Mortgage (P&I)
- −$1,048
- Tax from tax record
- −$430 /mo · $5,162/yr
- Insurance
- −$83
- Flood insurance flood zone
- −$56 /mo · $666/yr
- HOA
- −$0
- Vacancy / Maint / Mgmt
- −$440
- Net cashflow
- $37
Break-even live
UW: 25.0% down · 7.5% · 30yr · 1.5% tax · 5.0% vac · 8.0% maint · 8.0% mgmt
Financing live
Cash to close
- Down payment
- $49,975
- Closing costs
- $5,997
- Reserves months
- —
- Total cash needed
- —
Loan-product check · same deal, 3 products live
Conventional
25% down · 7.5% · 30yr
- Down + closing
- —
- Monthly P&I
- —
- Monthly cashflow
- —
- DSCR
- —
- Eligible?
- —
Personal DTI + credit; lowest rate.
DSCR
20% down · 8.5% · 30yr
- Down + closing
- —
- Monthly P&I
- —
- Monthly cashflow
- —
- DSCR
- —
- Eligible?
- —
No personal income docs; deal must DSCR.
Hard money
10% down · 12.0% · 12mo
- Down + closing
- —
- Monthly P&I
- —
- Monthly cashflow
- —
- DSCR
- —
- Eligible?
- —
Short-term bridge; refi at stabilization.
Rent comps 5 comps
| Address | Beds | Baths | Sqft | Rent | $/sqft | DOM | Units | Dist |
|---|---|---|---|---|---|---|---|---|
| 1250 Village Green Dr Clairton, PA | 2.0 | 1.0 | 1045 | $1,604 | $1.53 | 1d | 14 | 0.52mi |
| 701 Plaza Dr Pittsburgh, PA | 3.0 | 2.5 | 2050 | $2,800 | $1.37 | 1d | 2 | 0.57mi |
| 305 Plaza Dr Pittsburgh, PA | 3.0 | 2.5 | 2100 | $2,750 | $1.31 | 2d | 1 | 0.68mi |
| 100 Cerasi Dr West Mifflin, PA | 1.0–3.0 | 1.0–2.0 | 1055 | $1,500 | $1.42 | 1d | 1 | 1.03mi |
| 455 Grace St Pleasant Hills, PA | 3.0 | 2.5 | 1912 | $2,400 | $1.26 | 10d | 1 | 1.19mi |
Listing history 1 events
-
2026-05-19$199,900 Active
ⓘ Source: listings_history table (triggers on properties + properties_extension) + one-shot
backfill from property_details.listing_events for pre-trigger history.
Tax reassessment forecast PA · Partial reset (capped growth)
- Current annual tax
- $5,162 · $430/mo
- Projected year-2 tax
- $5,162 · $430/mo
- Expected delta
- $0/yr ($0/mo · 0.0%)
ⓘ Screening estimate from a state-policy table — verify with the county assessor before closing.
Climate risk First Street
- Flood 9/10 Extreme FEMA zone X (unshaded) · 99% chance over 30 yrs
- Wildfire 1/10 Low
- Heat 3/10 Moderate 7 d/yr ≥96°F today · 17 d/yr by 30 yrs out
- Wind 2/10 Low
- Air quality 3/10 Moderate 2 unhealthy d/yr today · 4 by 30 yrs out
Nearby sold comps map
Loading sold comps map…
Walkable amenities ~0.75 mi
Loading nearby amenities…
Taxation est. · year 1
- Rental income
- $25,131
- − Mortgage interest
- −$11,198
- − Property taxes
- −$5,162
- − Insurance
- −$1,666
- − Repairs & maintenance
- −$2,010
- − Management
- −$2,010
- − Depreciation
- −$5,815
- Taxable loss
- −$2,731
- Est. tax savings @ 24.0%
- +$656
- After-tax cash flow
- $1,101/yr
For passive investors: Depreciation is non-cash, so a rental often shows a tax loss while cash-flowing — sheltering income. Rental losses are passive: they offset passive income freely, and up to $25,000/yr can offset ordinary (W-2) income if you actively participate and your MAGI is under $100k (phasing out to $0 by $150k); unused losses carry forward. On sale, claimed depreciation is recaptured at up to 25%, and gains may owe capital-gains tax (a 1031 exchange can defer both). Figures are a year-1 estimate at your 24.0% rate — not tax advice; consult a CPA.
Schools (NCES district)
- District
- West Jefferson Hills SD
- NCES district ID
- 4225590
- Math proficiency
- 48% ▼ -13.00%
- Reading proficiency
- 73% ▼ -10.00%
- Median HH income
- $68,796
- Composite
- 53.19/100
- National rank
- #1503
- State rank
- #60 of 539 in PA
Livability — Pleasant Hills
- Score
- 84/100
- State rank
- #99
- US rank
- #718
Category grades
Schools grade is shown separately in the Schools card above.
Census & demographics
- Census place
- Pleasant Hills, PA
- County
- Allegheny County · 1,022,028 people
- Metro
- Pittsburgh, PA
- Population (ZIP)
- 31,313
- Household income
- $90,767
- Rent vs Own
- Severe rent burden
- 732.0
Population outlook (Allegheny County) Hauer SSP2
- Today (2025)
- 1,250,282 people
- By 2030
- 1,256,482 · +0.5%
- By 2040
- 1,256,318 · +0.5%
- By 2050
- 1,244,169 · -0.5%
- By 2075
- 1,197,693 · -4.2%
- By 2100
- 1,093,187 · -12.6%
Race, ethnicity, and origin ACS 2023
- Neighborhood character
- Predominantly White (83%)
- Race & ethnicity
- White 83% Asian 9% Black 3% Two or more races 3% Hispanic / Latino 2%
- Common ancestry
- Romanian 8% Scotch-Irish 1% Italian 1%
- Foreign-born
- 11% · India, Canada
- Languages at home
- 88% English-only · Other Indo-European 8% Spanish 1% Other Asian/Pacific 1%
Political lean MEDSL · Allegheny
- 2024 margin
- Strong D (+20.3) · D 59.7% · R 39.4%
- 2008→2024 swing
- +4.8pp toward D · 2008: 15.5pp · 2024: 20.3pp
- All cycles
- 2024: D+20.3 2020: D+20.4 2016: D+16.4 2012: D+14.4 2008: D+15.5
Not yet ingested
- Civics
- —
Market trends
- HPI YoY
- ▼ -194.15%
- Current HPI
- 255.0278
- Rent YoY
- ▲ 5.74%
- Metro
- Pittsburgh, PA
- State GDP YoY
- ▲ 1.68%
- F500 in state
- 34
Industry mix (Fortune 500 HQ in PA)
| Industry | F500 HQs | Revenue |
|---|---|---|
| Healthcare | 2 | $309B |
|
||
| Insurance | 2 | $27B |
|
||
| Telecommunications / Media | 1 | $124B |
|
||
| Industrial Distribution | 1 | $22B |
|
||
| Financial Services | 1 | $20B |
|
||
| Chemicals / Materials | 1 | $18B |
|
||
Price history
1 event — show timeline
- 2026-05-19 Listed $199,900 West Penn MLS
Property tax history
+3.2%/yrLatest (2026): $5,162 · +3.0% YoY. Source: county tax records.
Cash-flow waterfall
monthlySold comps — $/sqft
last 12 mo · ≤1 miLoading sold comps…