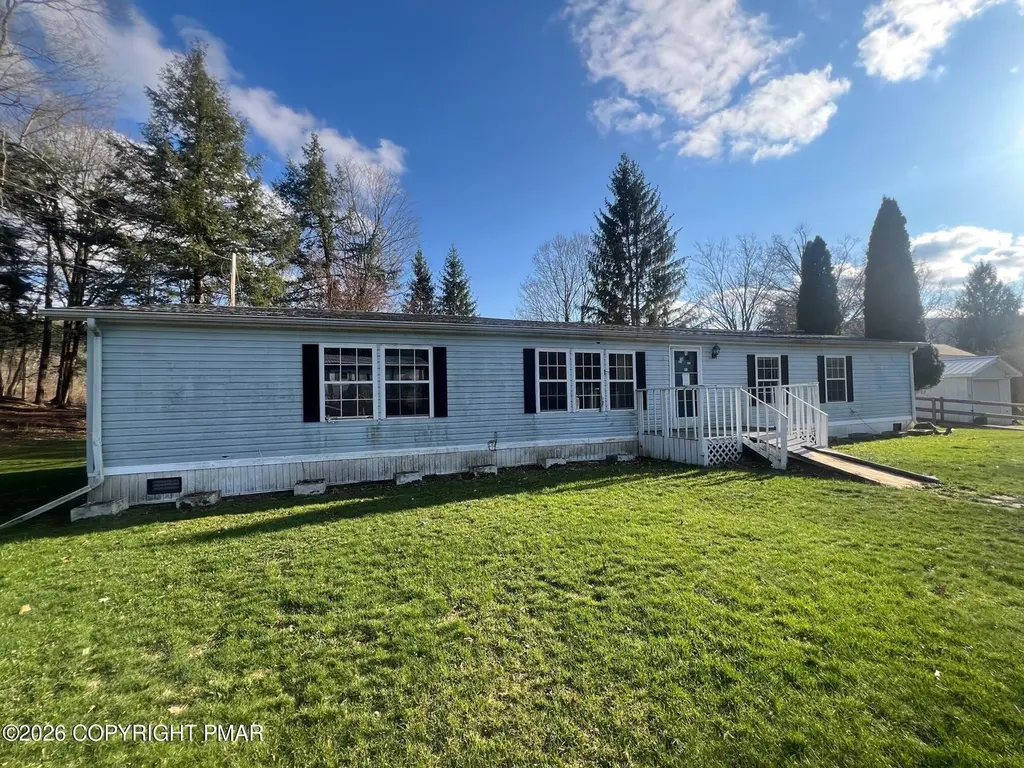
46 Fletchers Rd · Wellsburg, NY
Flood risk 4/10 · Minor
- FEMA flood zone
- X (unshaded)
- Chance of flooding over 30 yrs
- 0.2%
- Est. flood insurance / yr
- $507 – $1,088
Fire risk 4/10 · Minor
- Est. fire insurance / yr
- $511 – $949
Heat risk 2/10 · Minimal
- Hot days now (above 93°F)
- 7 days/yr
- Hot days in 30 yrs
- 16 days/yr
Wind risk 2/10 · Minimal
- Chance of severe wind over 30 yrs
- 1.0%
Air-quality risk 2/10 · Minimal
- Unhealthy air days now
- 0 days/yr
- Unhealthy air days in 30 yrs
- 1 days/yr
Risk factors via First Street. Map © Google.
Why this score? — see what drove the B grade
The composite is a weighted blend of 9 inputs, each scored 0–100. Each bar is that input's sub-score; the figure is the points it added to the 100-point composite (weight × sub-score).
- Cash flow +23.2/30.0
- ARV discount +15.0/15.0
- Appreciation +7.7/10.0
- DSCR +7.5/10.0
- 1% rule +6.5/10.0
- Schools +4.1/10.0
- Livability +3.0/5.0
- Rent growth +2.5/5.0
- Condition / age +2.5/5.0
$112,000
🖨 Deal sheet 📄 Offer letter ✓ Due diligence
Listing remarks MLS
Situated on a beautiful 0.83 acre lot, this mobile would make a perfect weekend getaway or year-round residence! Property boasts: open floor plan, large living room, dining area, 3 bedrooms all with walk-in closets, primary bedroom with private, primary bathroom, detached garage, covered rear deck and more!
Key facts
- Open floor plan
- Dining area
- Walk-in closets
Tags
Neighborhood map
What this means for you Summary
Snapshot
- This is a 3-bed/2.0-bath single-family listed at $112k.
Deal economics
- At list price, monthly cash flow is $203 ($2k/yr) — positive.
- The deal already cash-flows at list — no discount required.
- Meets the 1% rule at list price ($1k rent vs $112k).
- Recommended offer: $99k (12.0% below list) — sets the bar for market timing.
Location & tenants
- Location reads 59/100 on livability (#1,022 in NY) — a working-class tenant base; expect higher turnover. Strengths: cost of living A+, housing A+, employment B; Watch: schools F, crime F, amenities F.
- Athens Area SD (town): math 38% / reading 58% proficiency, ranked #227 of 539 in PA (top 42%) — families likely to look elsewhere, expect single-tenant / working-renter base with shorter leases.
- Market conditions: 66 units permitted in Bradford County in 2024 (0 in 5+ unit buildings).
Forward outlook
- In year one you build about $7k of equity ($774 loan paydown + $6k appreciation (5.4% local appreciation)).
- Bradford County population projected at -23% by 2050 — secular population decline; favor cash flow + early exit over multi-decade hold.
- At projected returns (5.4% appreciation + 3.0% rent growth), your $31k cash investment doubles in ~4 years — after that, you're playing with house money.
- By year 6, paydown + projected appreciation supports a ~$37k cash-out refi (75% LTV) — recoverable capital for the next deal without selling this one.
Negotiation context
- It's been on market 167 days — a 12% lower offer ($99k) is reasonable based on typical stale-listing flexibility.
Questions for the listing agent
- It's been on market 167 days. Have you received any prior offers? Is the seller open to a 12% concession, seller financing, or rate buy-down credit?
- Why hasn't it sold? Are there any deal-killer items the seller is aware of (foundation, flood, title, zoning, code violations)?
- Is there a deadline driving the sale (1031 exchange, divorce, estate, relocation)? That informs how much negotiation room exists.
- Schools are F-rated, which usually means shorter tenancies and higher turnover. Who's the typical renter profile here, and what's been the actual vacancy rate?
- Crime grade is F in this area — have there been break-ins, vandalism, or insurance claims at this property in the last 3 years? What carrier currently insures it and at what premium?
- What's the average days-on-market for RENTAL listings here right now (not sales)? A rising rental-DOM trend means longer vacancies and softer asking-rent achievability than the comps imply.
- What's the recent tenant-quality profile in this submarket — average credit score on applications, eviction rate, late-payment / NSF rate, and stable-employment percentage? A property-management company in the area should have these aggregated.
- How much new for-sale + rental construction is in the pipeline within 1–3 miles? Heavy new supply typically softens prices + rents 12–24 months out; constrained supply supports both.
Investment metrics
- 1% rule
- 1.15% ✓
- Cap rate
- 8.47%
- Cash-on-cash
- 7.76%
- DSCR
- 1.35
- GRM
- 7.3
CMA / ARV
- ARV (median comp)
- $157,675
- List price
- $112,000
- Delta
- -28.97%
- Verdict
- UNDERPRICED
- Comps
- 1 within 2.0 mi
Show comp detail 2 sales within ~0.75 mi
| Address | Dist | Beds/Ba | Sqft | Sold | Price | $/sf | Match |
|---|---|---|---|---|---|---|---|
| 15968 Berwick Tpke | 0.40mi | 3/1.0 | 1,817 (-2%) | 20mo | $110,000 | $61 | 57 |
| 15944 Berwick Tpke | 0.40mi | 4/1.0 (+1) | 1,800 (-3%) | 17mo | $54,900 | $31 | 53 |
Match score weights: distance 35% · size 25% · config 20% · recency 20%. Top-matched comps best support the ARV.
Projected returns pro-forma
5.42% appreciation · 3.0% rent growth · sell at horizon
- IRR
- 20.5%
- Equity multiple
- 2.32×
- Total profit
- $41,444
- Equity at exit
- $66,313
- IRR
- 20.0%
- Equity multiple
- 4.60×
- Total profit
- $113,036
- Equity at exit
- $116,870
Cash invested: $31,360 (down + closing). Projections, not guarantees.
Landlord ↔ Tenant lean methodology
- Overall (STATE)
- 15 Strongly Tenant-Friendly
- State New York
- 15 Strongly Tenant-Friendly · D+10
- County
- — inherits STATE
- City
- — inherits STATE
ZIP-level market 16925
- Home prices YoY
- 2.8%
- Price-to-rent
- 7.3×
Monthly cashflow live
- Estimated rent
- $1,285 medium interval (Pro) →
- Mortgage (P&I)
- −$587
- Tax from tax record
- −$178 /mo · $2,137/yr
- Insurance
- −$47
- HOA
- −$0
- Vacancy / Maint / Mgmt
- −$270
- Net cashflow
- $203
Break-even live
UW: 25.0% down · 7.5% · 30yr · 1.5% tax · 5.0% vac · 8.0% maint · 8.0% mgmt
Financing live
Cash to close
- Down payment
- $28,000
- Closing costs
- $3,360
- Reserves months
- —
- Total cash needed
- —
Loan-product check · same deal, 3 products live
Conventional
25% down · 7.5% · 30yr
- Down + closing
- —
- Monthly P&I
- —
- Monthly cashflow
- —
- DSCR
- —
- Eligible?
- —
Personal DTI + credit; lowest rate.
DSCR
20% down · 8.5% · 30yr
- Down + closing
- —
- Monthly P&I
- —
- Monthly cashflow
- —
- DSCR
- —
- Eligible?
- —
No personal income docs; deal must DSCR.
Hard money
10% down · 12.0% · 12mo
- Down + closing
- —
- Monthly P&I
- —
- Monthly cashflow
- —
- DSCR
- —
- Eligible?
- —
Short-term bridge; refi at stabilization.
Listing history 19 events
-
2026-06-19days on market $112,000 Active 167 DOM
-
2026-06-18days on market $112,000 Active 166 DOM
-
2026-06-17days on market $112,000 Active 165 DOM
-
2026-06-16days on market $112,000 Active 164 DOM
-
2026-06-15days on market $112,000 Active 163 DOM
-
2026-06-14days on market $112,000 Active 161 DOM
-
2026-06-12days on market $112,000 Active 160 DOM
-
2026-06-09days on market $112,000 Active 180 DOM
-
2026-06-08days on market $112,000 Active 179 DOM
-
2026-06-07days on market $112,000 Active 178 DOM
-
2026-06-04days on market $112,000 Active 174 DOM
-
2026-06-02days on market $112,000 Active 173 DOM
-
2026-06-01days on market $112,000 Active 172 DOM
-
2026-05-31days on market $112,000 Active 171 DOM
-
2026-05-31days on market $112,000 Active 170 DOM
-
2026-04-20price $112,000 308-char remark
Show marketing remark (308 chars)
Situated on a beautiful 0.83 acre lot, this mobile would make a perfect weekend getaway or year-round residence! Property boasts: open floor plan, large living room, dining area, 3 bedrooms all with walk-in closets, primary bedroom with private, primary bathroom, detached garage, covered rear deck and more!
-
2026-03-05price $116,900 308-char remark
Show marketing remark (308 chars)
Situated on a beautiful 0.83 acre lot, this mobile would make a perfect weekend getaway or year-round residence! Property boasts: open floor plan, large living room, dining area, 3 bedrooms all with walk-in closets, primary bedroom with private, primary bathroom, detached garage, covered rear deck and more!
-
2026-01-16price $124,900 308-char remark
Show marketing remark (308 chars)
Situated on a beautiful 0.83 acre lot, this mobile would make a perfect weekend getaway or year-round residence! Property boasts: open floor plan, large living room, dining area, 3 bedrooms all with walk-in closets, primary bedroom with private, primary bathroom, detached garage, covered rear deck and more!
-
2025-12-09$129,900 Active 308-char remark
Show marketing remark (308 chars)
Situated on a beautiful 0.83 acre lot, this mobile would make a perfect weekend getaway or year-round residence! Property boasts: open floor plan, large living room, dining area, 3 bedrooms all with walk-in closets, primary bedroom with private, primary bathroom, detached garage, covered rear deck and more!
ⓘ Source: listings_history table (triggers on properties + properties_extension) + one-shot
backfill from property_details.listing_events for pre-trigger history.
Tax reassessment forecast NY · Partial reset (capped growth)
- Current annual tax
- $2,137 · $178/mo
- Projected year-2 tax
- $2,137 · $178/mo
- Expected delta
- $0/yr ($0/mo · 0.0%)
ⓘ Screening estimate from a state-policy table — verify with the county assessor before closing.
Climate risk First Street
- Flood 4/10 Moderate FEMA zone X (unshaded) · 20% chance over 30 yrs
- Wildfire 4/10 Moderate
- Heat 2/10 Low 7 d/yr ≥93°F today · 16 d/yr by 30 yrs out
- Wind 2/10 Low 100% chance of damaging wind over 30 yrs
- Air quality 2/10 Low 0 unhealthy d/yr today · 1 by 30 yrs out
Nearby sold comps map
Loading sold comps map…
Walkable amenities ~0.75 mi
Loading nearby amenities…
Taxation est. · year 1
- Rental income
- $15,416
- − Mortgage interest
- −$6,274
- − Property taxes
- −$2,137
- − Insurance
- −$560
- − Repairs & maintenance
- −$1,233
- − Management
- −$1,233
- − Depreciation
- −$3,258
- Taxable income
- $720
- Est. tax owed @ 24.0%
- −$173
- After-tax cash flow
- $2,260/yr
For passive investors: Depreciation is non-cash, so a rental often shows a tax loss while cash-flowing — sheltering income. Rental losses are passive: they offset passive income freely, and up to $25,000/yr can offset ordinary (W-2) income if you actively participate and your MAGI is under $100k (phasing out to $0 by $150k); unused losses carry forward. On sale, claimed depreciation is recaptured at up to 25%, and gains may owe capital-gains tax (a 1031 exchange can defer both). Figures are a year-1 estimate at your 24.0% rate — not tax advice; consult a CPA.
Schools (NCES district)
- District
- Athens Area SD
- NCES district ID
- 4202670
- Math proficiency
- 38% ▼ -3.00%
- Reading proficiency
- 58% ▼ -2.00%
- Median HH income
- $45,684
- Composite
- 40.64/100
- National rank
- #3683
- State rank
- #227 of 539 in PA
Livability — Wellsburg
- Score
- 59/100
- State rank
- #1022
- US rank
- #19960
Category grades
Schools grade is shown separately in the Schools card above.
Census & demographics
- Population (ZIP)
- 3,378
Population outlook (Bradford County) Hauer SSP2
- Today (2025)
- 57,236 people
- By 2030
- 54,660 · -4.5%
- By 2040
- 49,502 · -13.5%
- By 2050
- 44,277 · -22.6%
- By 2075
- 33,420 · -41.6%
- By 2100
- 22,919 · -60.0%
Race, ethnicity, and origin ACS 2023
- Neighborhood character
- Predominantly White (99%)
- Race & ethnicity
- White 99%
- Common ancestry
- Romanian 3% Iranian 3% Slovak 3%
- Foreign-born
- 1%
Political lean MEDSL · Bradford
- 2024 margin
- Solid R (+47.9) · D 25.6% · R 73.5%
- 2008→2024 swing
- -29.5pp toward R · 2008: -18.4pp · 2024: -47.9pp
- All cycles
- 2024: R+47.9 2020: R+44.9 2016: R+46.0 2012: R+24.6 2008: R+18.4
Not yet ingested
- Civics
- —
Market trends
- HPI YoY
- ▲ 5.42%
- Current HPI
- 198.0044
- Rent YoY
- —
- Metro
- —
- State GDP YoY
- ▲ 2.60%
- F500 in state
- 92
Industry mix (Fortune 500 HQ in NY)
| Industry | F500 HQs | Revenue |
|---|---|---|
| Financial Services | 10 | $950B |
|
||
| Consumer Goods | 9 | $162B |
|
||
| Insurance | 4 | $225B |
|
||
| Telecommunications | 2 | $144B |
|
||
| Pharmaceuticals | 2 | $112B |
|
||
| Media / Entertainment | 2 | $69B |
|
||
Price history
-13.8% since first listed4 events — show timeline
- 2026-04-20 Price Changed $112,000 PMAR
- 2026-03-05 Price Changed $116,900 PMAR
- 2026-01-16 Price Changed $124,900 PMAR
- 2025-12-09 Listed $129,900 PMAR
Property tax history
+1.5%/yrLatest (2026): $2,137 · +6.8% YoY. Source: county tax records.
Cash-flow waterfall
monthlySold comps — $/sqft
last 12 mo · ≤1 miLoading sold comps…