 🏷️ Likely Rental
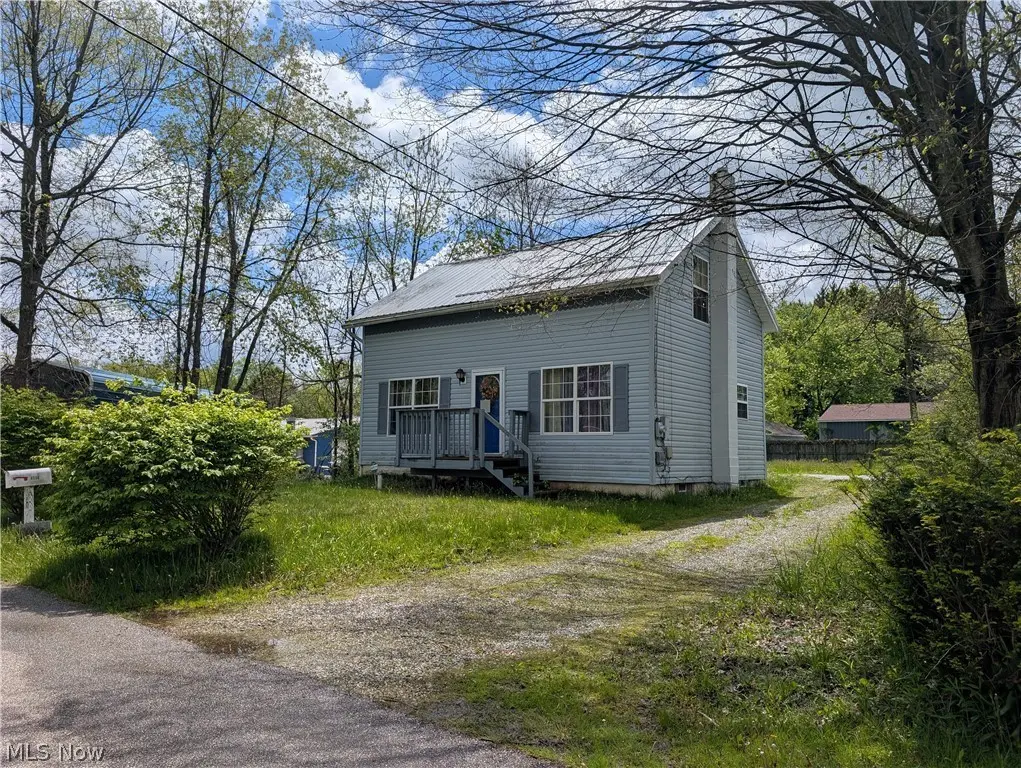
4096 Sherman Rd · Norton, OH
Flood risk 1/10 · Minimal
- FEMA flood zone
- X (unshaded)
- Chance of flooding over 30 yrs
- 0.0%
- Est. flood insurance / yr
- $473 – $860
Fire risk 1/10 · Minimal
- Est. fire insurance / yr
- $713 – $1,323
Heat risk 2/10 · Minimal
- Hot days now (above 96°F)
- 7 days/yr
- Hot days in 30 yrs
- 17 days/yr
Wind risk 1/10 · Minimal
- Chance of severe wind over 30 yrs
- —
Air-quality risk 2/10 · Minimal
- Unhealthy air days now
- 1 days/yr
- Unhealthy air days in 30 yrs
- 1 days/yr
Risk factors via First Street. Map © Google.
Why this score? — see what drove the B- grade
The composite is a weighted blend of 9 inputs, each scored 0–100. Each bar is that input's sub-score; the figure is the points it added to the 100-point composite (weight × sub-score).
- Cash flow +21.7/30.0
- ARV discount +15.0/15.0
- DSCR +6.9/10.0
- Schools +5.9/10.0
- 1% rule +5.5/10.0
- Rent growth +4.0/5.0
- Livability +4.0/5.0
- Condition / age +2.5/5.0
- Appreciation +0.0/10.0
$130,000
🖨 Deal sheet 📄 Offer letter ✓ Due diligence
Listing remarks
Charming country home located in the desirable Norton School District! This 3-bedroom, 1.5-bath home offers plenty of parking with a spacious stone driveway and a beautiful rear deck perfect for relaxing or entertaining. Features include low-maintenance vinyl siding and a durable metal roof. Currently tenant-occupied, this property presents a great opportunity for homeowners or investors looking to expand their portfolio. Serious inquiries only-no wholesalers, seller financing, or rent-to-own options.
Key facts
- Stone driveway
- Metal roof
- Vinyl siding
Tags
Property features AI
Finance
- Financial info: Annual tax amount listed (details available)
Exterior
- Parking: Driveway parking
- Utilities: Well water; Septic tank
- Home design: Two-story home; Above-grade finished area 840 (source: public records)
- Construction: Wood siding exterior; Metal roof
- Exterior features: Driveway
Interior
- Bedrooms: Total of 6 rooms (bedroom count not specified)
- Bathrooms: 1 full bathroom; 1 half bathroom; 1 main-level bathroom
- Heating & cooling: Forced air heating; Heating present
- Interior features: Full unfinished basement
Neighborhood map
What this means for you Summary
Snapshot
- This is a 3-bed/1.0-bath single-family listed at $130k.
Deal economics
- At list price, monthly cash flow is $200 ($2k/yr) — positive.
- The deal already cash-flows at list — no discount required.
- Meets the 1% rule at list price ($1k rent vs $130k).
- Recommended offer: $126k (3.0% below list) — sets the bar for market timing.
- Cap rate 8.1% vs local median 3.2% in Norton — top-decile yield for the area; either an underpriced asset or a hidden risk that comps aren't pricing in. Stress-test before assuming the spread holds.
Location & tenants
- Location reads 80/100 on livability (#118 in OH, #1,738 nationally) — a professional / high-income tenant draw. Strengths: cost of living A+, housing A+, health & safety A+; Watch: amenities F, commute F.
- Norton City (suburban): math 68% / reading 69% proficiency, ranked #152 of 656 in OH (top 23%) — acceptable for families but not a draw, mixed tenant base, ~2y average lease.
- Market conditions: Rents rising fast (+5.9%/yr); 219 active listings in the ZIP; 1,114 units permitted in Summit County in 2024 (397 in 5+ unit buildings).
Forward outlook
- Local home prices are declining (-3.0%/yr); year-one equity from $899 of loan paydown is wiped out by about $4k of value loss. Plan a longer hold.
- Summit County population projected to shrink 6% by 2050 — rents likely to lag national; underwrite the cash flow, not the appreciation.
- At projected returns (-3.0% appreciation + 5.9% rent growth), your $36k cash investment doubles in ~10 years — after that, you're playing with house money.
Negotiation context
- It's been on market 37 days — a 3% lower offer ($126k) is reasonable based on typical stale-listing flexibility.
- 4 sale attempts since 27y ago with the ask held roughly flat each time — persistent listings suggest the price (not the market) is what's stuck; bring a comps-based counter.
Risks & watch-outs
- Watch-outs: built in 1893 — expect roof / HVAC / electrical / plumbing capex.
Questions for the listing agent
- It's been on market 37 days. Have you received any prior offers? Is the seller open to a 3% concession, seller financing, or rate buy-down credit?
- Built in 1893 — when were the roof, HVAC, electrical panel, plumbing, and water heater last replaced?
- Is there a deadline driving the sale (1031 exchange, divorce, estate, relocation)? That informs how much negotiation room exists.
- Schools are A-rated — typically a magnet for longer-tenancy family renters. What's the average tenant stay here, and is there a school-zone premium baked into asking?
- What's the average days-on-market for RENTAL listings here right now (not sales)? A rising rental-DOM trend means longer vacancies and softer asking-rent achievability than the comps imply.
- What's the recent tenant-quality profile in this submarket — average credit score on applications, eviction rate, late-payment / NSF rate, and stable-employment percentage? A property-management company in the area should have these aggregated.
- How much new for-sale + rental construction is in the pipeline within 1–3 miles? Heavy new supply typically softens prices + rents 12–24 months out; constrained supply supports both.
Investment metrics
- 1% rule
- 1.05% ✓
- Cap rate
- 8.14%
- Cash-on-cash
- 6.60%
- DSCR
- 1.29
- GRM
- 7.9
CMA / ARV
- ARV (median comp)
- $234,420
- List price
- $130,000
- Delta
- -44.54%
- Verdict
- UNDERPRICED
- Comps
- 10 within 1.0 mi
Projected returns pro-forma
-3.0% appreciation · 5.86% rent growth · sell at horizon
- IRR
- -3.0%
- Equity multiple
- 0.88×
- Total profit
- $-4,242
- Equity at exit
- $19,383
- IRR
- 9.6%
- Equity multiple
- 1.84×
- Total profit
- $30,418
- Equity at exit
- $11,240
Cash invested: $36,400 (down + closing). Projections, not guarantees.
Landlord ↔ Tenant lean methodology
- Overall (STATE)
- 73 Landlord-Friendly
- State Ohio
- 73 Landlord-Friendly · R+6
- County
- — inherits STATE
- City
- — inherits STATE
ZIP-level market 44203
- Rents YoY
- 5.9%
- Active inventory
- 219
- Price-to-rent
- 7.9×
Monthly cashflow live
- Estimated rent
- $1,369 medium interval (Pro) →
- Mortgage (P&I)
- −$682
- Tax from tax record
- −$146 /mo · $1,748/yr
- Insurance
- −$54
- HOA
- −$0
- Vacancy / Maint / Mgmt
- −$288
- Net cashflow
- $200
Break-even live
UW: 25.0% down · 7.5% · 30yr · 1.5% tax · 5.0% vac · 8.0% maint · 8.0% mgmt
Financing live
Cash to close
- Down payment
- $32,500
- Closing costs
- $3,900
- Reserves months
- —
- Total cash needed
- —
Loan-product check · same deal, 3 products live
Conventional
25% down · 7.5% · 30yr
- Down + closing
- —
- Monthly P&I
- —
- Monthly cashflow
- —
- DSCR
- —
- Eligible?
- —
Personal DTI + credit; lowest rate.
DSCR
20% down · 8.5% · 30yr
- Down + closing
- —
- Monthly P&I
- —
- Monthly cashflow
- —
- DSCR
- —
- Eligible?
- —
No personal income docs; deal must DSCR.
Hard money
10% down · 12.0% · 12mo
- Down + closing
- —
- Monthly P&I
- —
- Monthly cashflow
- —
- DSCR
- —
- Eligible?
- —
Short-term bridge; refi at stabilization.
Listing history 21 events
-
2026-06-18days on market $130,000 Active 37 DOM
-
2026-06-17days on market $130,000 Active 36 DOM
-
2026-06-16days on market $130,000 Active 35 DOM
-
2026-06-15days on market $130,000 Active 34 DOM
-
2026-06-14days on market $130,000 Active 32 DOM
-
2026-06-10days on market $130,000 Active 29 DOM
-
2026-06-09days on market $130,000 Active 28 DOM
-
2026-06-08days on market $130,000 Active 27 DOM
-
2026-06-07days on market $130,000 Active 26 DOM
-
2026-06-03days on market $130,000 Active 22 DOM
-
2026-06-02days on market $130,000 Active 21 DOM
-
2026-06-01days on market $130,000 Active 20 DOM
-
2026-05-31days on market $130,000 Active 19 DOM
-
2026-05-31days on market $130,000 Active 18 DOM
-
2026-05-11$130,000 Active 509-char remark
-
2015-07-22historical
-
2015-07-02$24,900 Active
-
2002-04-07historical
-
2001-09-19$49,900
-
2000-07-25historical
-
1999-11-19$79,900
ⓘ Source: listings_history table (triggers on properties + properties_extension) + one-shot
backfill from property_details.listing_events for pre-trigger history.
Tax reassessment forecast OH · Partial reset (capped growth)
- Current annual tax
- $1,748 · $146/mo
- Projected year-2 tax
- $1,888 · $157/mo
- Expected delta
- +$140/yr (+$12/mo · 8.0%)
ⓘ Screening estimate from a state-policy table — verify with the county assessor before closing.
Climate risk First Street
- Flood 1/10 Low FEMA zone X (unshaded) · 0% chance over 30 yrs
- Wildfire 1/10 Low
- Heat 2/10 Low 7 d/yr ≥96°F today · 17 d/yr by 30 yrs out
- Wind 1/10 Low
- Air quality 2/10 Low 1 unhealthy d/yr today · 1 by 30 yrs out
Nearby sold comps map
Loading sold comps map…
Walkable amenities ~0.75 mi
Loading nearby amenities…
Taxation est. · year 1
- Rental income
- $16,434
- − Mortgage interest
- −$7,282
- − Property taxes
- −$1,748
- − Insurance
- −$650
- − Repairs & maintenance
- −$1,315
- − Management
- −$1,315
- − Depreciation
- −$3,782
- Taxable income
- $343
- Est. tax owed @ 24.0%
- −$82
- After-tax cash flow
- $2,322/yr
For passive investors: Depreciation is non-cash, so a rental often shows a tax loss while cash-flowing — sheltering income. Rental losses are passive: they offset passive income freely, and up to $25,000/yr can offset ordinary (W-2) income if you actively participate and your MAGI is under $100k (phasing out to $0 by $150k); unused losses carry forward. On sale, claimed depreciation is recaptured at up to 25%, and gains may owe capital-gains tax (a 1031 exchange can defer both). Figures are a year-1 estimate at your 24.0% rate — not tax advice; consult a CPA.
Schools (NCES district)
- District
- Norton City
- NCES district ID
- 3904455
- Math proficiency
- 68% ▼ -7.00%
- Reading proficiency
- 69% ▼ -5.00%
- Median HH income
- $61,163
- Composite
- 59.19/100
- National rank
- #946
- State rank
- #152 of 656 in OH
Livability — Norton
- Score
- 80/100
- State rank
- #118
- US rank
- #1738
Category grades
Schools grade is shown separately in the Schools card above.
Census & demographics
- Census place
- Norton, OH
- County
- Summit County · 440,783 people
- City population
- 38,705
- Metro
- Akron, OH
- Population (ZIP)
- 38,701
- Household income
- $63,759
- Rent vs Own
- Severe rent burden
- 805.0
Population outlook (Summit County) Hauer SSP2
- Today (2025)
- 546,583 people
- By 2030
- 544,028 · -0.5%
- By 2040
- 531,363 · -2.8%
- By 2050
- 514,923 · -5.8%
- By 2075
- 481,765 · -11.9%
- By 2100
- 432,265 · -20.9%
Race, ethnicity, and origin ACS 2023
- Neighborhood character
- Predominantly White (86%)
- Race & ethnicity
- White 86% Black 7% Two or more races 5% Hispanic / Latino 1%
- Common ancestry
- Romanian 3% Slovak 2% Italian 1%
- Foreign-born
- 2% · Canada
- Languages at home
- 97% English-only · Russian/Polish/Slavic 1% Spanish 1%
Political lean MEDSL · Summit
- 2024 margin
- Lean D (+7.0) · D 53.0% · R 46.0%
- 2008→2024 swing
- -9.6pp toward R · 2008: 16.6pp · 2024: 7.0pp
- All cycles
- 2024: D+7.0 2020: D+9.6 2016: D+8.2 2012: D+14.8 2008: D+16.6
Not yet ingested
- Civics
- —
Market trends
- HPI YoY
- ▼ -224.82%
- Current HPI
- 199.8143
- Rent YoY
- ▲ 5.86%
- Metro
- Akron, OH
- State GDP YoY
- ▲ 1.98%
- F500 in state
- 48
Industry mix (Fortune 500 HQ in OH)
| Industry | F500 HQs | Revenue |
|---|---|---|
| Insurance | 3 | $145B |
|
||
| Industrial Machinery | 3 | $49B |
|
||
| Financial Services | 3 | $24B |
|
||
| Consumer Goods | 2 | $93B |
|
||
| Aerospace / Defense | 2 | $47B |
|
||
| Utilities | 2 | $33B |
|
||
Price history
+62.7% since first listed7 events — show timeline
- 2026-05-11 Listed $130,000 MLSNOW
- 2015-07-22 Listing Removed — MLSNOW
- 2015-07-02 Listed $24,900 MLSNOW
- 2002-04-07 Listing Removed — MLSNOW
- 2001-09-19 Listed $49,900 MLSNOW
- 2000-07-25 Listing Removed — MLSNOW
- 1999-11-19 Listed $79,900 MLSNOW
Property tax history
+8.9%/yrLatest (2025): $1,748 · +0.1% YoY. Source: county tax records.
Cash-flow waterfall
monthlySold comps — $/sqft
last 12 mo · ≤1 miLoading sold comps…